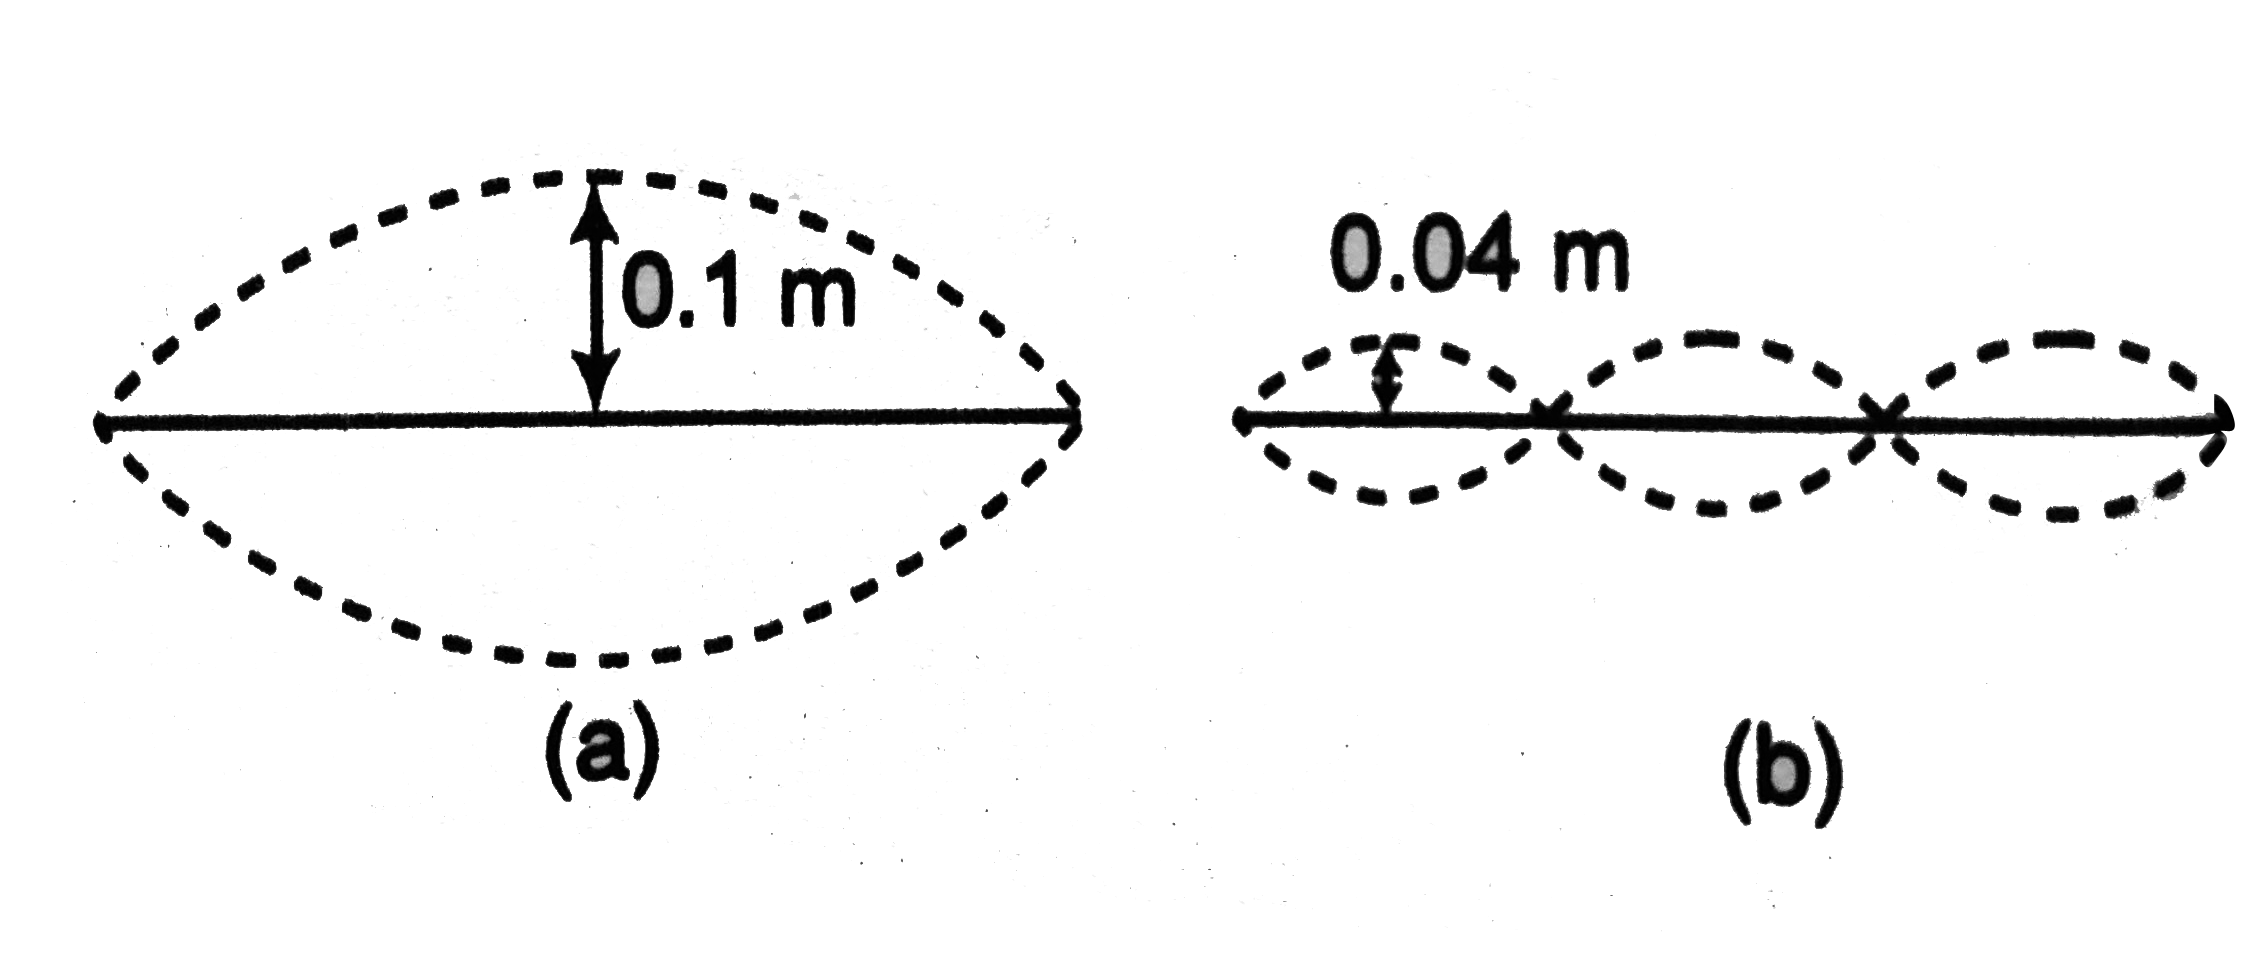
Figure shows different standing wave patterns on a string of linear mass density 4.0×10⁻²kg/m under a tension of 100 N. The amplitude of antinodes is indicated in each figure. The length of the string is 2.0m.
(i) Obtain the frequencies of the modes shown in figures (a) and (b).
(ii)Write down the transverse displacement y as a function of x and t for each mode. (Take the initial configuration of the wire in each mode to be as shown by the dark lines in the figure).

The correct Answer is:A, B, C, D
(i) fa=v2l=√T/μ2l
=√(100/4×10−22×2)
=12.5Hz.
fb=3(v2l)=3fa=37.5Hz.<br>(ii)omega = 2pi f<br>:. Omega_a = 2pif_a = 25 pi <br>omega_(b) = 2pif_(b) = 75pi<br>v = sqrt (T/mu) = sqrt(100/(4xx 10^(-2)<br>= 50 m//s<br>k = omega/v <br>:. k_a = (omega_a)/v = (25pi)/50 = pi/2<br>k_b = (omega_b)/v = (75pi)/50 = (3pi)/2
Topper's Solved these Questions
- SUPERPOSITION OF WAVESBOOK - DC PANDEY ENGLISHCHAPTER - SUPERPOSITION OF WAVESEXERCISE - Subjective Questions
6 Videos
- SUPERPOSITION OF WAVESBOOK - DC PANDEY ENGLISHCHAPTER - SUPERPOSITION OF WAVESEXERCISE - Level 2 Single Correct
15 Videos
- SUPERPOSITION OF WAVESBOOK - DC PANDEY ENGLISHCHAPTER - SUPERPOSITION OF WAVESEXERCISE - Objective Questions
1 Videos
- SOUND WAVESBOOK - DC PANDEY ENGLISHCHAPTER - SOUND WAVESEXERCISE - Exercise 19.7
4 Videos
- THERMOMETRY THERMAL EXPANSION AND KINETIC THEORY OF GASESBOOK - DC PANDEY ENGLISHCHAPTER - THERMOMETRY THERMAL EXPANSION AND KINETIC THEORY OF GASESEXERCISE - Medical entrance gallary
30 Videos
Similar Questions
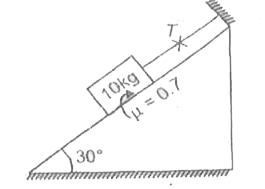
The tension T in the string shown in figure is

View SolutionA piano string having a mass per unit length equal to 5.00×10³kg/m is under a tension of 1350N, Find the speed with which a wave travels on this string.
View SolutionCalculate the velocity of a transverse wave along a string of length 2m and mass 0.06kg under a tension of 500N.
View SolutionA 200Hz wave with amplitude 1mm travels on a long string of linear mass density 6g/m keep under a tension of 60N.
(a) Find the average power transmitted across a given point on the string.
(b) Find the total energy associated with the wave in a 2.0m long portion of the string.
View SolutionA 200Hz wave with amplitude 1mm travels on a long string of linear mass density 6g/m keep under a tension of 60N.
(a) Find the average power transmitted across a given point on the string.
(b) Find the total energy associated with the wave in a 2.0m long portion of the string.
View SolutionA string of linear mass density 5.0×10⁻³ kg//m is stretched under a tension of 65 N between two rigid supports 60 cm apart.
(a) If the string is vibrating in its second overtone so that the amplitude at one of its antinodes is 0.25 cm, what are the maximum transverse speed and acceleration of the string at antinodes?
(b) What are these quantities at a distance 5.0 cm from an node?
View SolutionThe velocity of transverse wave in string whose linear mass density is 3×10⁻²kgm stretched by a load of 30 kg is (Take g=10ms2)
View SolutionSpeed of transverse wave in a string of density 100kg/m3 and area of cross-section 10mm2 under a tension of 103 N is
View SolutionA 2.0m long string with a linear mass density of 5.2×10⁻³kgm−1 and tension 52N has both of its ends fixed. It vibrates in a standing wave patten with four antinodes. Frequency of the vibraion is :-
View SolutionA 100 Hz sinusoidal wave is travelling in the positve x - direaction along a string with a linear mass density of 3.5×10⁻³kgm−1 and a tension of 35 N. At time t =0 ,the point x=0 has zero displacment and the slope of the string is π/20then select the wrong alternative.
View Solution
