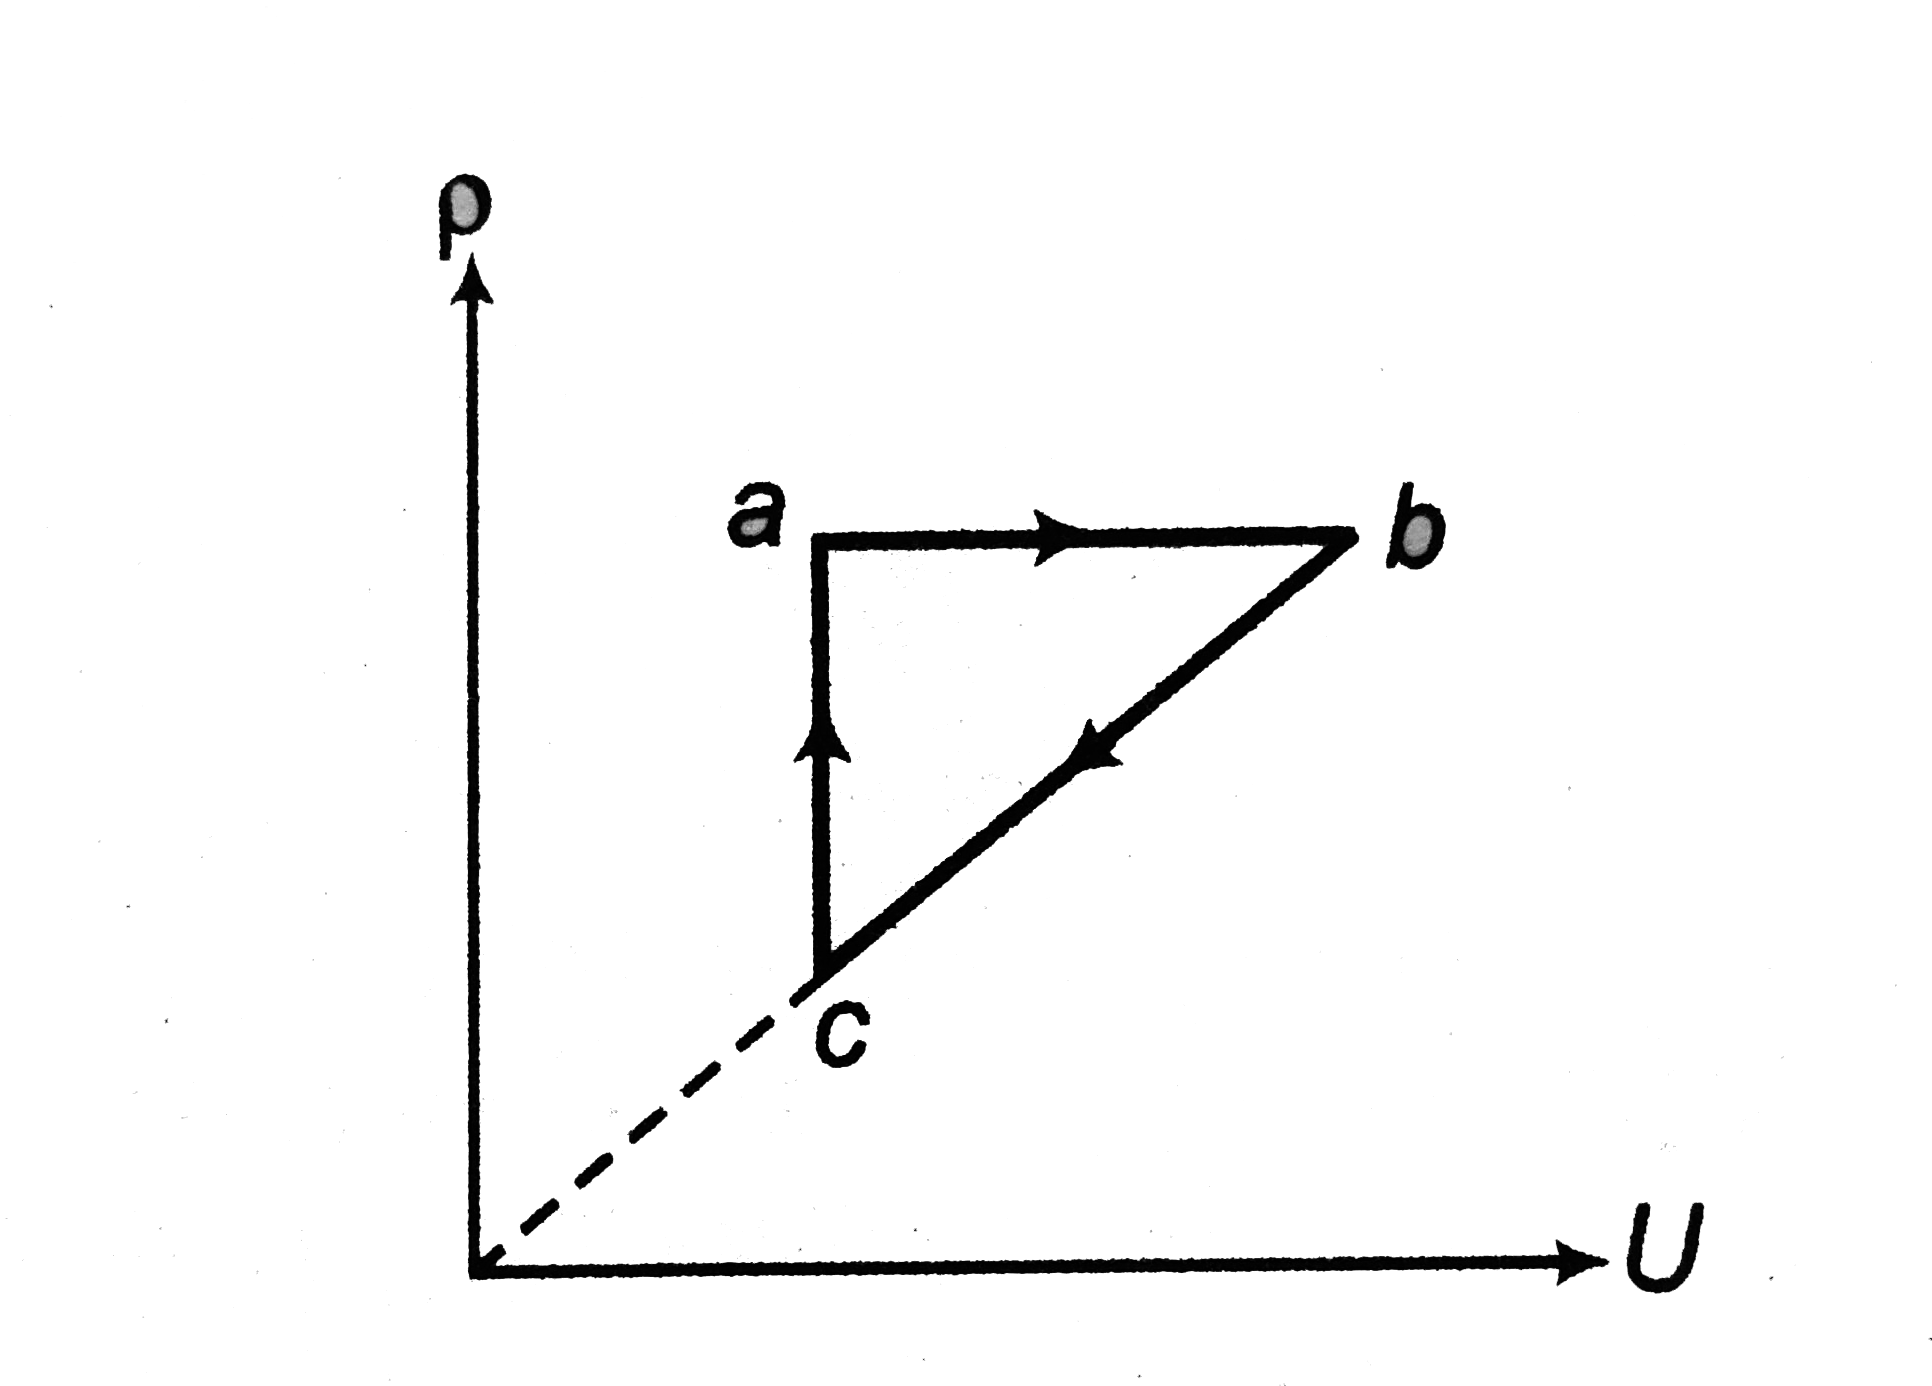
Density versus internal energy (U) graph of a gas is as shown in figure. Choose the correct options.
Here, W is work done by gas and Q is heat given to the gas.
(a)
(b)
(c)
(d)
The correct Answer is:C, D
ab constant
constant
is positive, as U is increasing.
Hence, Q is also positive.
bc
is decreasing, so V is increasing. Hence, work done is positive.
Further,
constant
In the process, constant,
Molar heat capacity is given by
Here,
For any of the gas, .
as and
ca
is increasing. Hence, V is decreasing. So, work done is negative.
Topper's Solved these Questions
- LAWS OF THERMODYNAMICSBOOK - DC PANDEY ENGLISHCHAPTER - LAWS OF THERMODYNAMICSEXERCISE - Level 2 Passage I
2 Videos
- LAWS OF THERMODYNAMICSBOOK - DC PANDEY ENGLISHCHAPTER - LAWS OF THERMODYNAMICSEXERCISE - Level 2 Passage II
3 Videos
- LAWS OF THERMODYNAMICSBOOK - DC PANDEY ENGLISHCHAPTER - LAWS OF THERMODYNAMICSEXERCISE - Level 2 Single Correct
27 Videos
- LAWS OF MOTIONBOOK - DC PANDEY ENGLISHCHAPTER - LAWS OF MOTIONEXERCISE - Medical entrances gallery
39 Videos
- MAGNETIC EFFECT OF CURRENT AND MAGNETISMBOOK - DC PANDEY ENGLISHCHAPTER - MAGNETIC EFFECT OF CURRENT AND MAGNETISMEXERCISE - Integer type Questions
10 Videos
Similar Questions
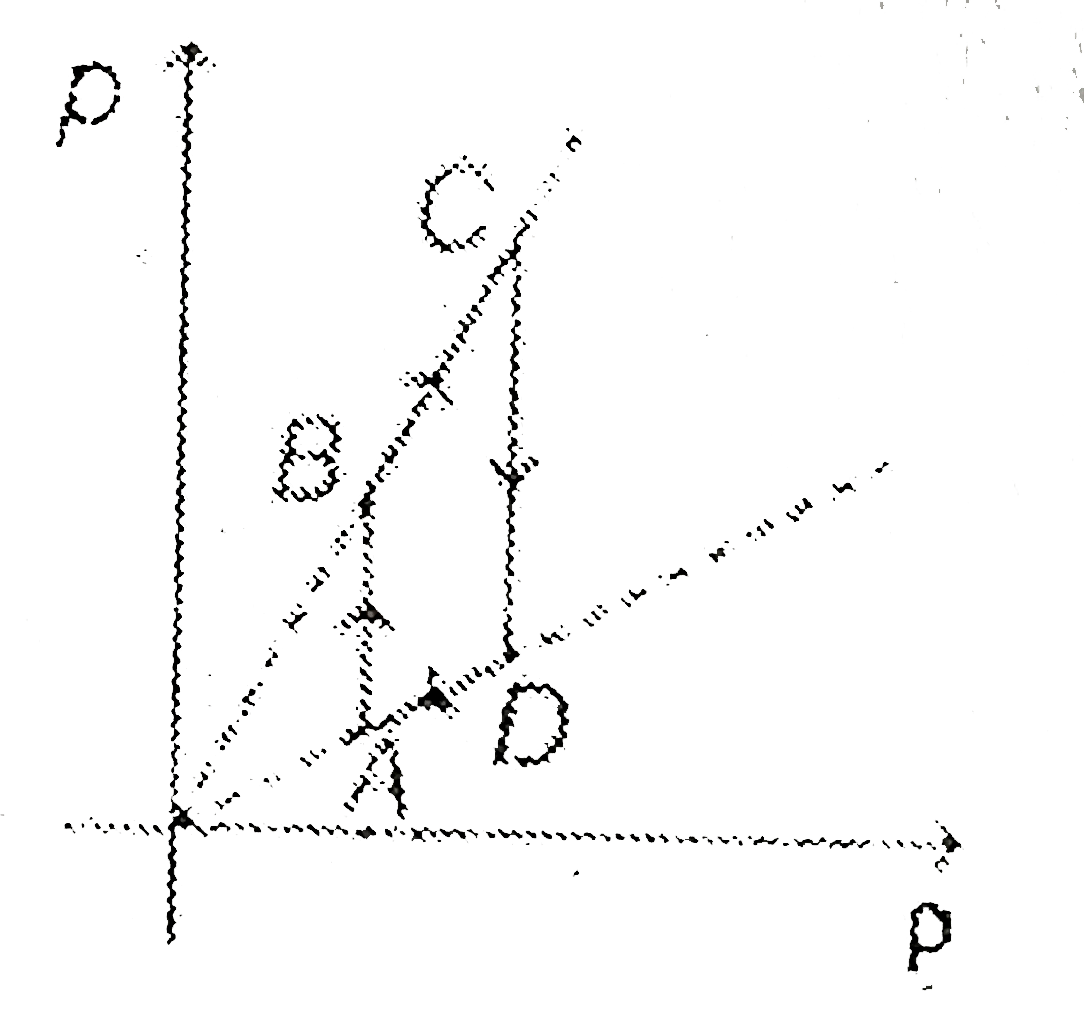
Pressure versus density graph of an ideal gas is shown in figure
View SolutionPressure versus temperature graphs of an ideal gas are as shown in figure. Choose the wrong statement
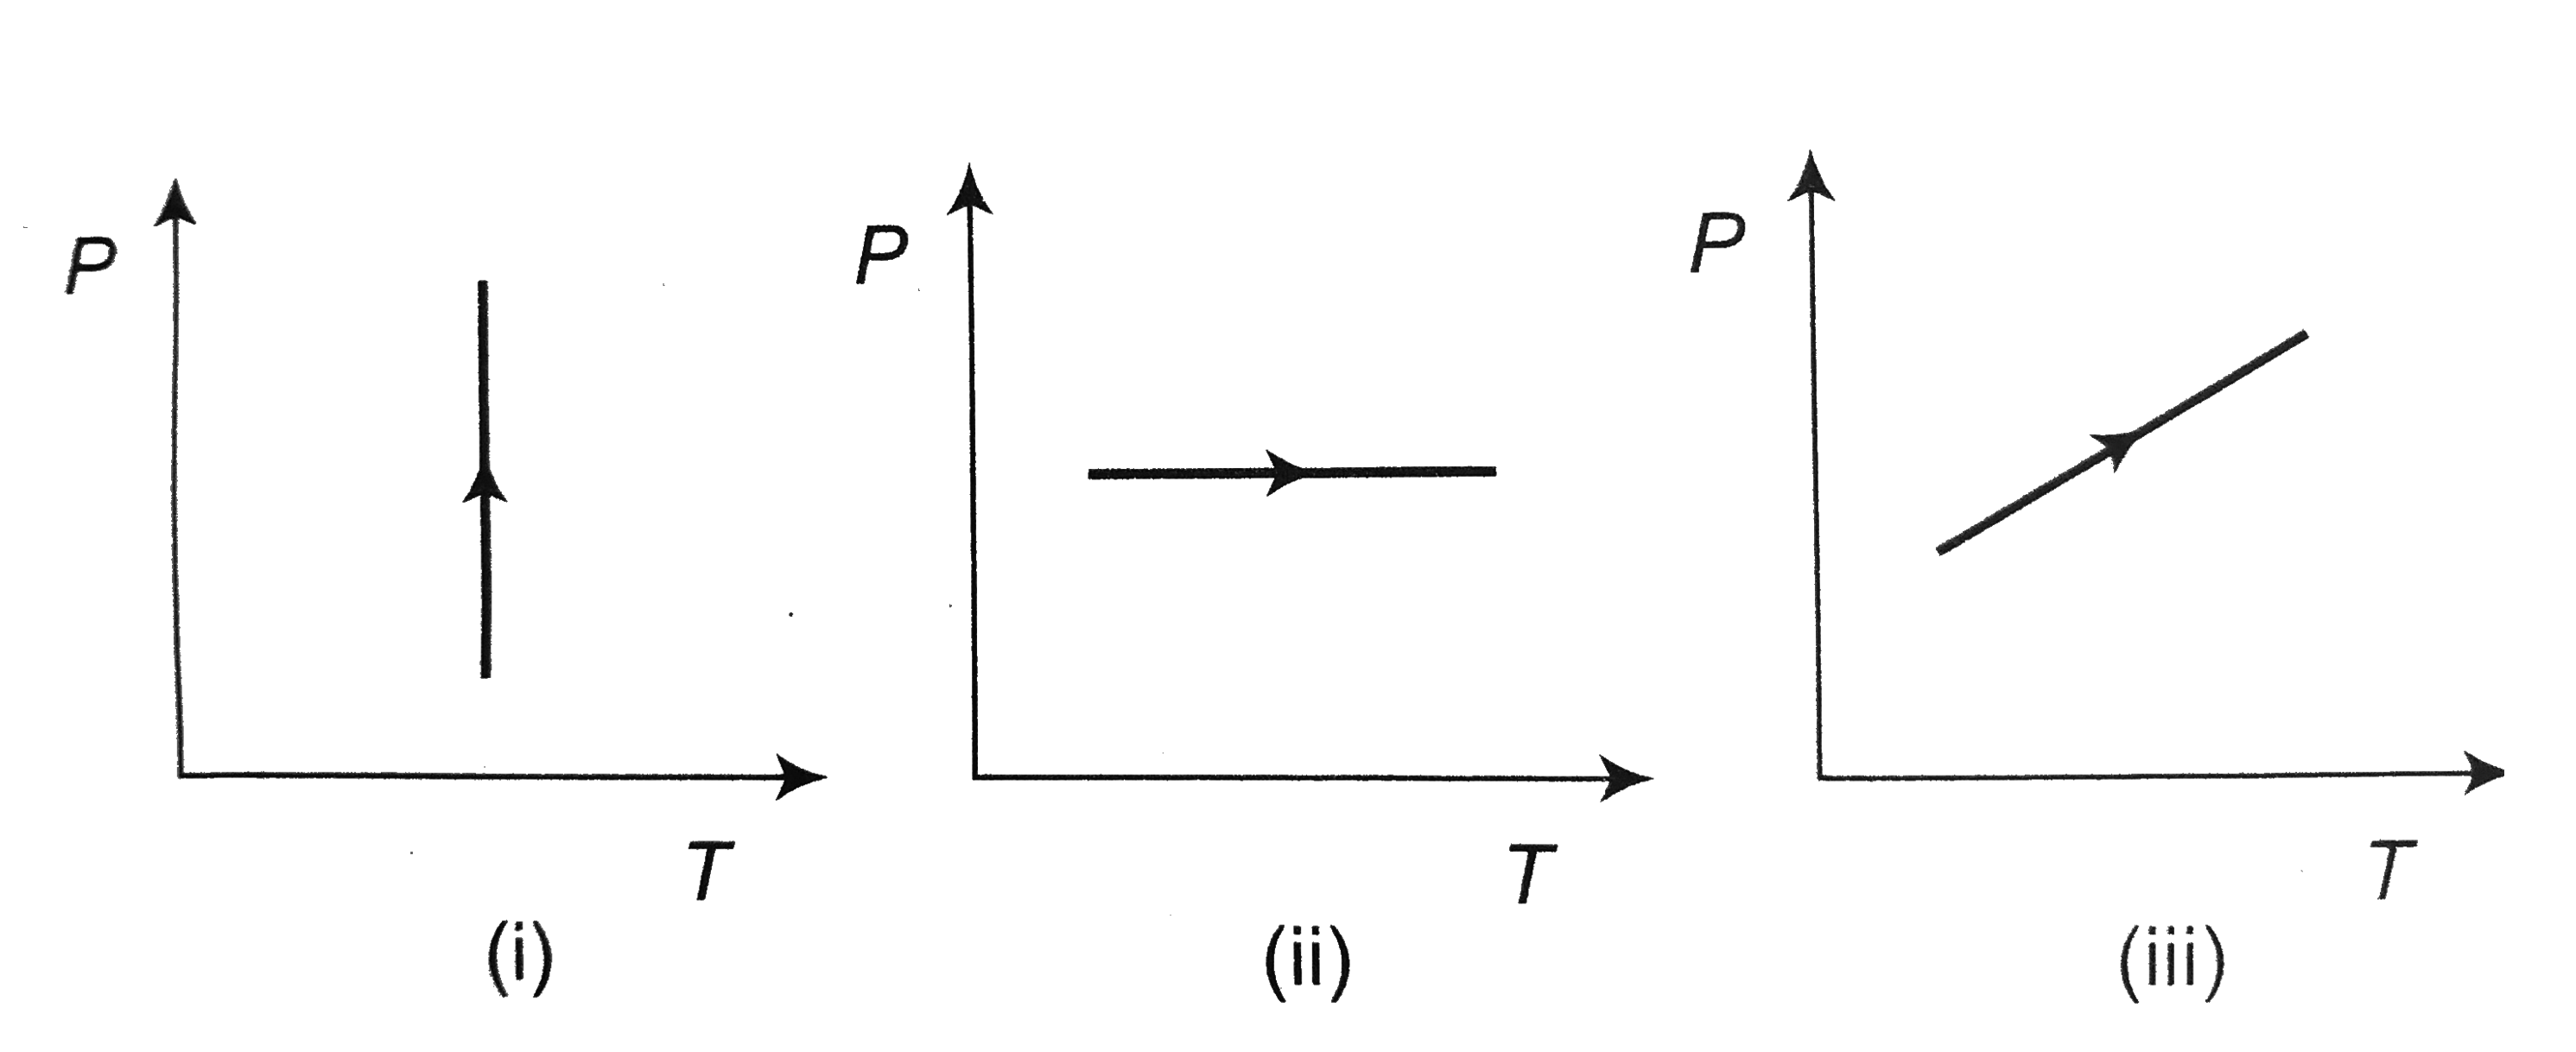
View SolutionPressure versus temperature graphs of an ideal gas are as shown in figure. Choose the wrong statement

View SolutionOn the P−T graph of an ideal gas, choose the correct option(s):
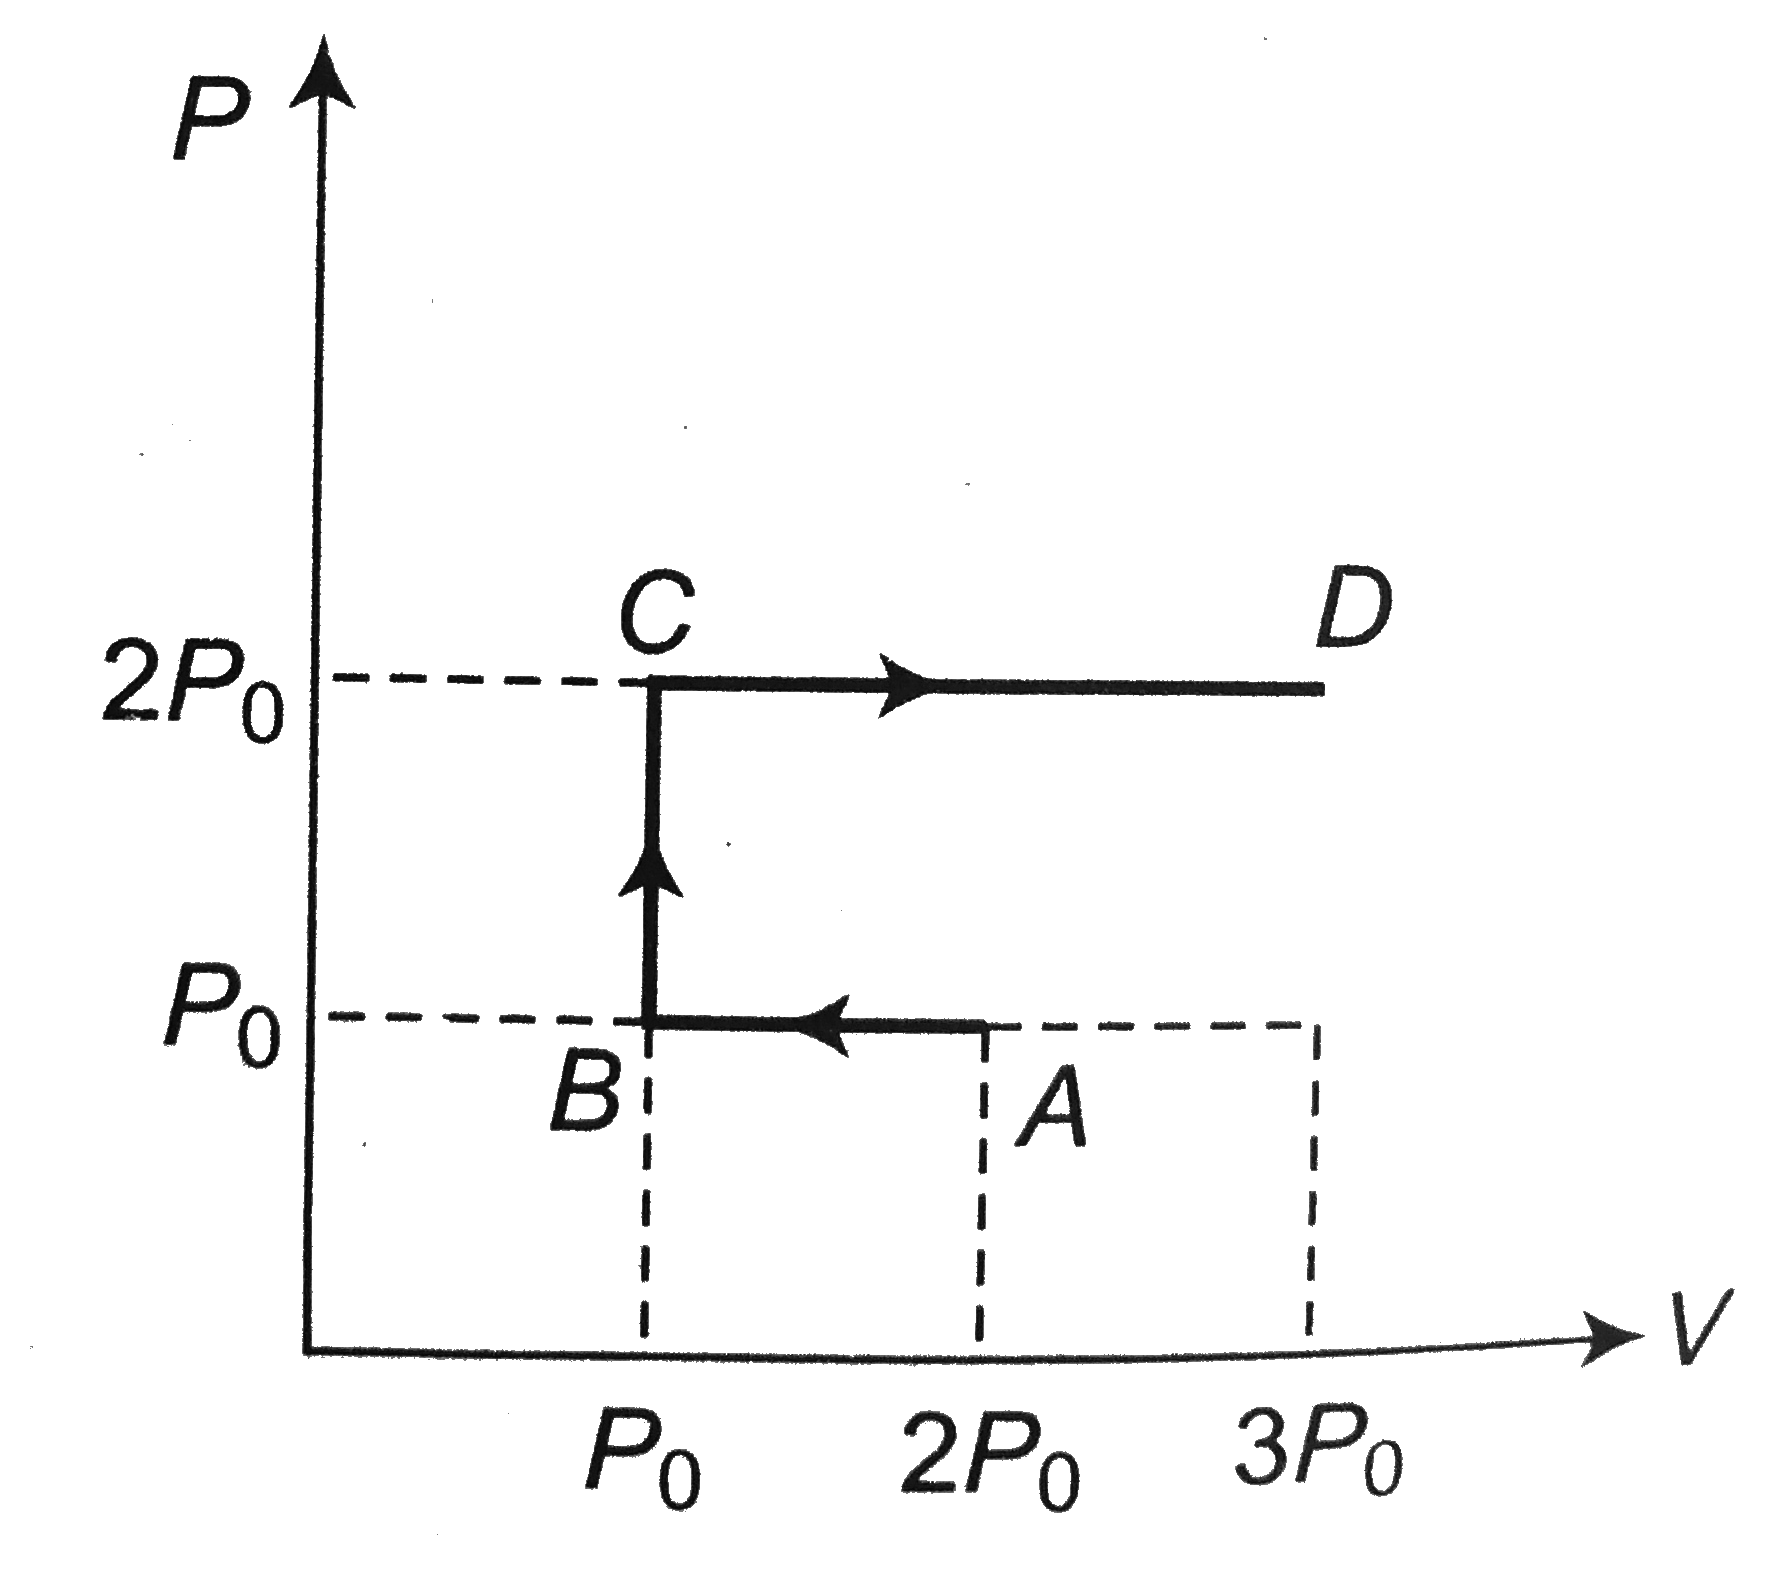
View SolutionP−V diagram of an ideal gas is as shown in figure. Work done by the gas in process ABCD is
View Solutiongraph of an ideal gas is as shown in figure.
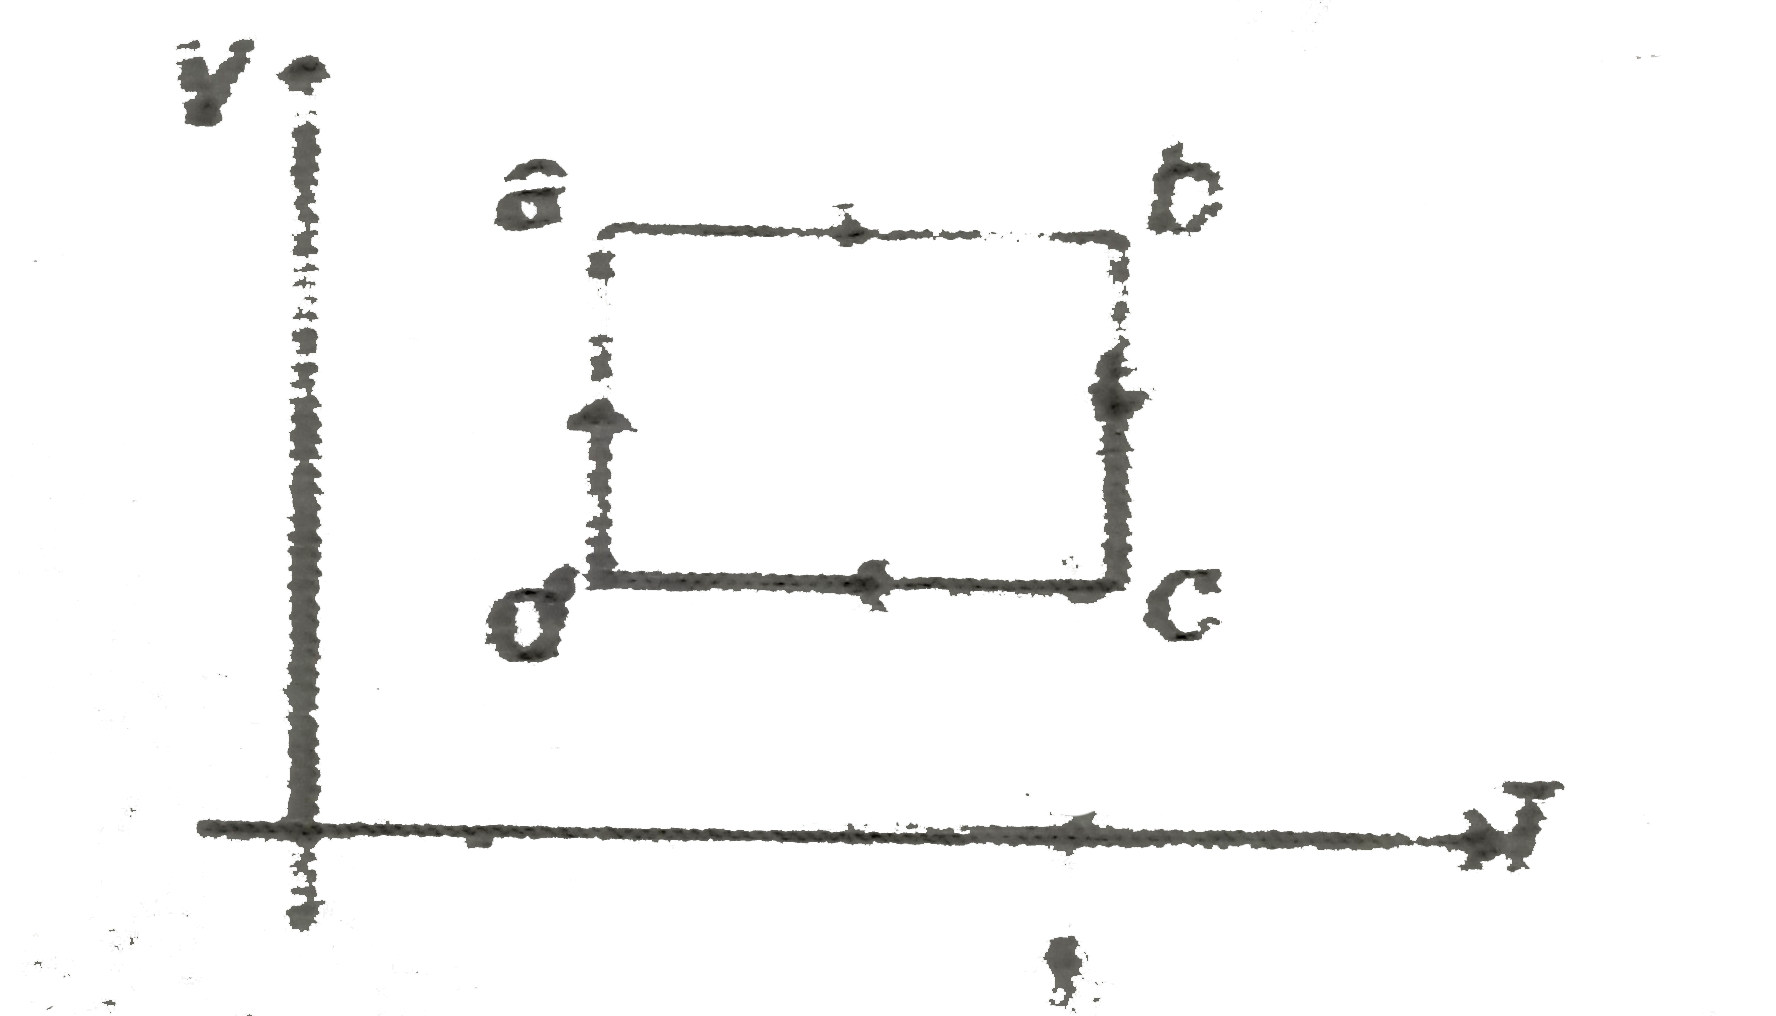
Work done by the gas in complete cyclic process about is
View Solutiongraph of an ideal gas is as shown in figure.
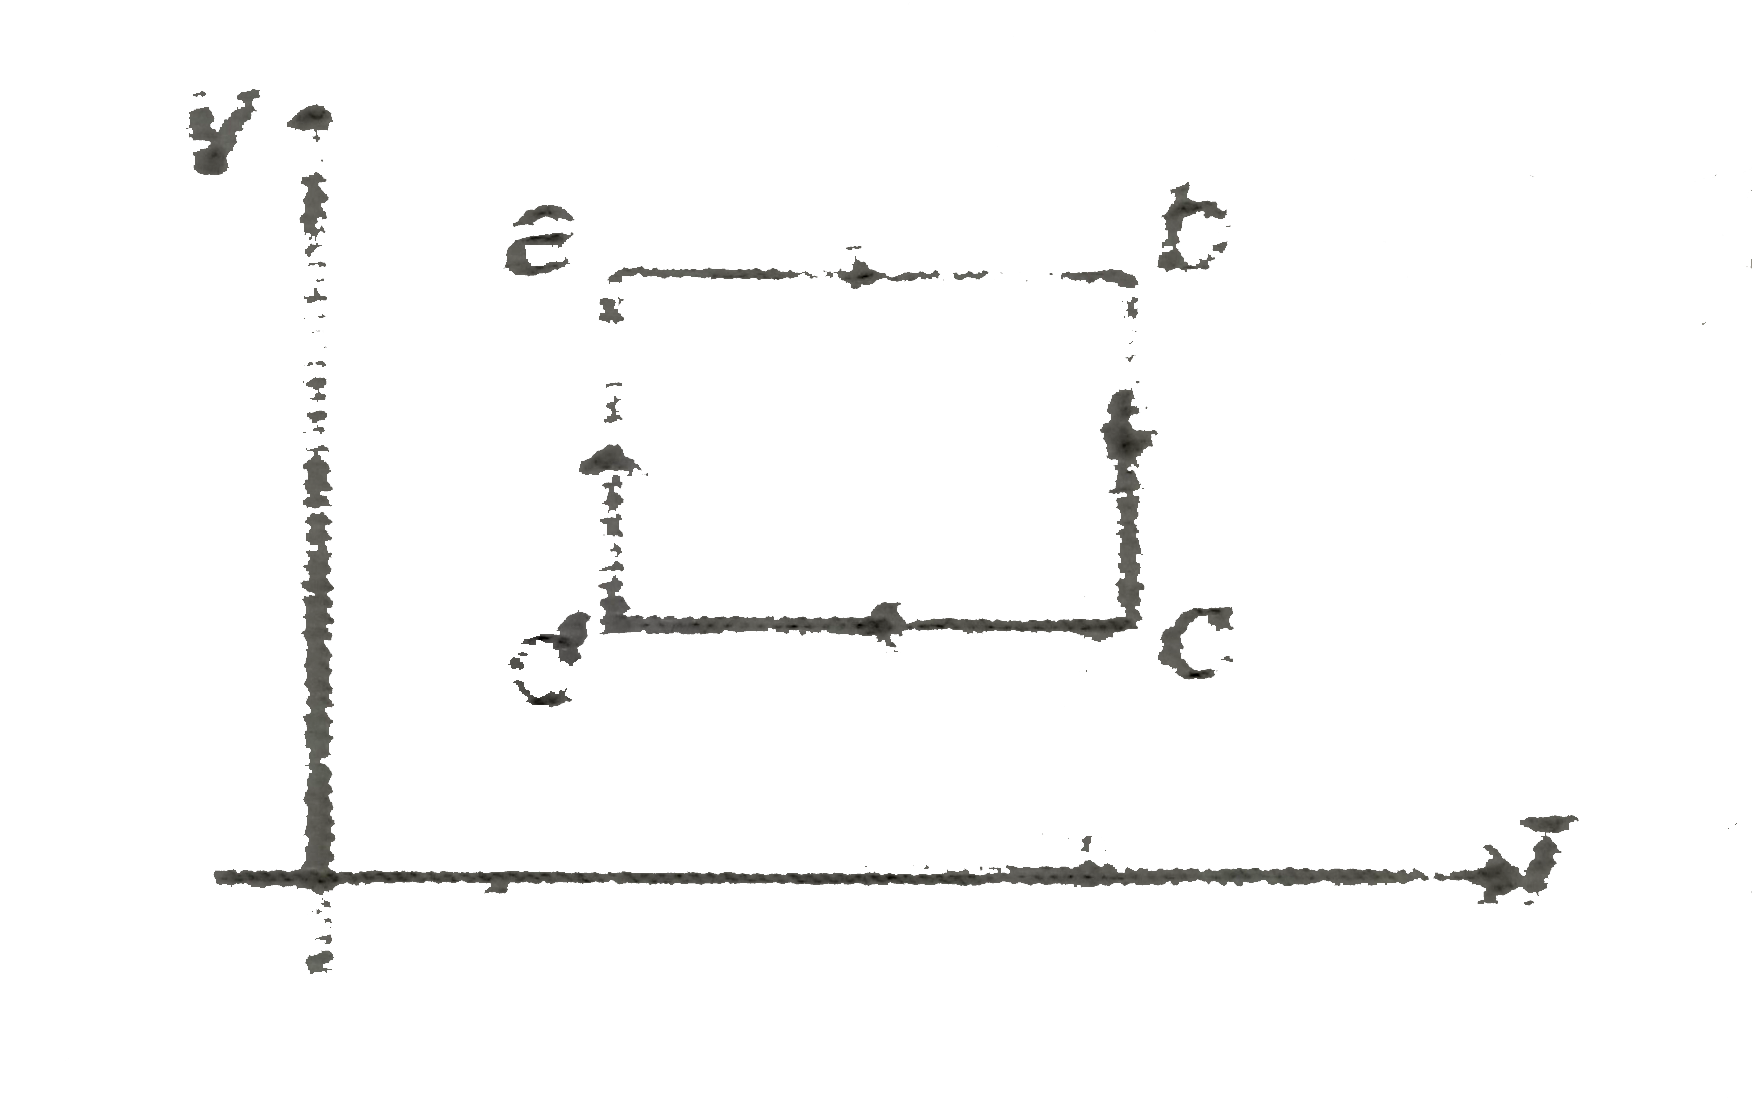
Heat is supplied to the gas in process (s).
View SolutionP-V diagram of an ideal gas is as shown in figure. Work done by the gas in the process ABCD is

View SolutionVolume versus temperature graph of two moles of helium gas is as shown in figure. The ratio of heat absorbed and the work done by the gas in process 1−2 is
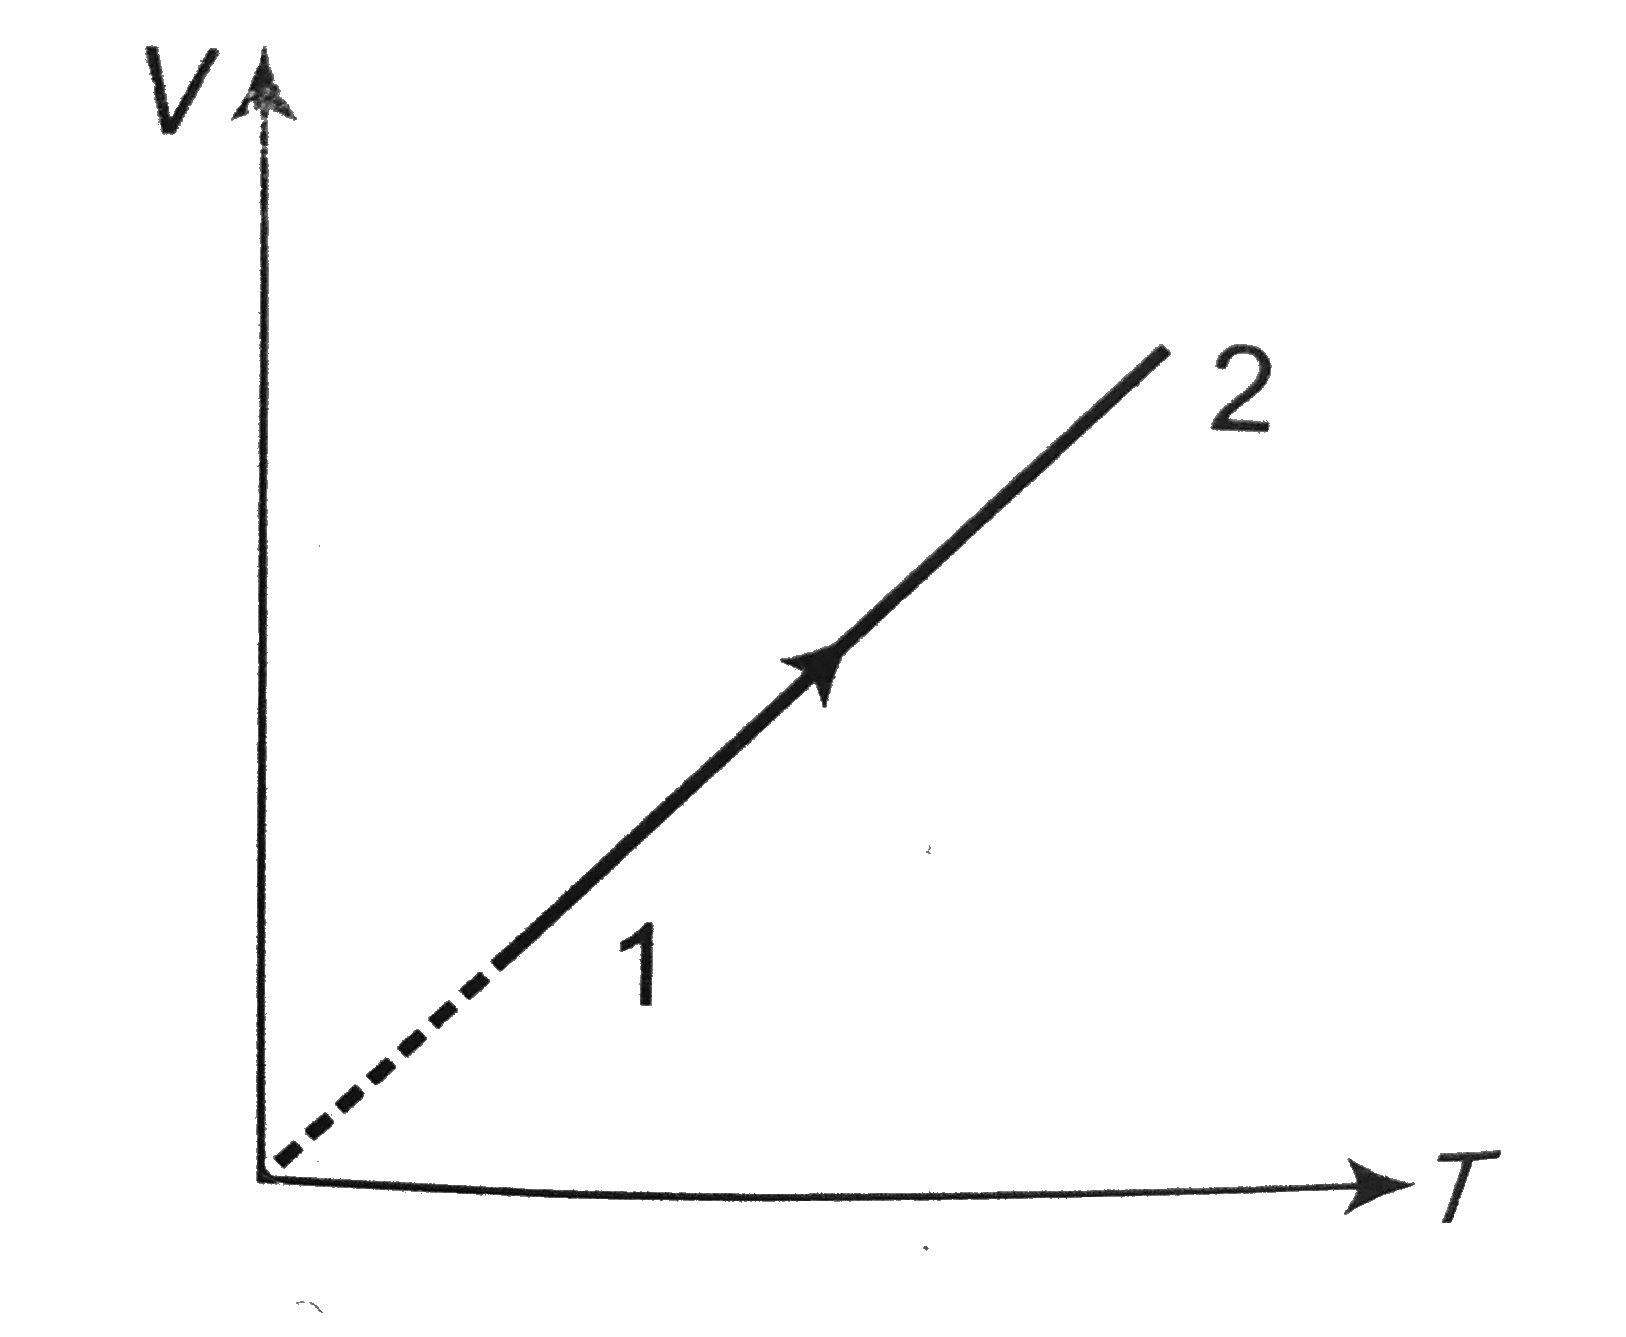
View SolutionVolume versus temperature graph of two moles of helium gas is as shown in figure. The ratio of heat absorbed and the work done by the gas in process 1−2 is

View Solution
