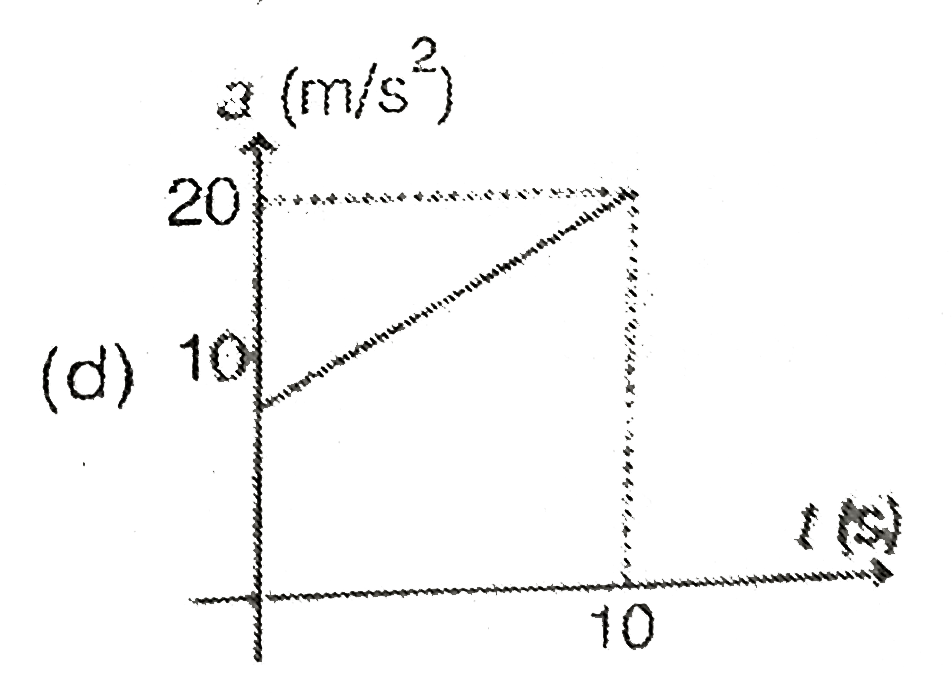
Acceleration of two identical particles moving in a straight line are as shown in figure.
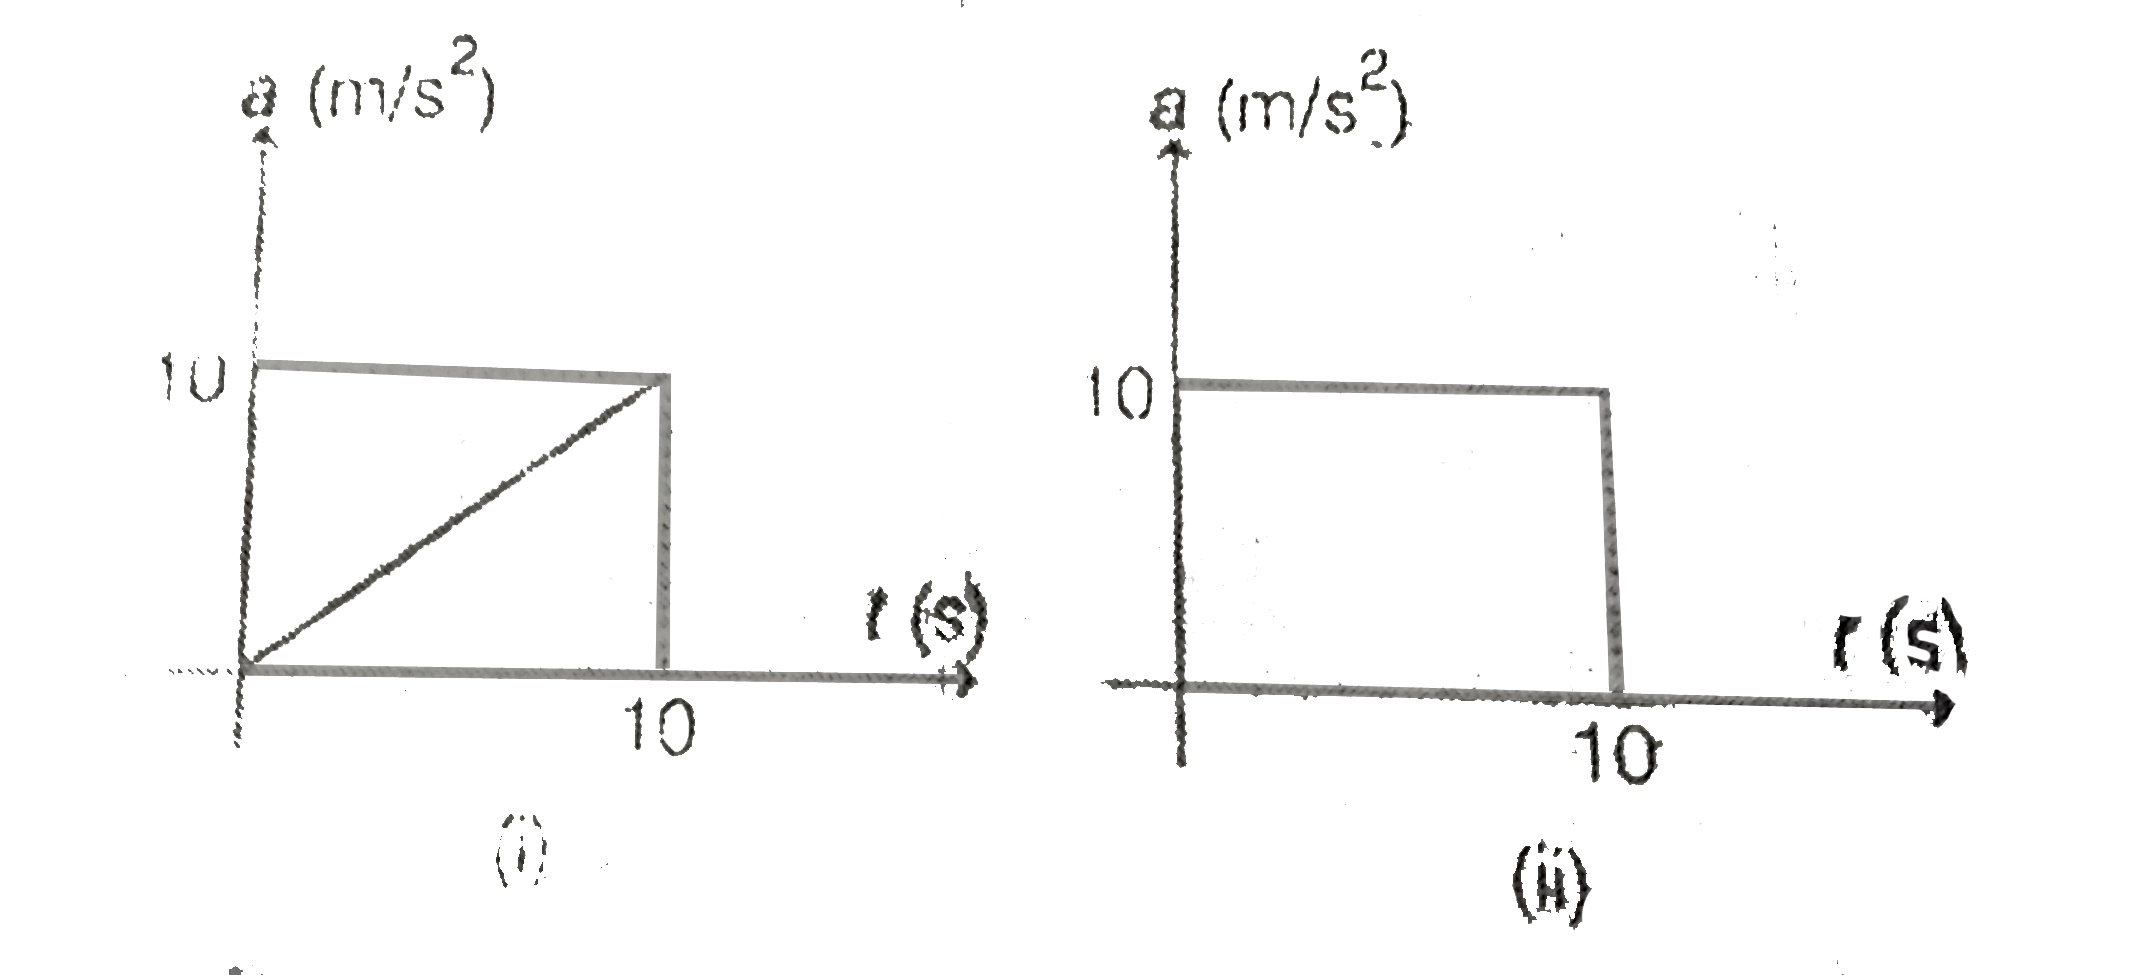
The corresponding a-t graph of their centre of mass will be
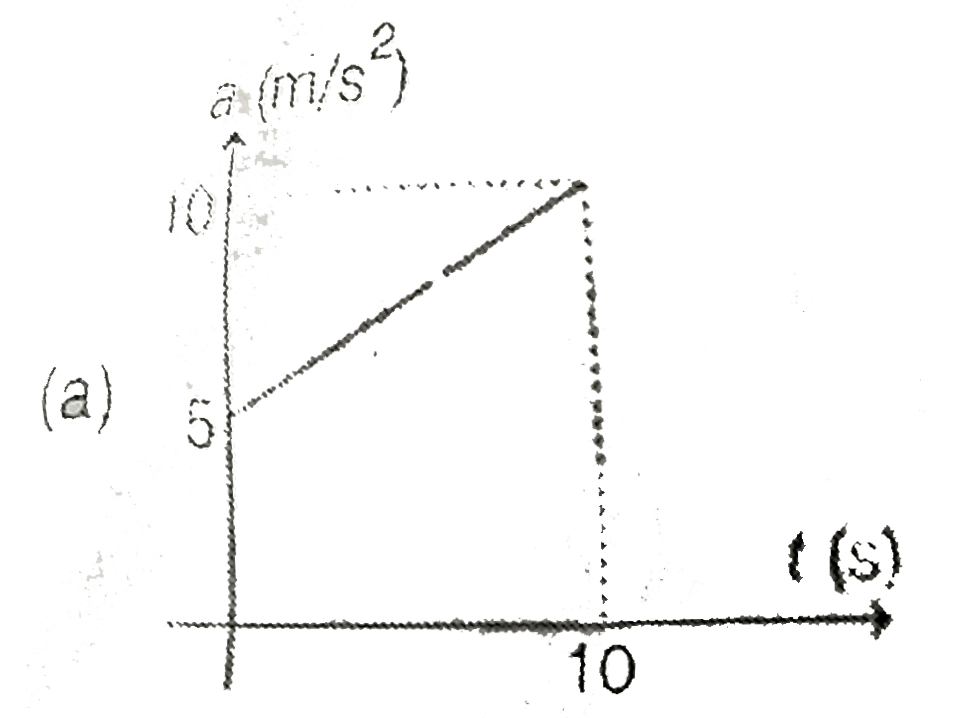
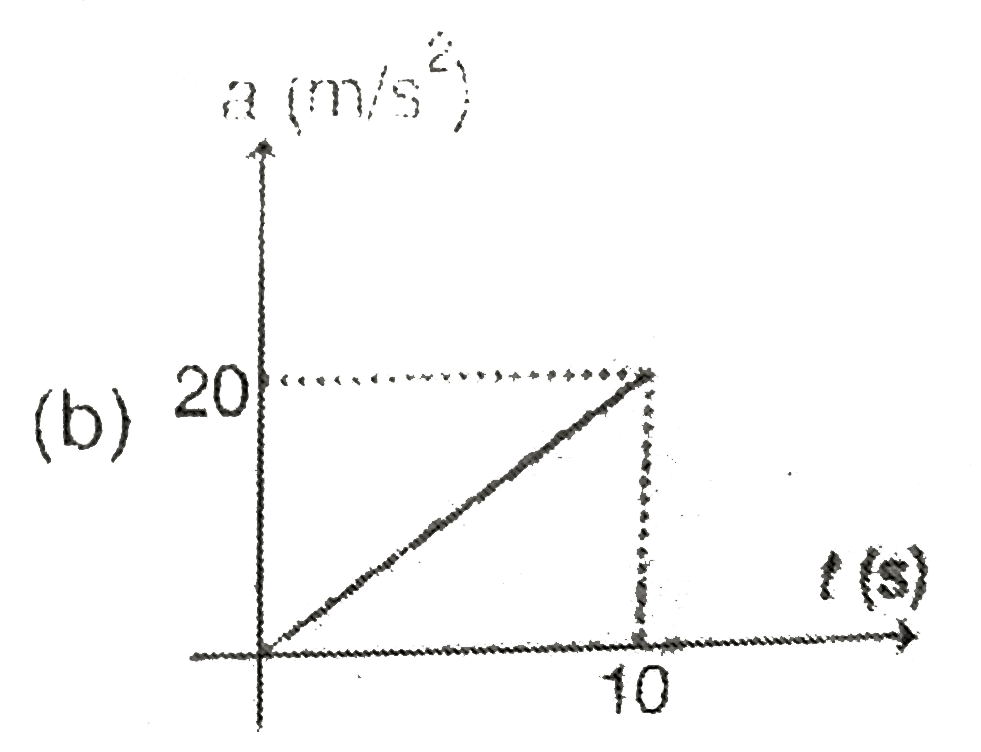
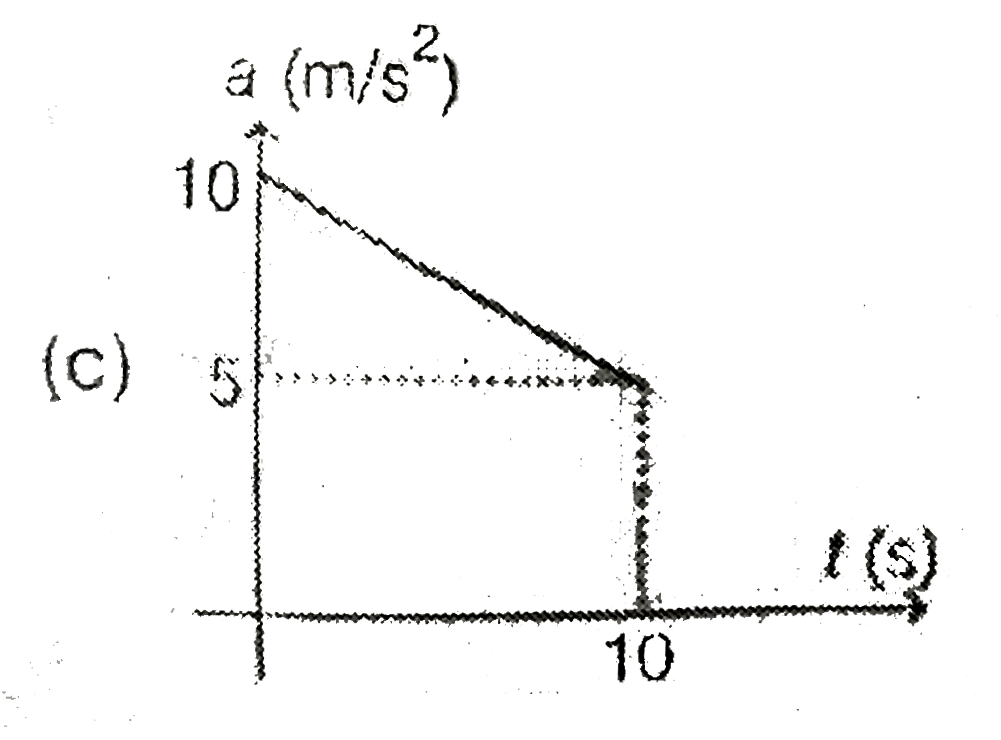
Step by step video & image solution for Acceleration of two identical particles moving in a straight line are as shown in figure. The corresponding a-t graph of their centre of mass will be by Physics experts to help you in doubts & scoring excellent marks in Class 11 exams.
Updated on:21/07/2023Topper's Solved these Questions
- CENTRE OF MASS, IMPULSE AND MOMENTUMBook:DC PANDEY ENGLISHChapter:CENTRE OF MASS, IMPULSE AND MOMENTUMExercise:More a than one option is Correct
Explore 1 Video
- CENTRE OF MASSBook:DC PANDEY ENGLISHChapter:CENTRE OF MASSExercise:Medical entrances gallery
Explore 27 Videos
- CENTRE OF MASS, LINEAR MOMENTUM AND COLLISIONBook:DC PANDEY ENGLISHChapter:CENTRE OF MASS, LINEAR MOMENTUM AND COLLISIONExercise:Level 2 Subjective
Explore 21 Videos
Similar Questions
Displacement time graph of a particle moving in a straight line is a shown in figure.

View SolutionVelocity displacement graph of a particle moving in a straight line is as shown in figure.

View SolutionAcceleration of two identical particles moving in a straight line are as shown in figure.
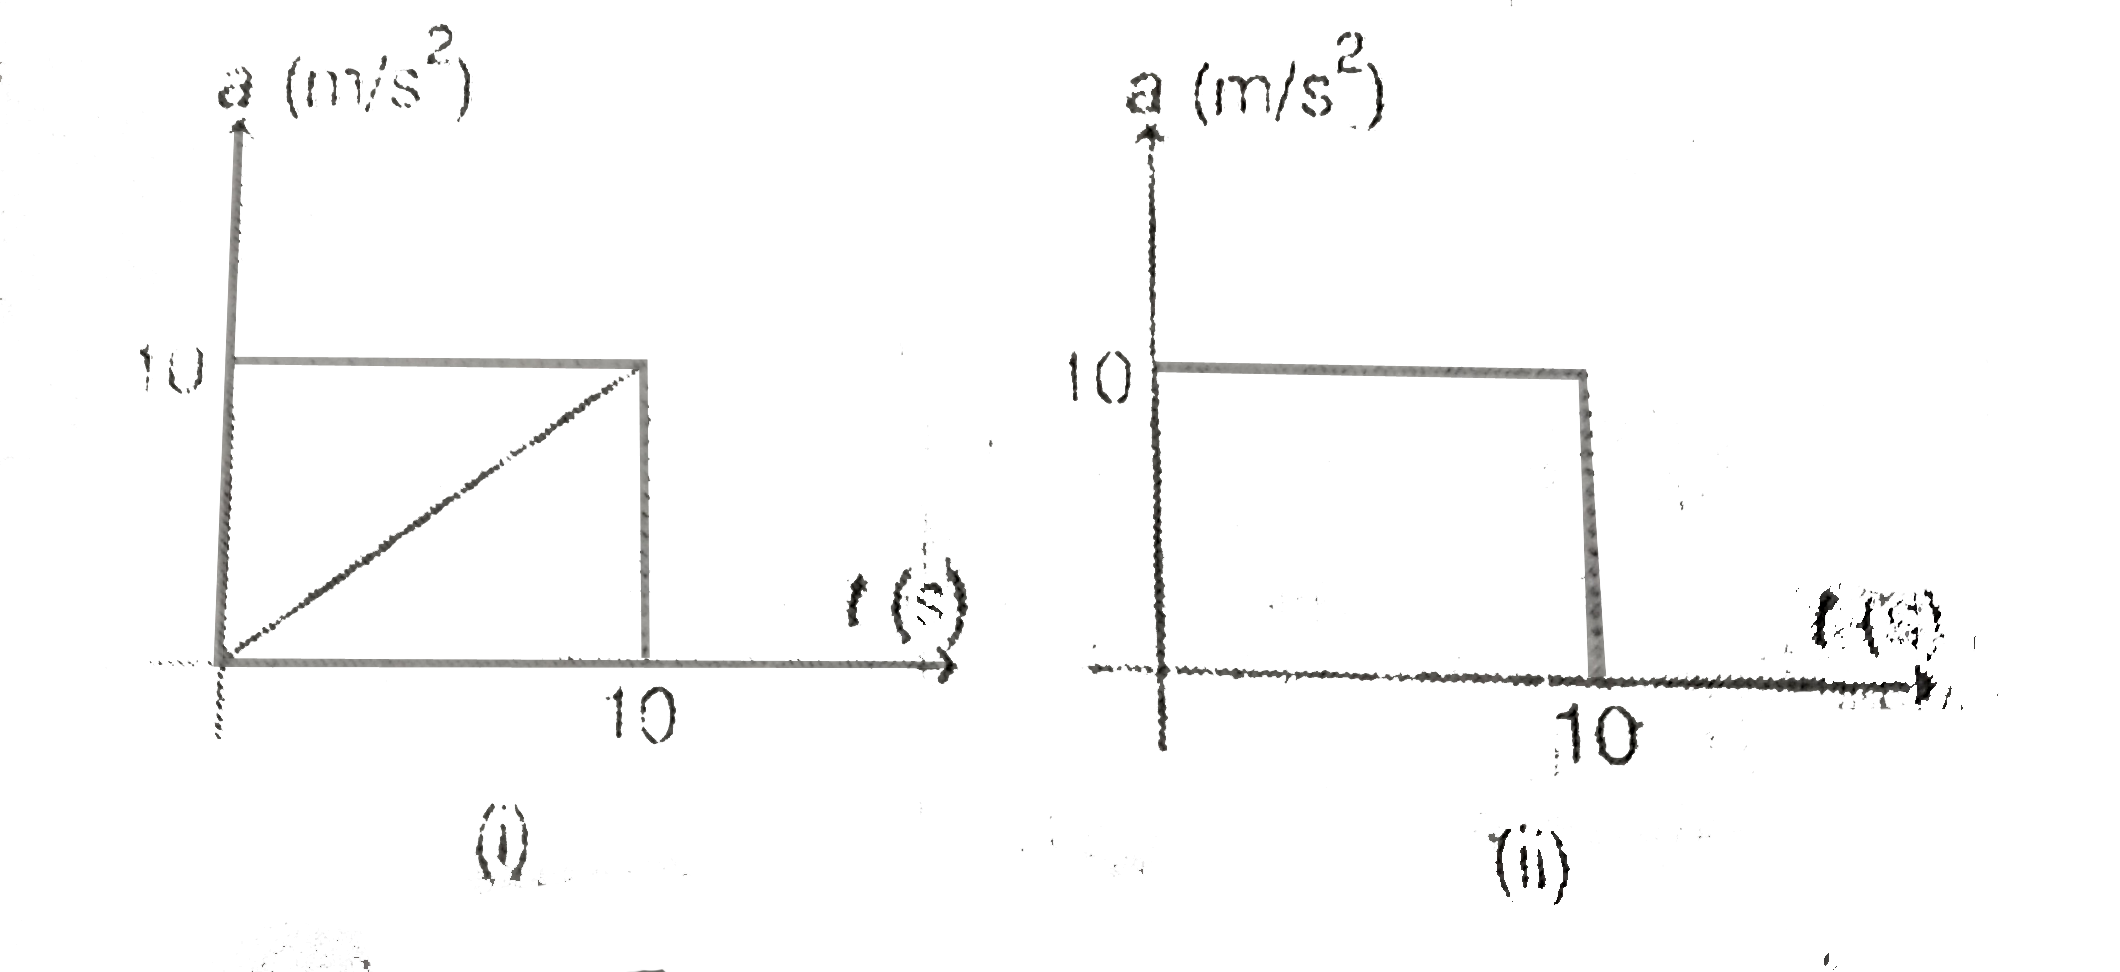
If initial velocity of both the particles was zero. Then velocity of their centre of mass after 10 s will be
View SolutionVelocity-time graph of a particle moving in a straight line is shown in figure. Plot the corresponding displacement-time graph of the particle if at time t=0, displacement s=0.
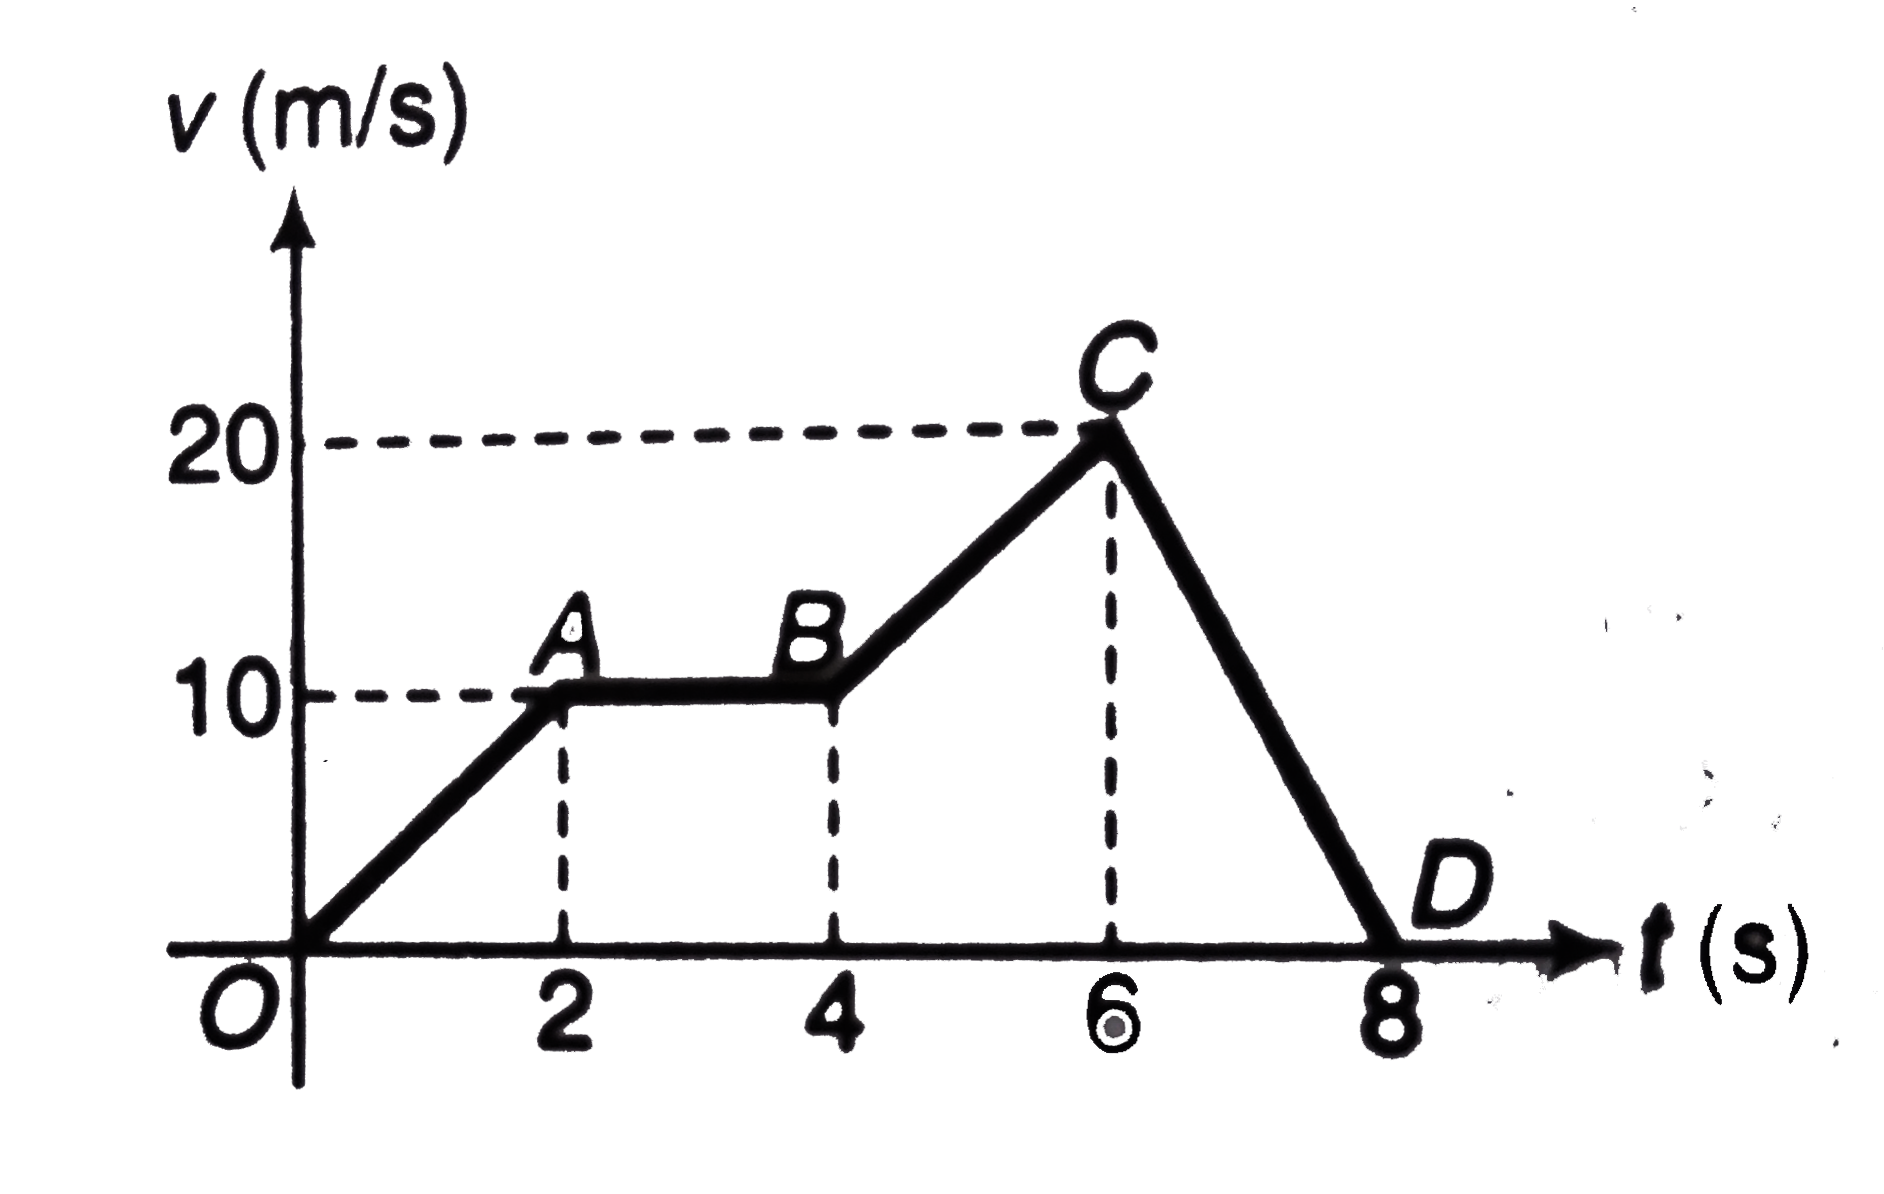
View SolutionVelocity-time graph of a particle moving in a straight line is shown in figure. Plot the corresponding displacement-time graph of the particle if at time t=0, displacement s=0.

View SolutionThe velocity time plot for a particle moving on straight line is shown in the figure.
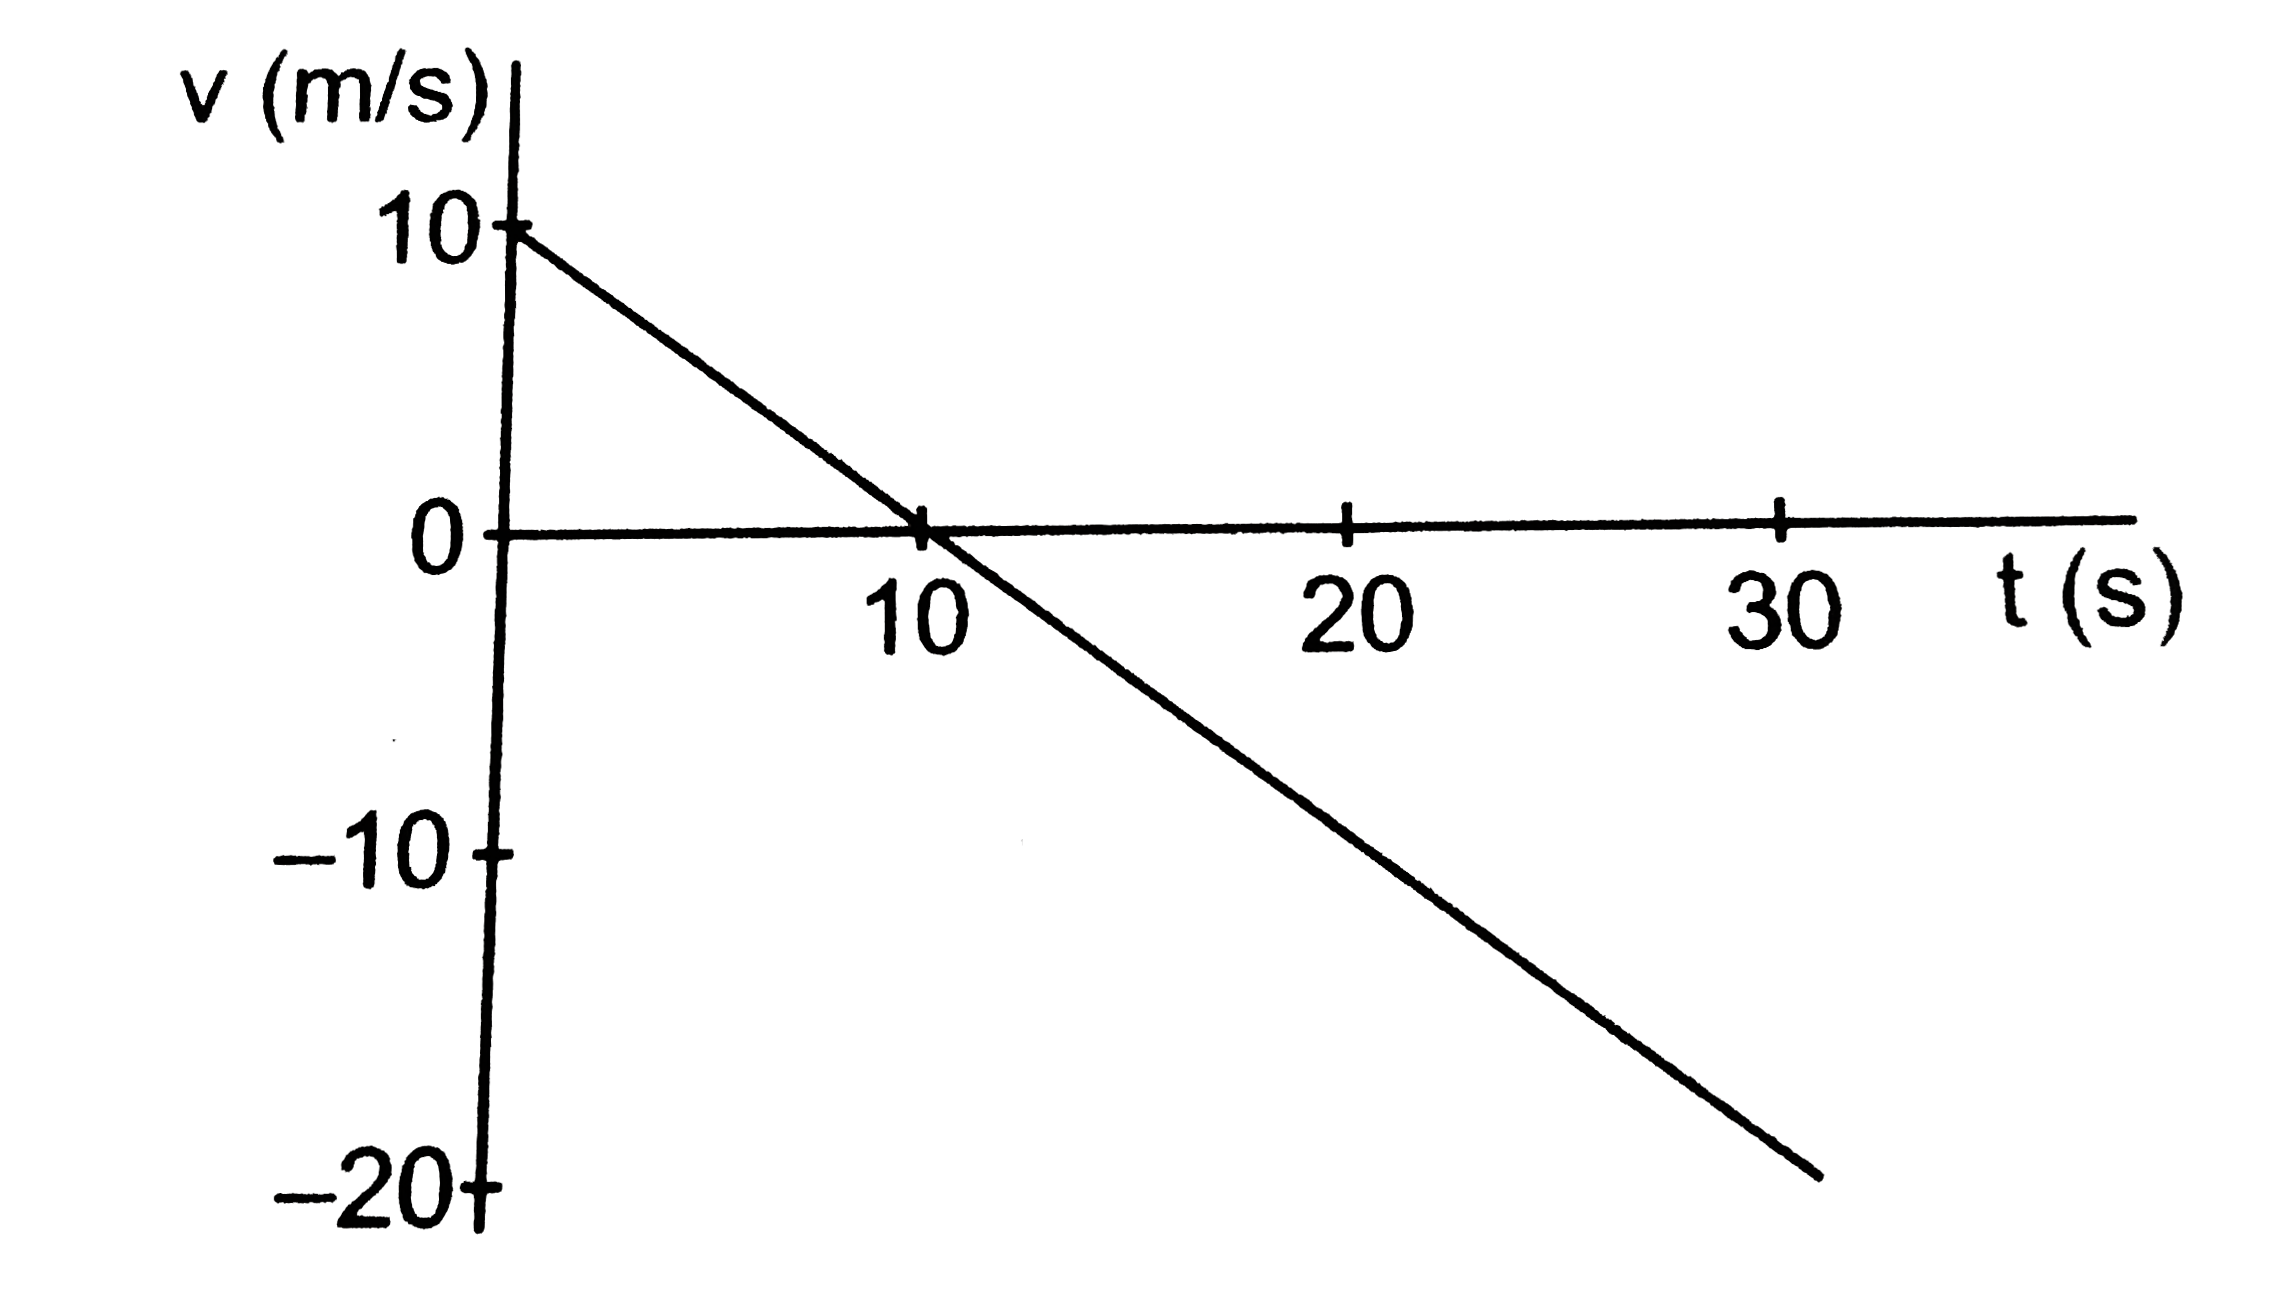
View SolutionThe velocity time plot for a particle moving on straight line is shown in the figure.

View SolutionVelocity versus displacement graph of a particle moving in a straight line as shown in figure.
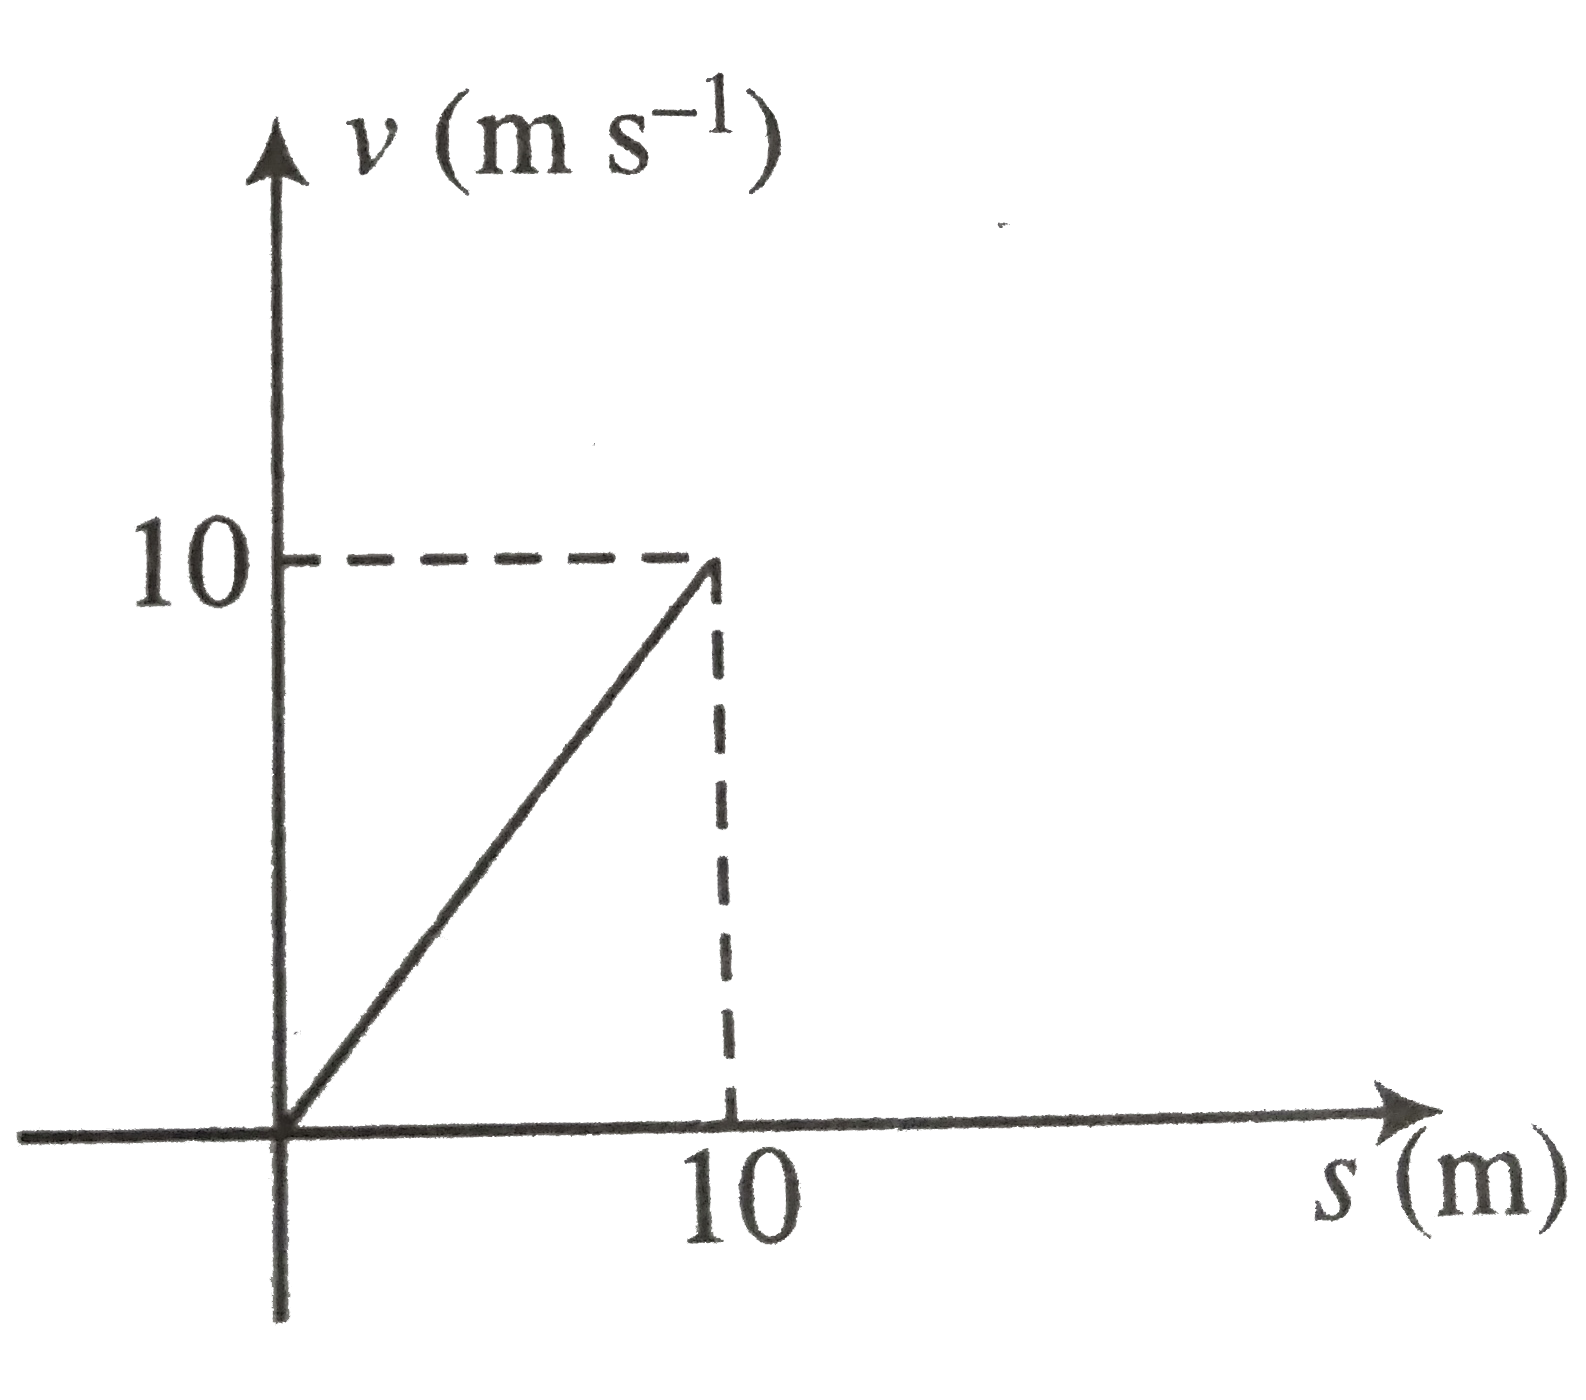
The corresponding acceleration versus velocity graph will be .
View SolutionThe x-t graph of a particle moving along a straight line is shown in figure
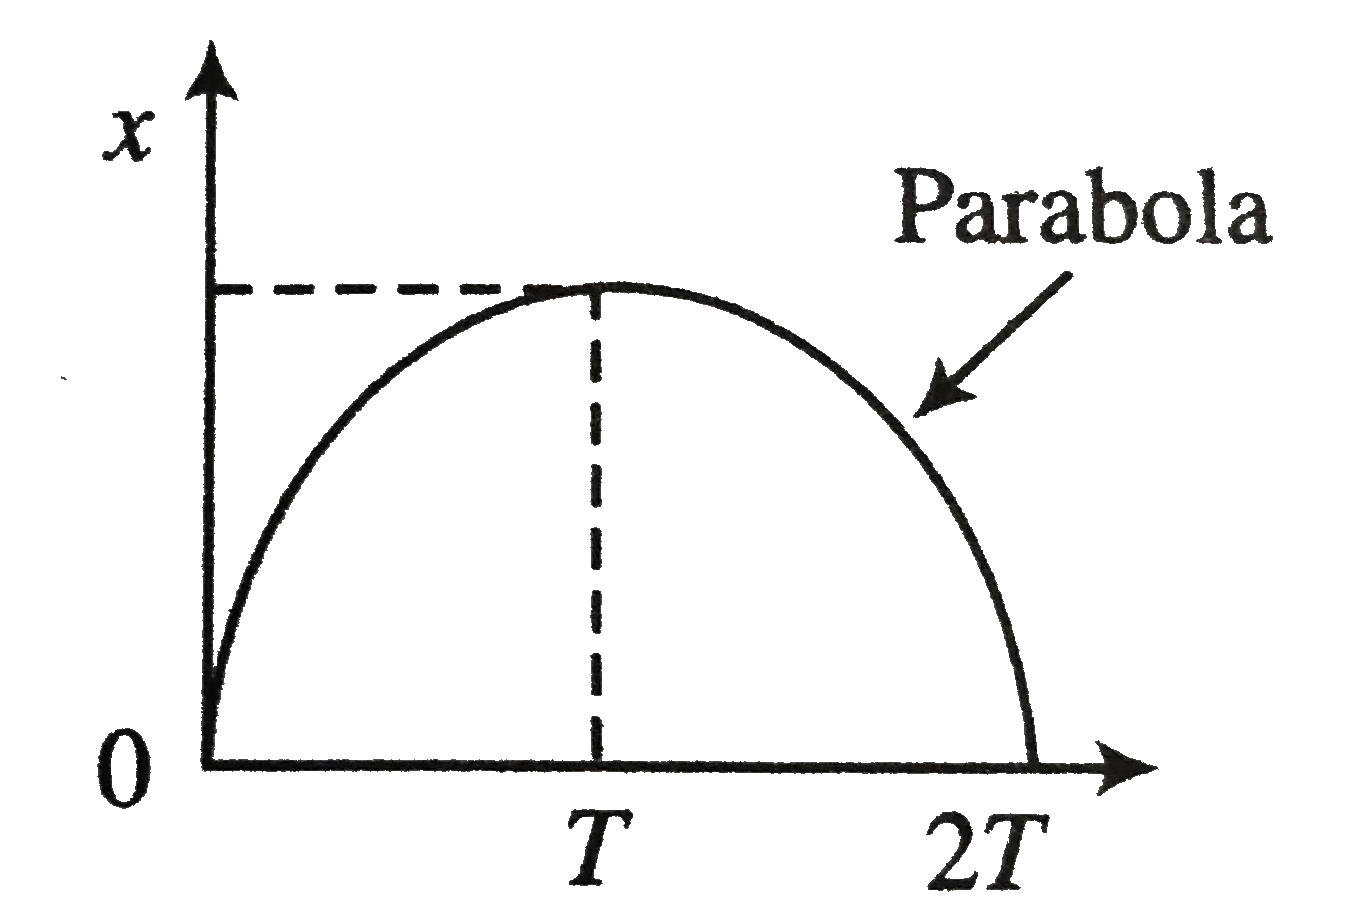
The a-t graph of the particle is correctly shown by
View SolutionThe x-t graph of a particle moving along a straight line is shown in figure
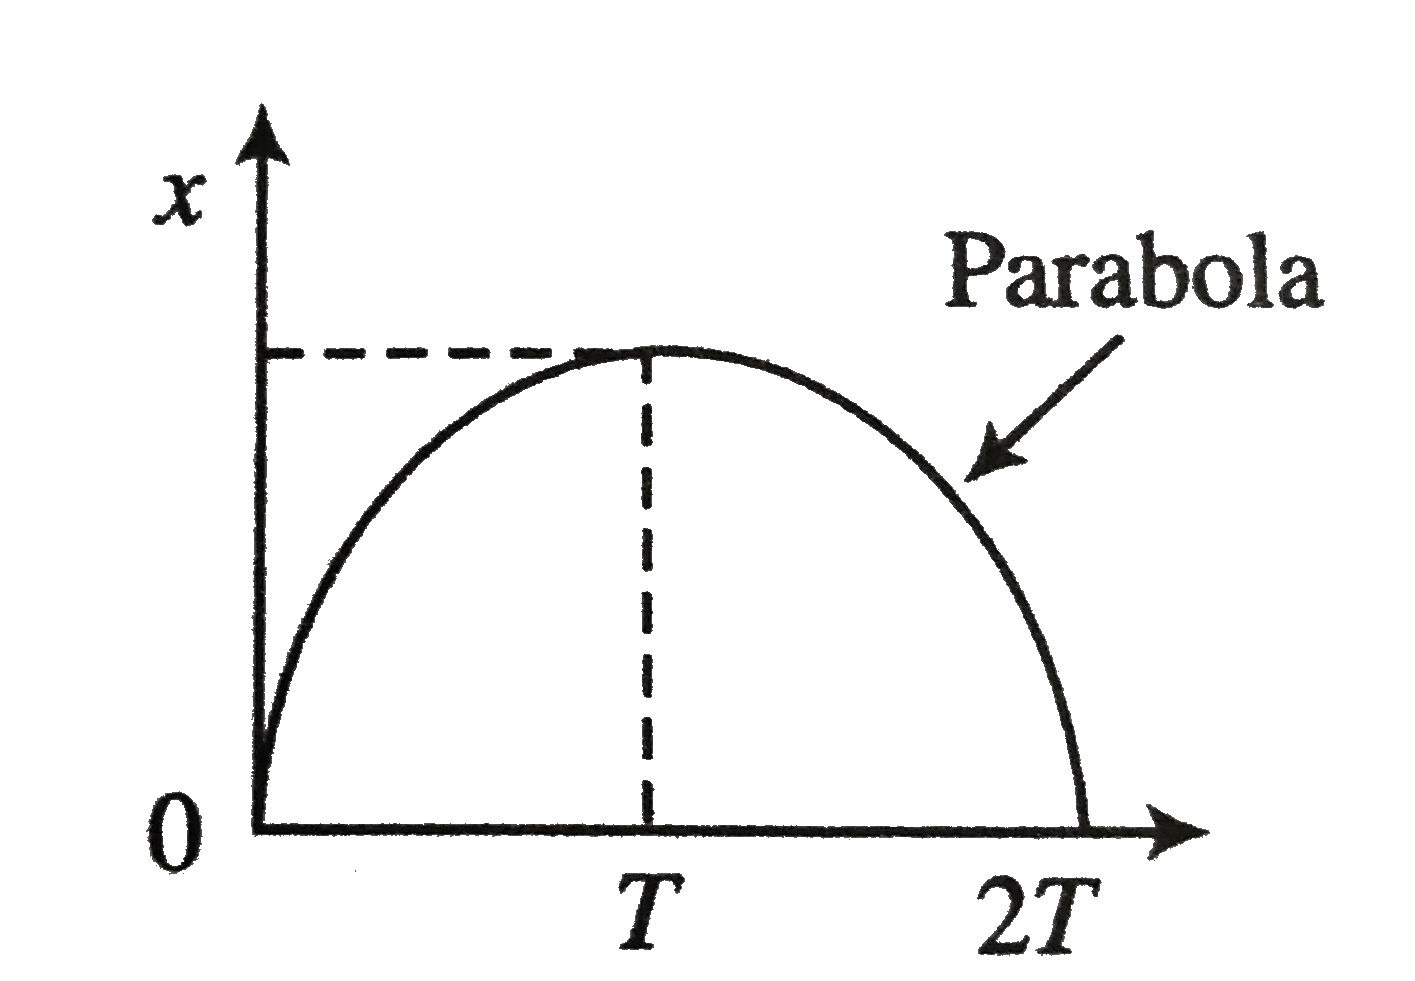
The speed-time graph of the particle is correctly shown by
View Solution