In the figure, D is an ideal diode and an alternating voltage of peak value 10 volts si connected as input V1. Which of the following figures represents the correct waveform of output voltage V0 ?
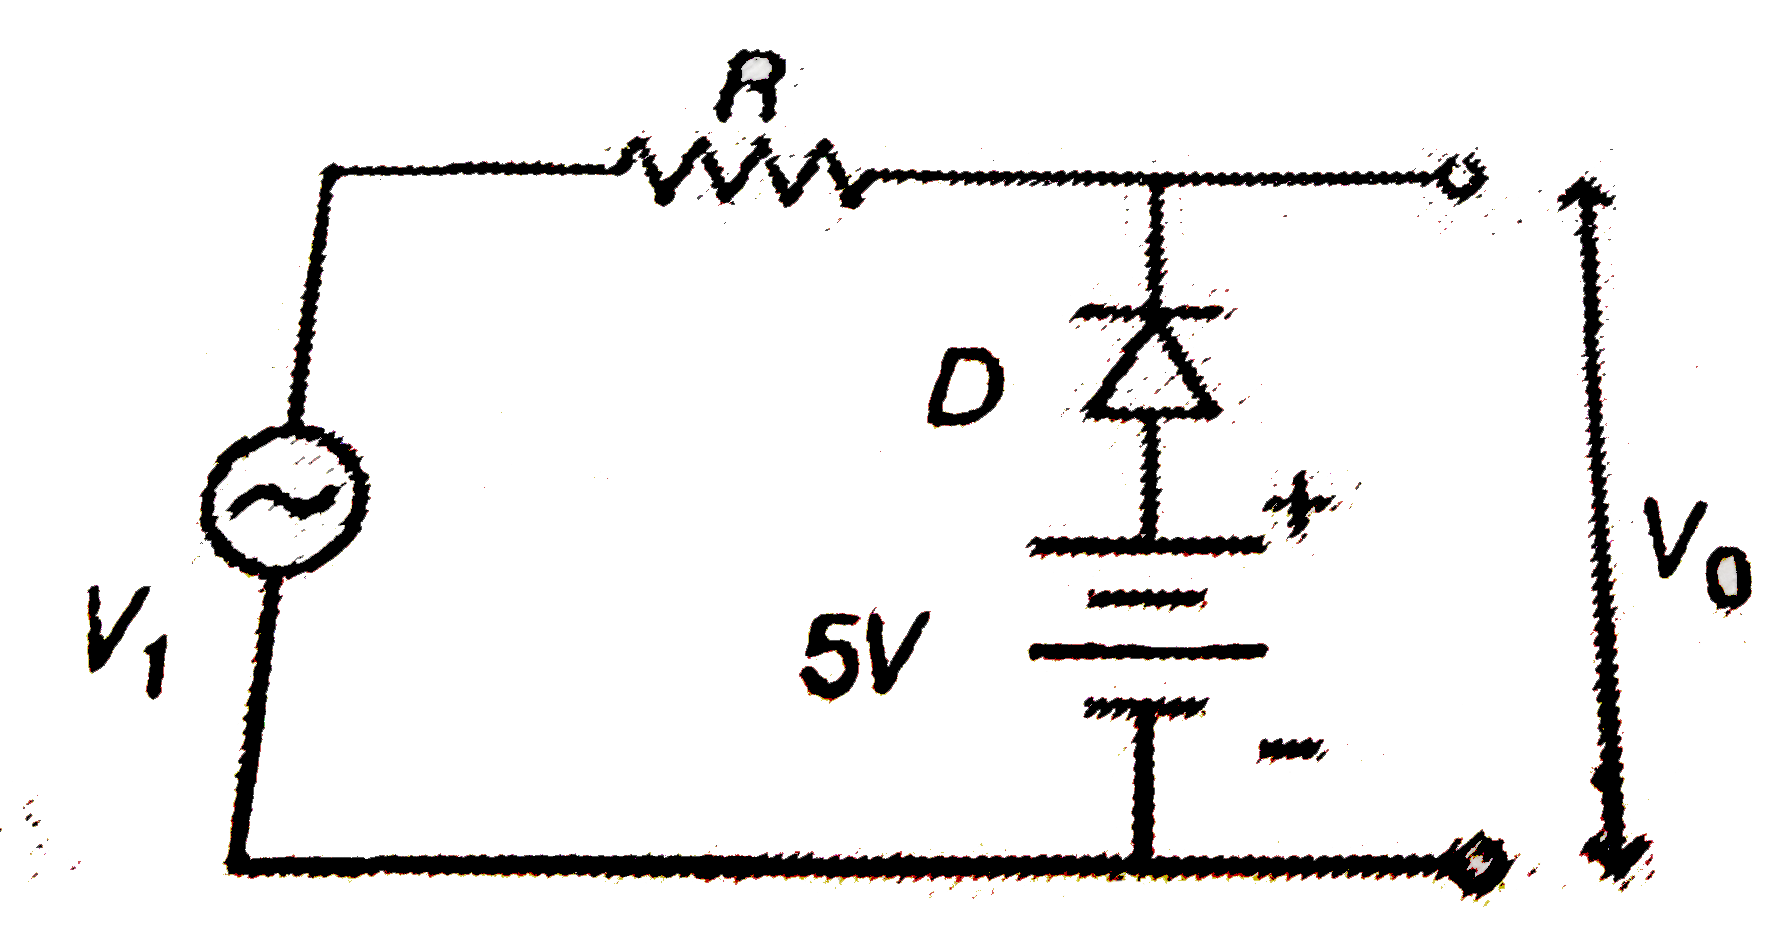
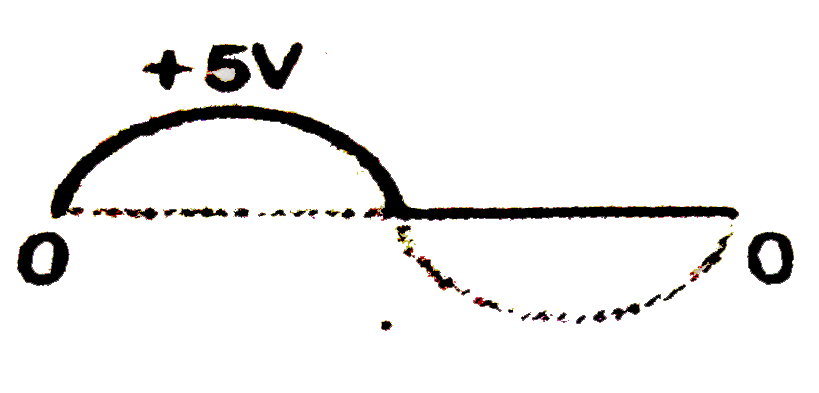
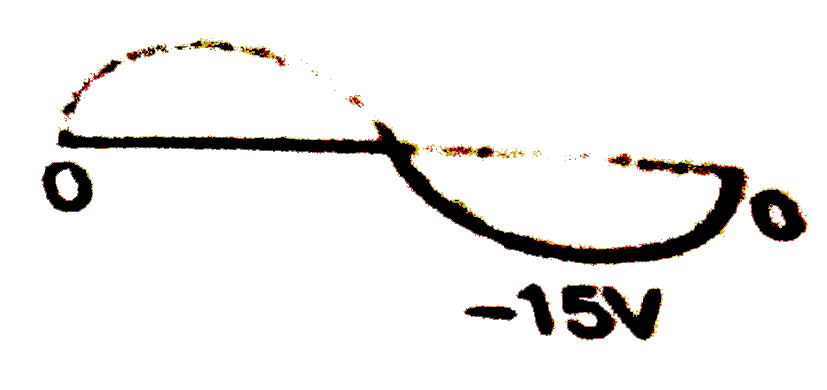
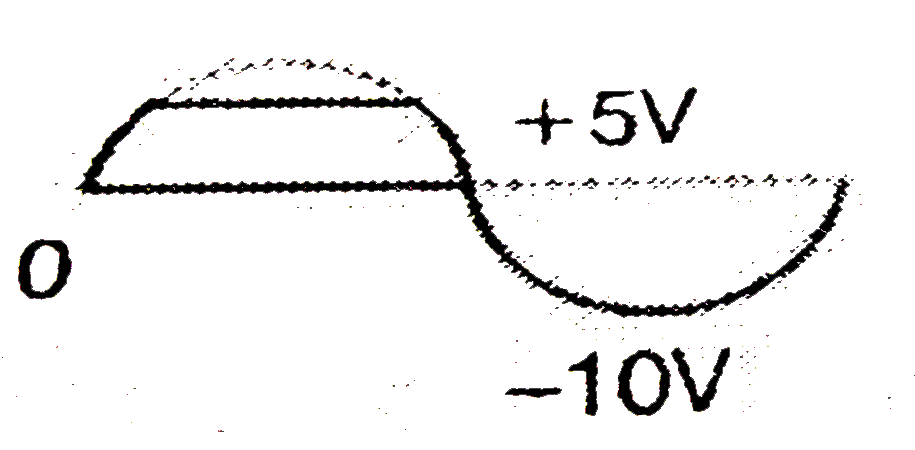
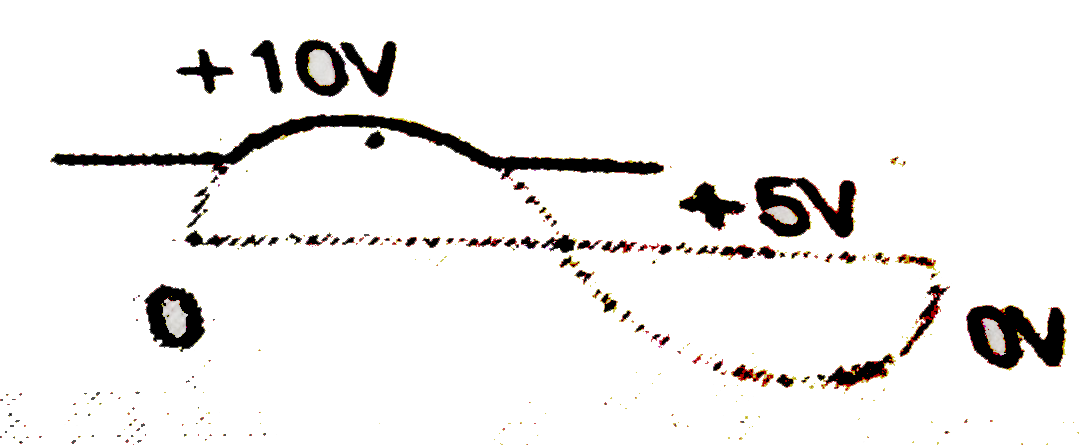
The correct Answer is:D
Step by step video & image solution for In the figure, D is an ideal diode and an alternating voltage of peak value 10 volts si connected as input V_(1). Which of the following figures represents the correct waveform of output voltage V_(0) ? by Physics experts to help you in doubts & scoring excellent marks in Class 11 exams.
Updated on:21/07/2023Topper's Solved these Questions
- SEMICONDUCTORS AND ELECTRONIC DEVICESBOOK - DC PANDEY ENGLISHCHAPTER - SEMICONDUCTORS AND ELECTRONIC DEVICESEXERCISE - More than One Option is Correct
3 Videos
- ROTATIONAL MOTIONBOOK - DC PANDEY ENGLISHCHAPTER - ROTATIONAL MOTIONEXERCISE - Integer Type Questions
17 Videos
- SIMPLE HARMONIC MOTIONBOOK - DC PANDEY ENGLISHCHAPTER - SIMPLE HARMONIC MOTIONEXERCISE - Integer type questions
14 Videos
Similar Questions
Knowledge Check
what is the output signal voltage (peak value) if dc supply voltage is 5 V?
A4 VB5 VC6 VD7 VAlternating voltage (V) is represented by the equation
whrere Vm is the peak voltageAVt=VmeωtBVt=VmsinωtCV(t)=VmcotωtDV(t)=Vmtantωt
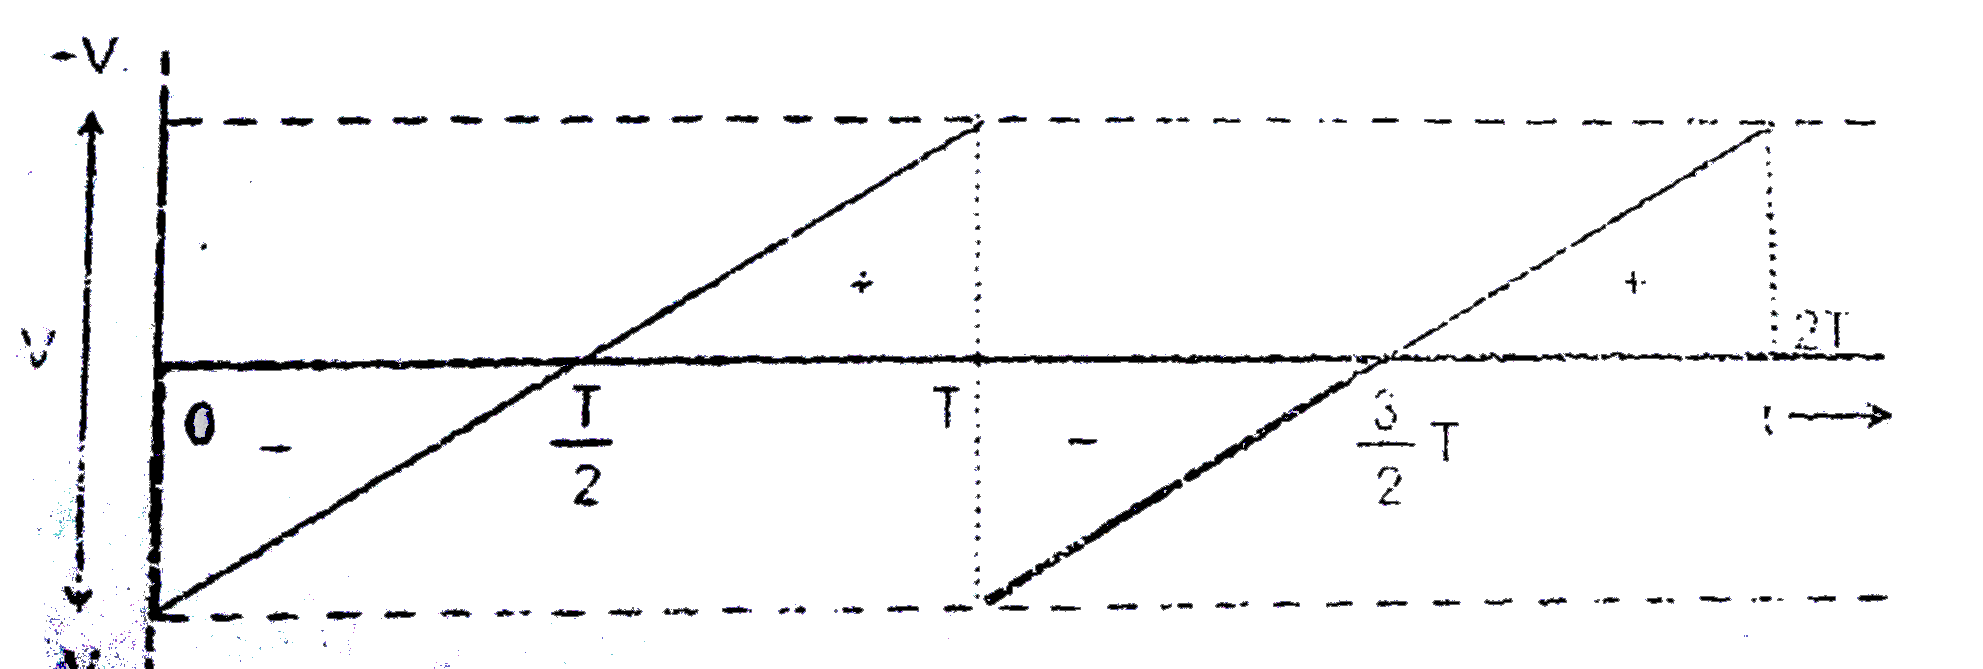
Find the aveage for the saw-tooth voltage of peak value V0 from t=0 to t=2T as shown in figure.
View SolutionIf an alternating voltage is represented as v = 300 sin 600 t then the arms value of the voltage and the frequency are respectively :
View SolutionFor an alternating voltave V=10cos100πt volt, the instantenous voltage at t=1600s is
View SolutionA coil of inductance 5.0mH and negligible resistance is connected to an oscillator giving an output voltage E=(10V)sinωt.Which of the following is correct
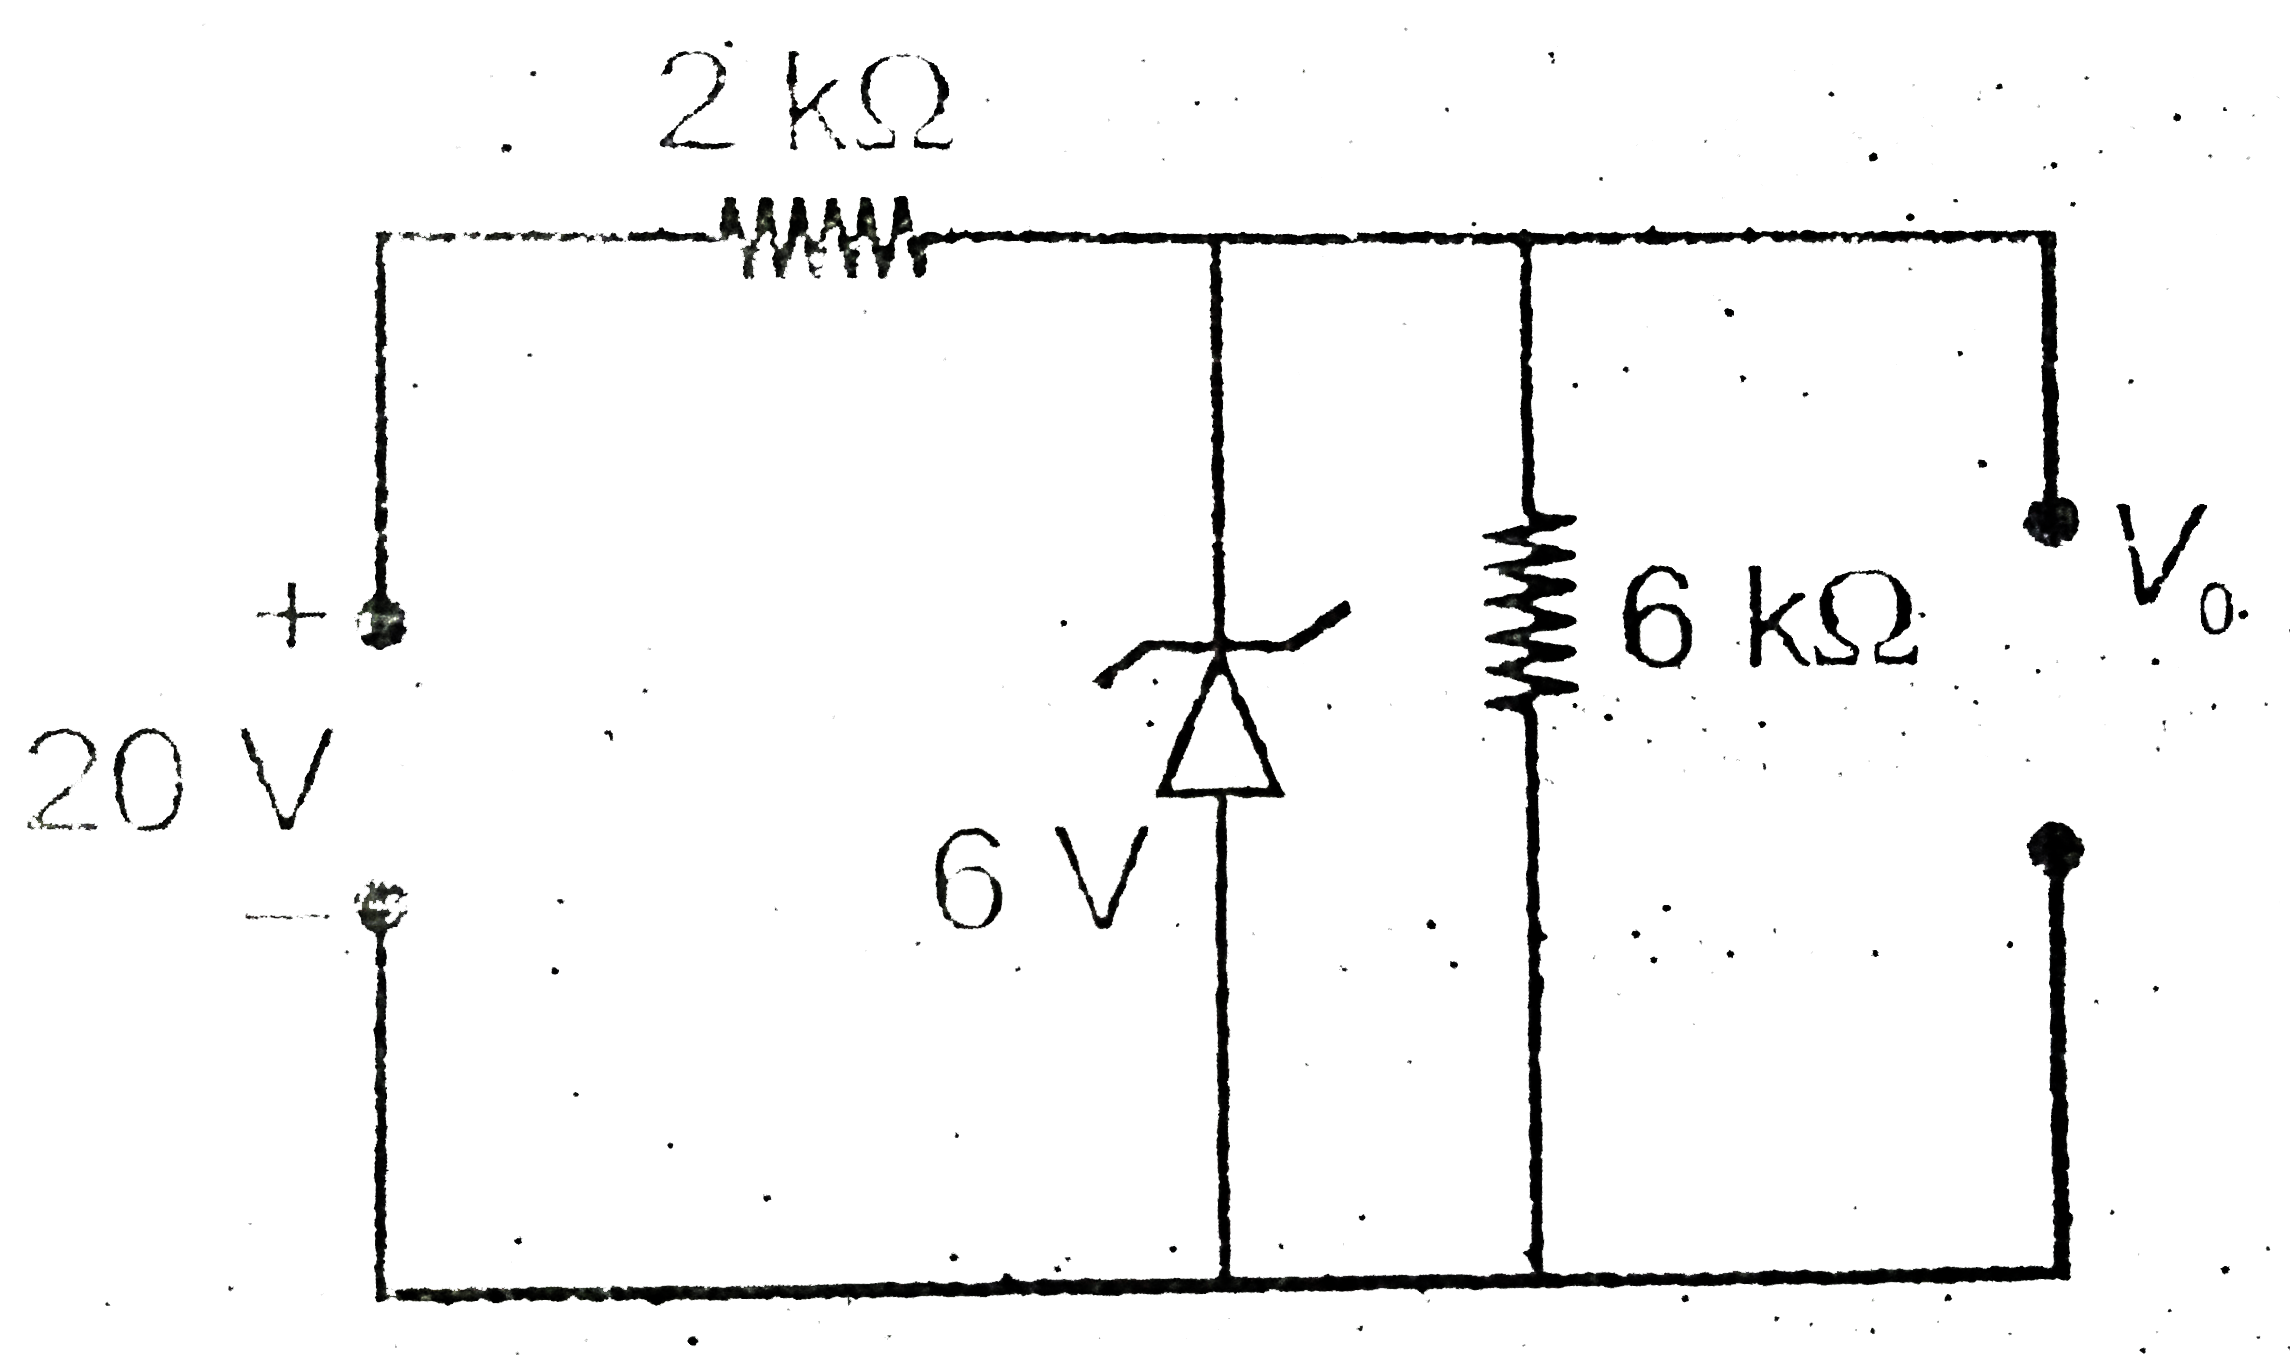
View SolutionWhat is the value of output voltage V0 in the circuit shown in the figure ?
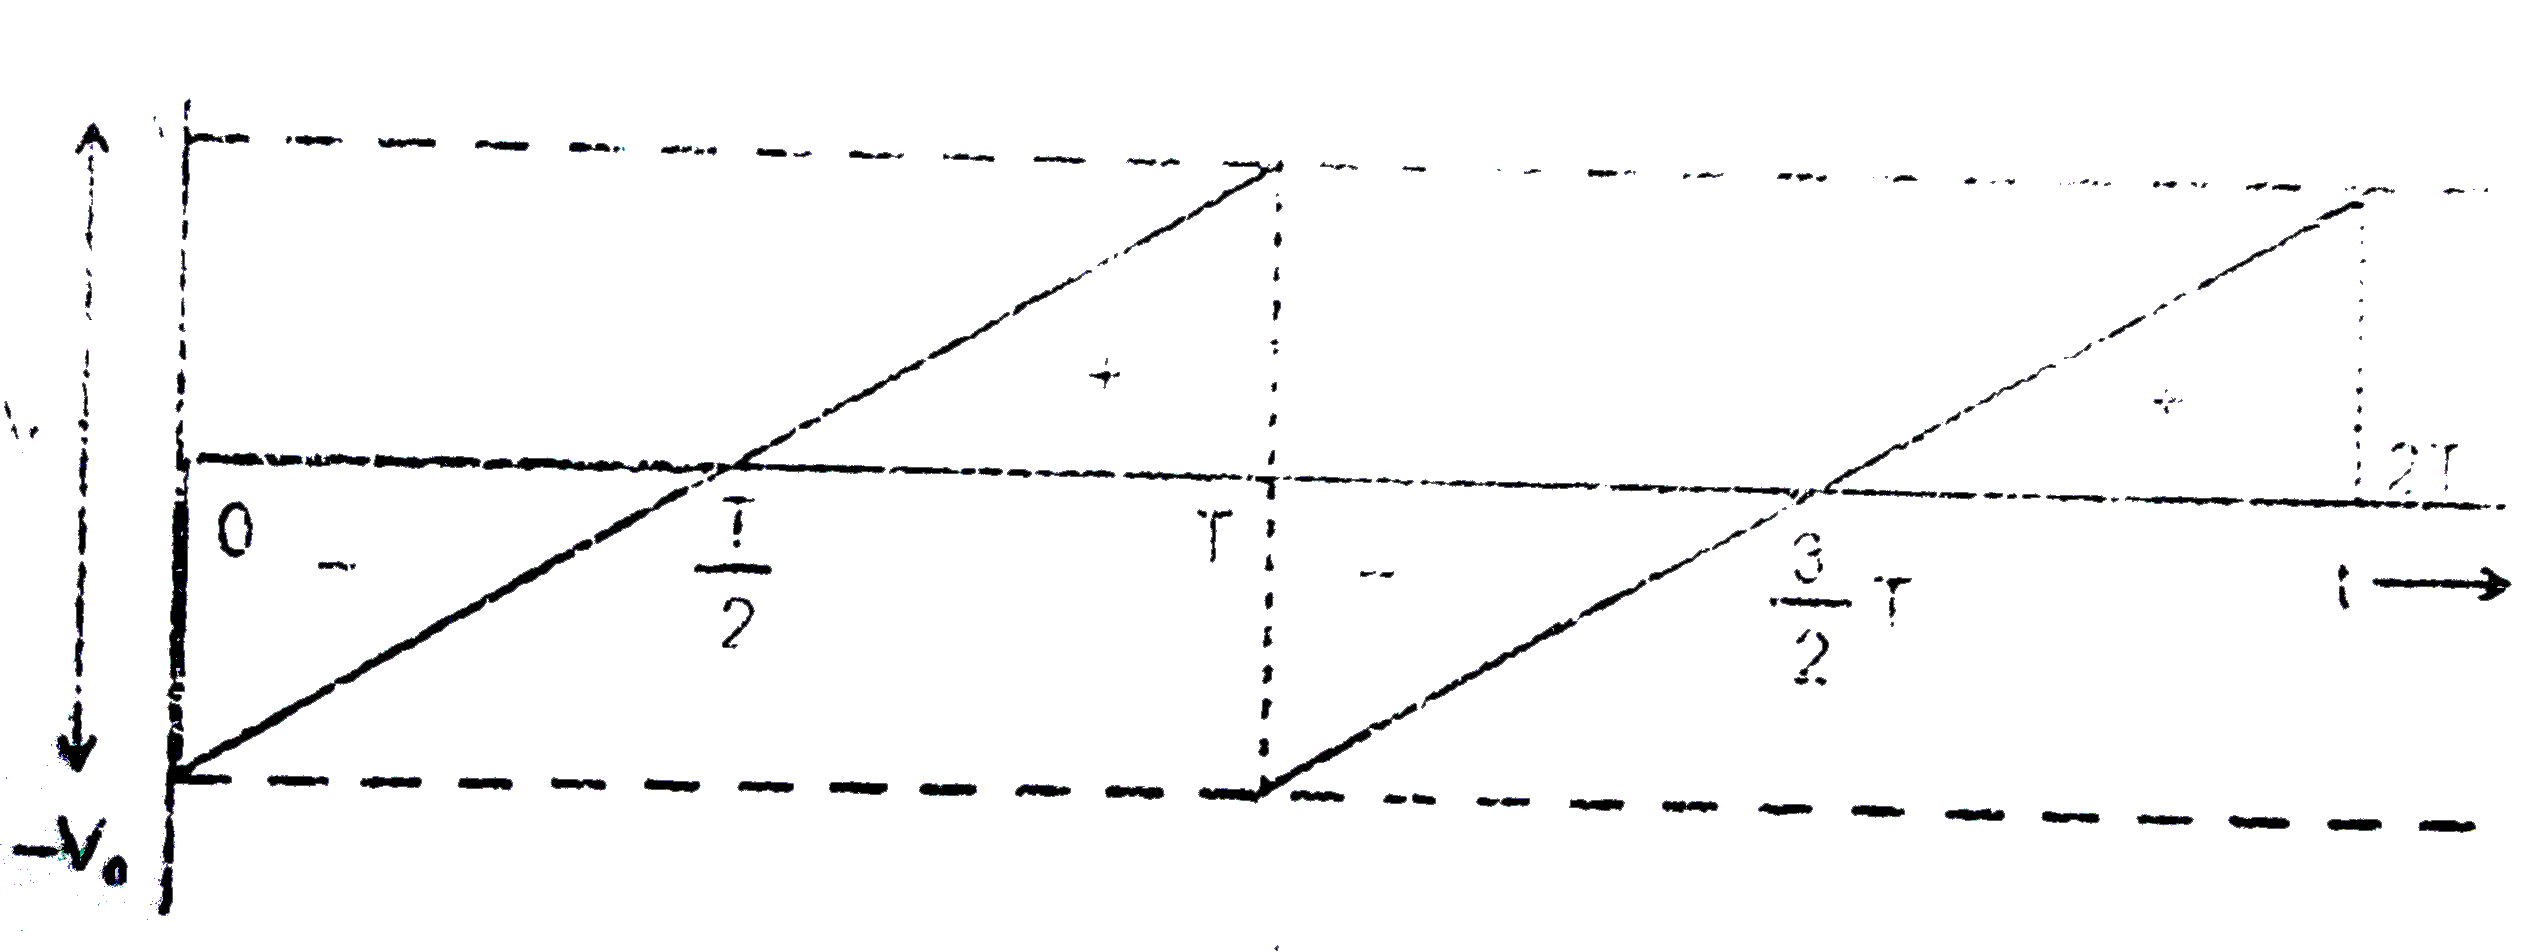
View SolutionThe rms value of the saw-tooth voltage of peak value V0 from t=0 to t=2T as shown in figure is V0√x.Find the value of x.
View Solution
