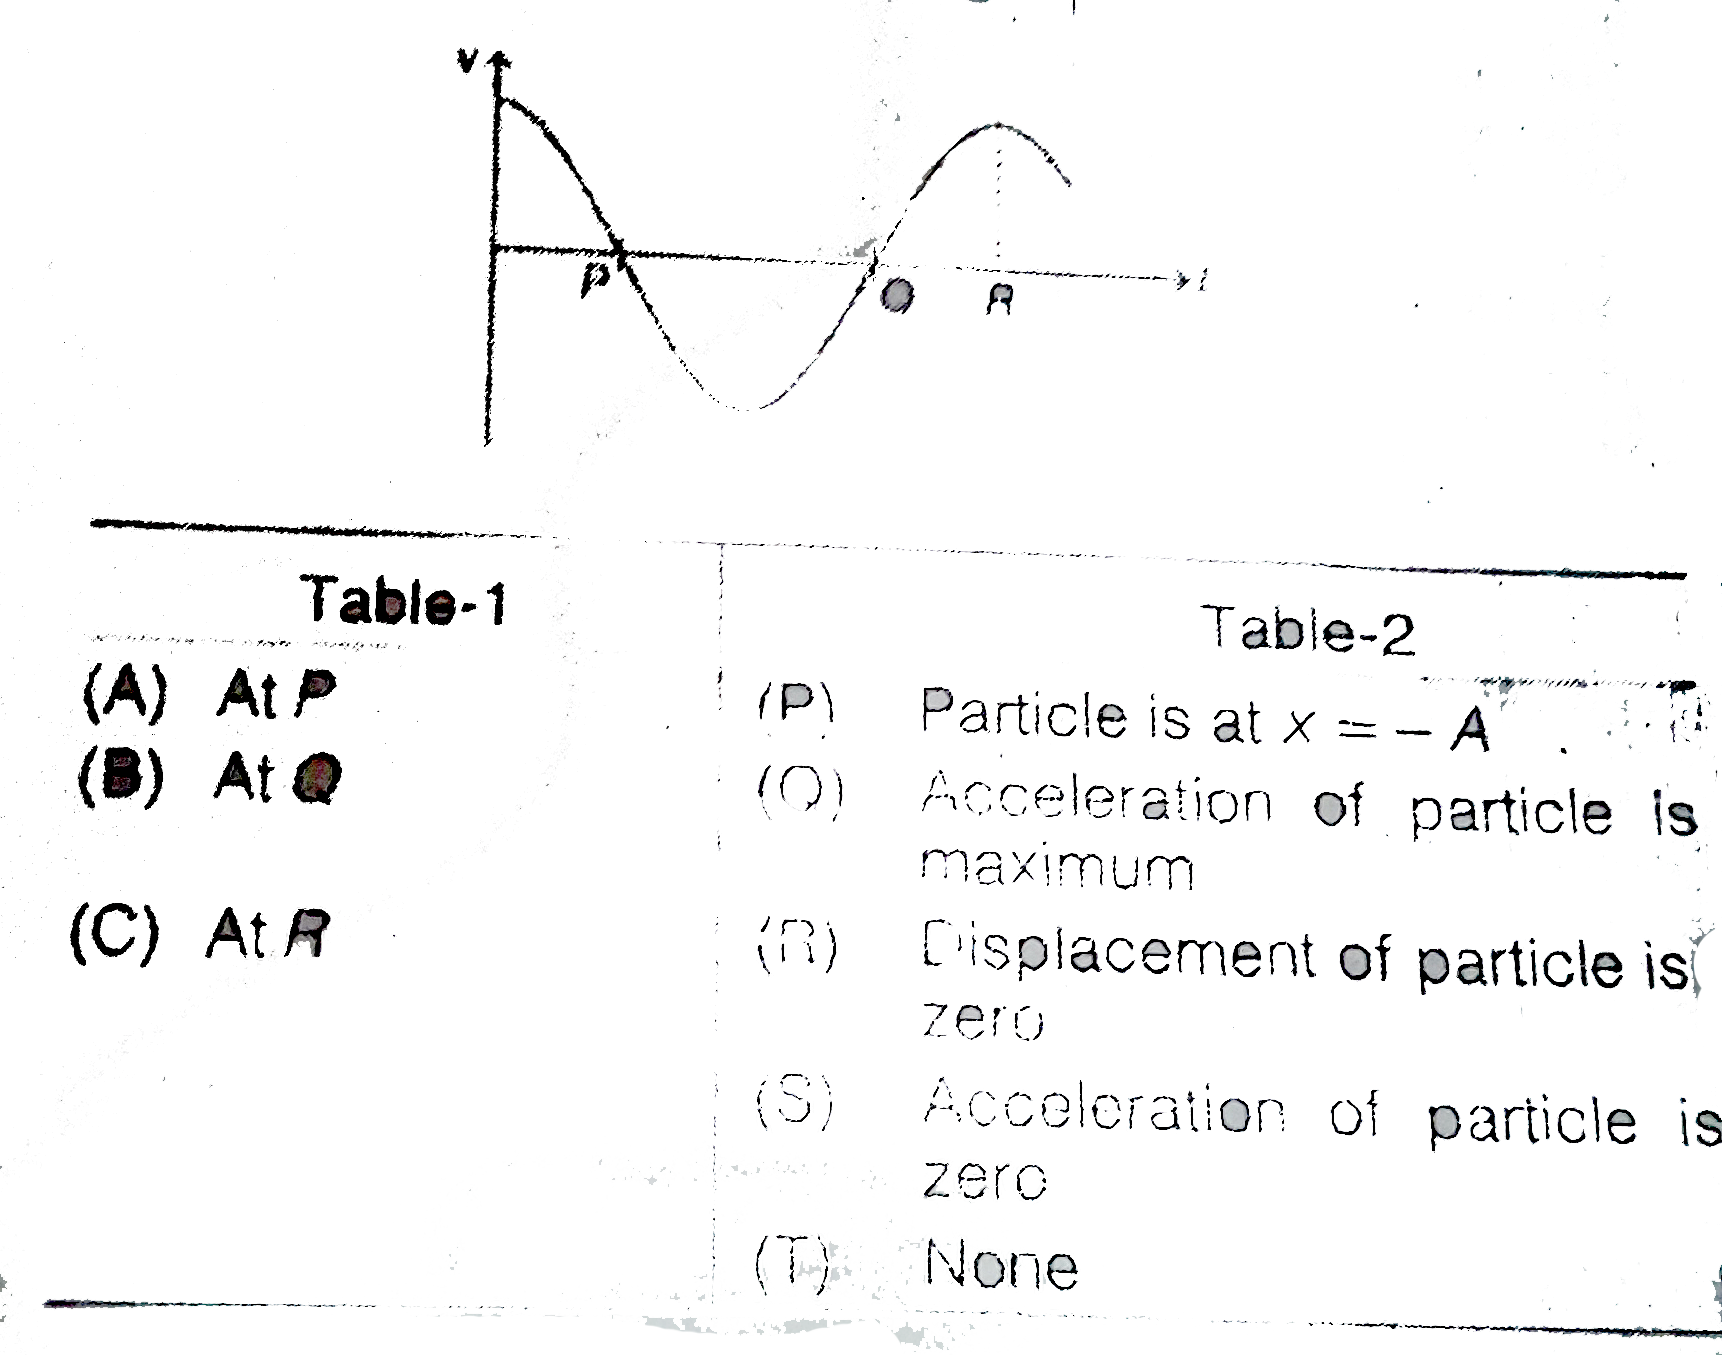
The velocity − time graph of a particle is as shown in figure

It moves with a constant acceleration throughout
It moves with an acceleration of constant magnitude but changing direction at the end of every two second
The displacement of the particle is zero
The velocity becomes zero at t=4 second
The correct Answer is:B
Obviously slope of v−t graph is changed at t=2,4,6,………in direction but it has constant magnitude.
Topper's Solved these Questions
- BOOK - RESONANCE ENGLISHCHAPTER - DAILY PRACTICE PROBLEMSEXERCISE - Dpp no. 13 physics5videos
DAILY PRACTICE PROBLEMS
- BOOK - RESONANCE ENGLISHCHAPTER - DAILY PRACTICE PROBLEMSEXERCISE - DPP NO. 14 PHYSICS10videos
DAILY PRACTICE PROBLEMS
- BOOK - RESONANCE ENGLISHCHAPTER - DAILY PRACTICE PROBLEMSEXERCISE - Compreshension6videos
DAILY PRACTICE PROBLEMS
- BOOK - RESONANCE ENGLISHCHAPTER - CURRENT ELECTRICITYEXERCISE - Exercise53videos
CURRENT ELECTRICITY
- BOOK - RESONANCE ENGLISHCHAPTER - ELASTICITY AND VISCOCITYEXERCISE - Advanced Level Problems9videos
ELASTICITY AND VISCOCITY
Similar Questions
Knowledge Check
- Question 1 - Select One
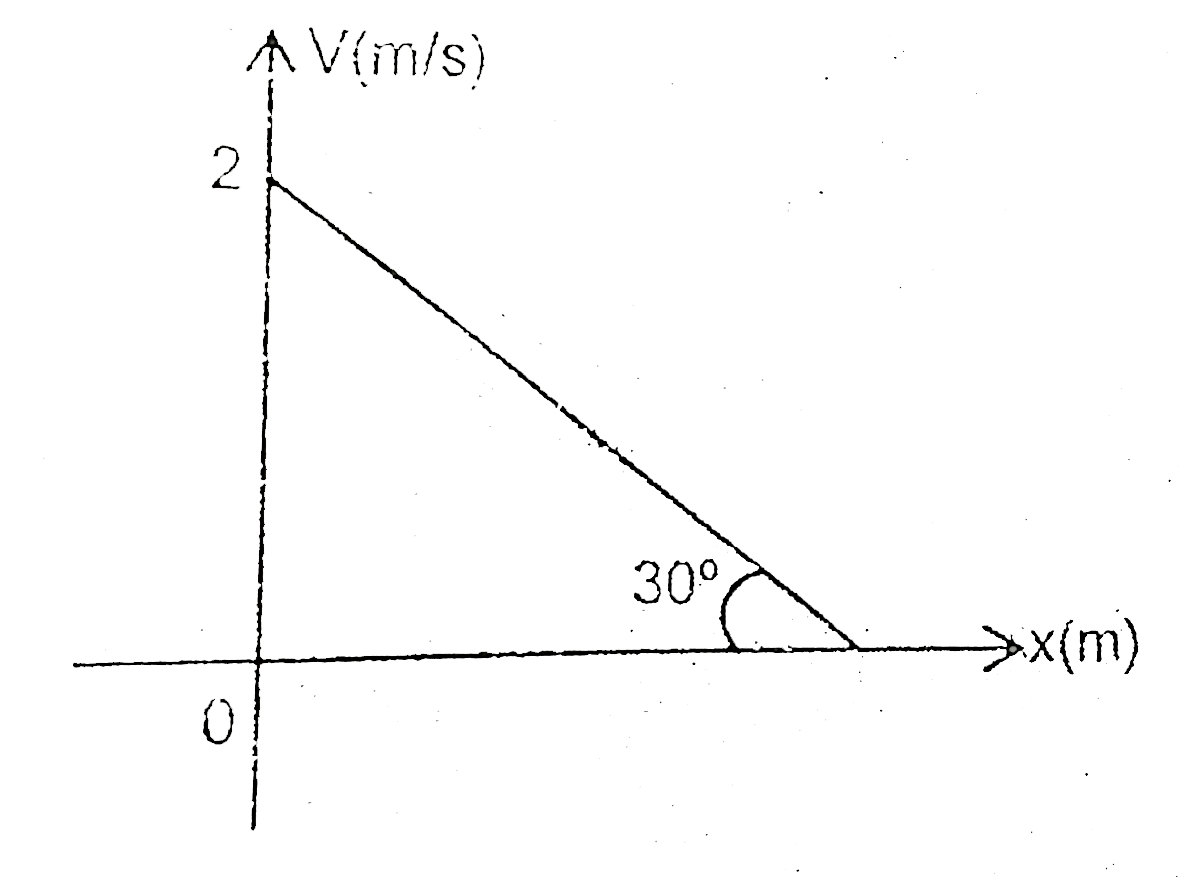
The velocity -displacement graph of a particle is as shown in the figure. Which of the following graphs correctly represents the variation of acceleration with displacement?
 A
A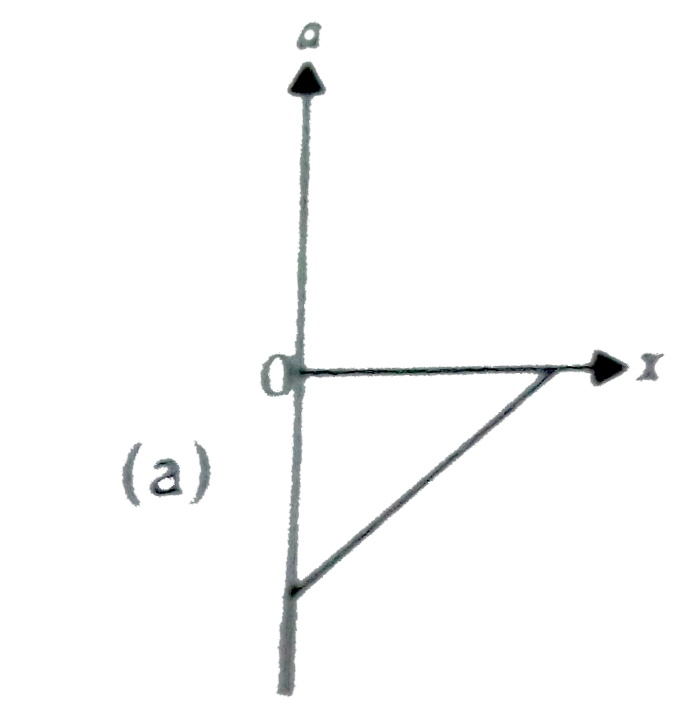 B
B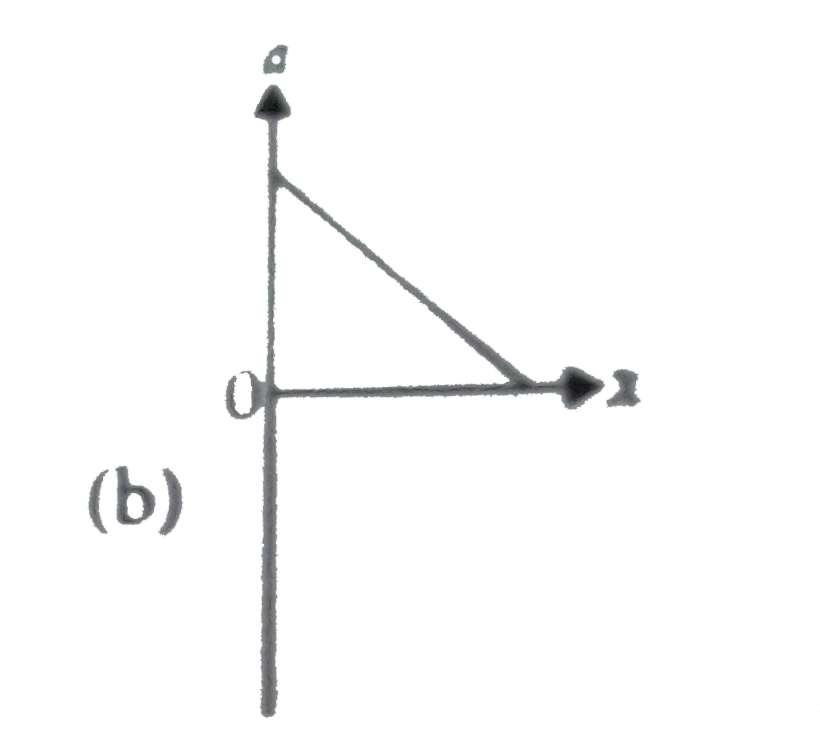 C
C D
D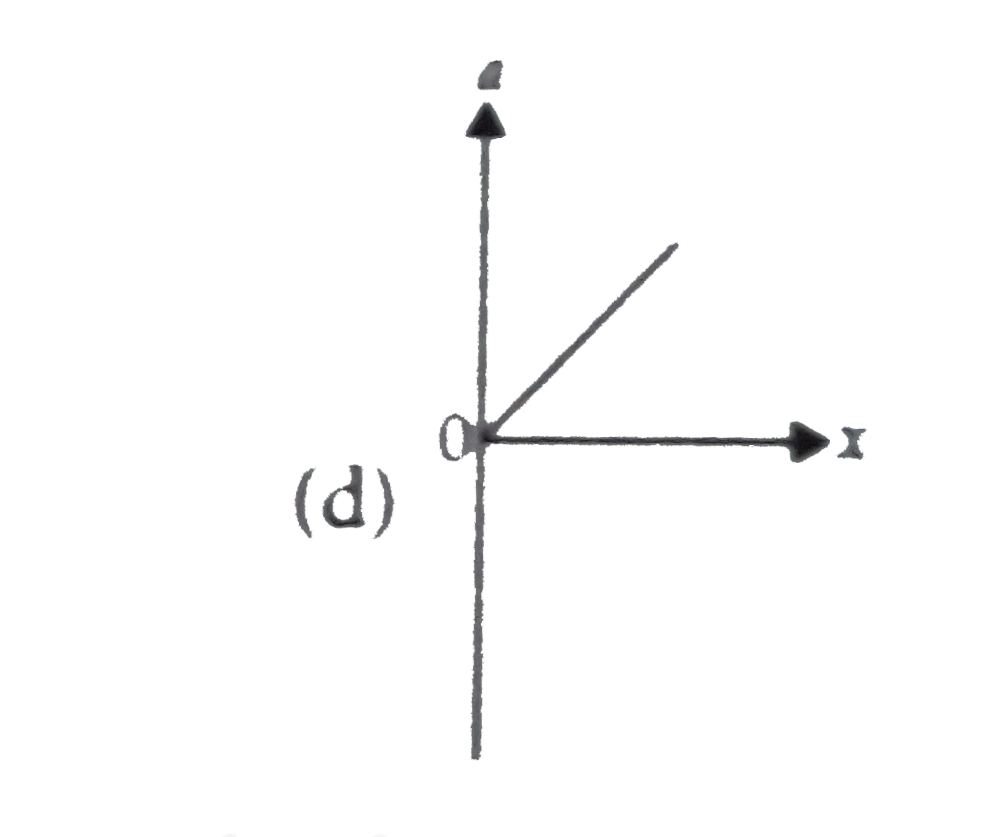
velocity time graph of a particle is shown in figure. Find displacement of the particle.
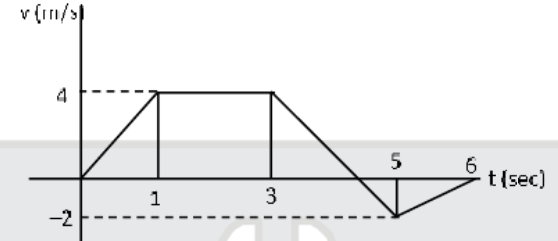 View Solution
A particle of mass 1 kg is moved under the action of a force and velocity time graph of the particle is shown in figure.Work done by the force from t=0 to t=6 s Is
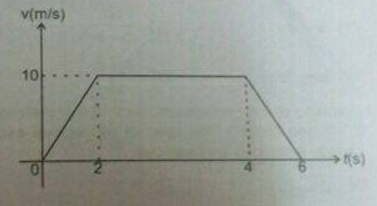 View Solution
Two particles A and B start from the origin along x-axis. Velocity time graph of both particles are shown in the figure. During the given time interval, the maximum separation between the particles is
 View Solution
Velocity-time graph of a particle executing SHM is shown in figure. Select the correct alternative(s).
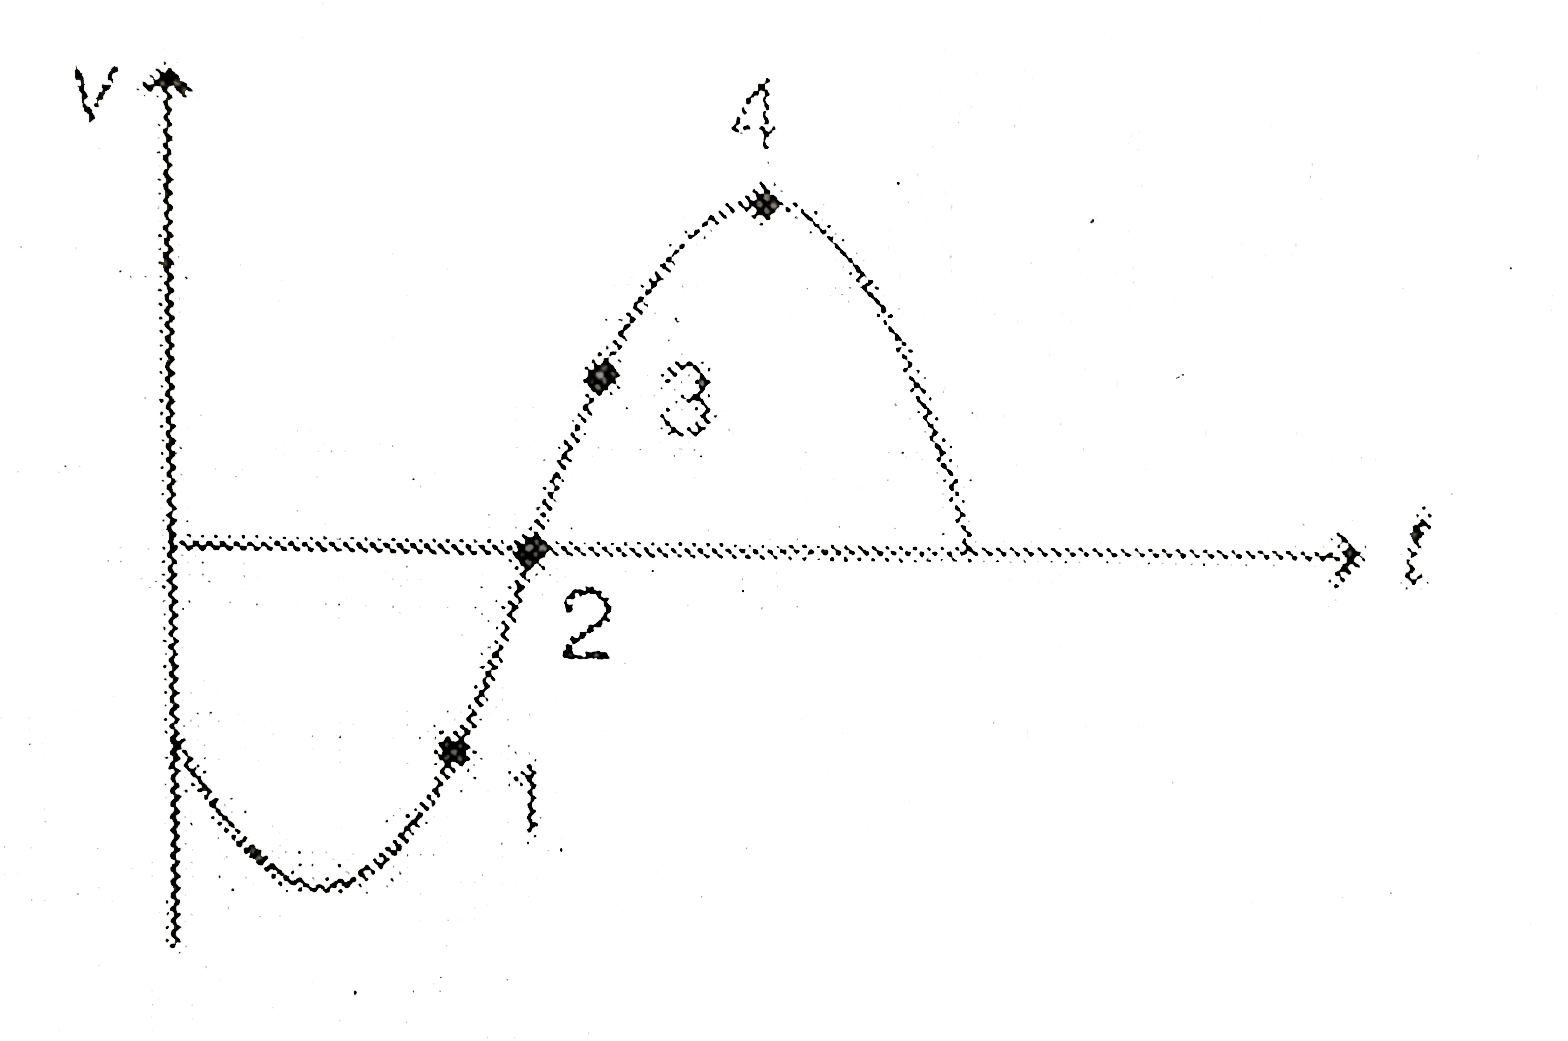 View Solution
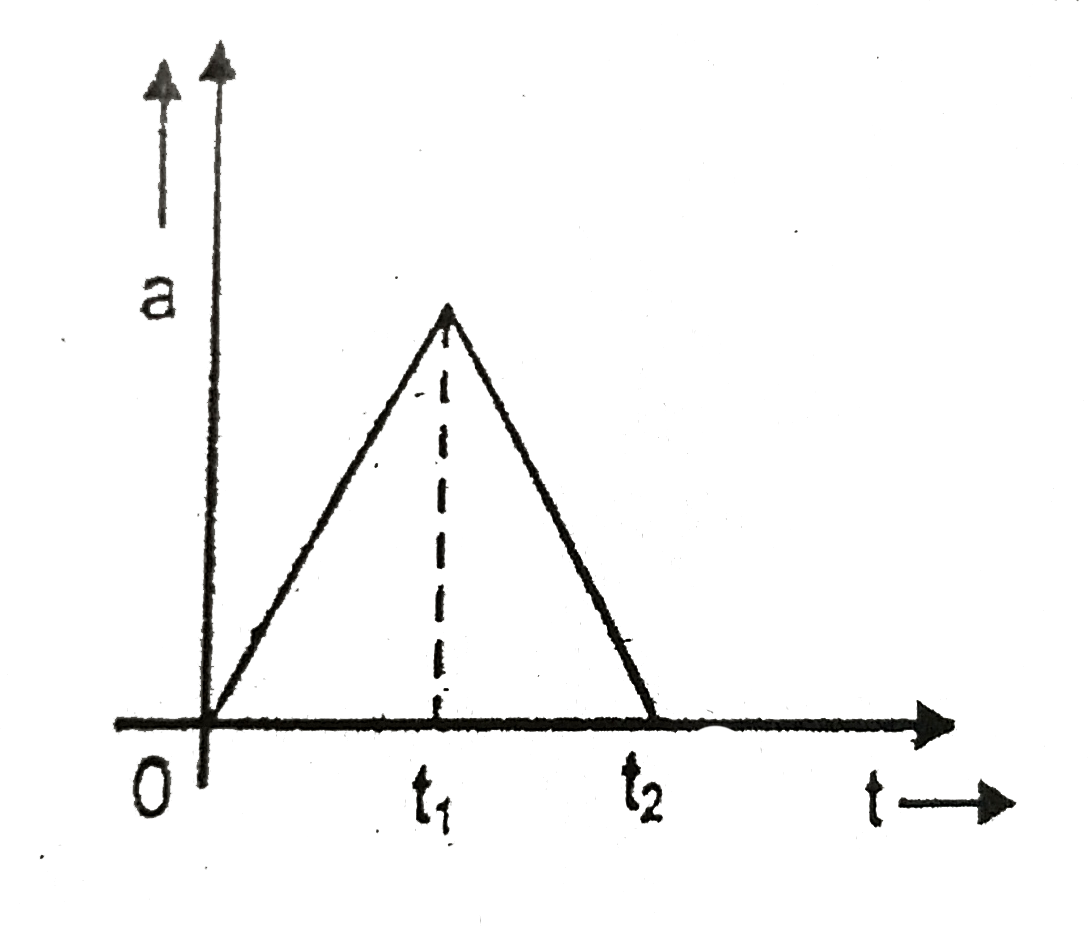
A particle starts to move along a straight line. The acceleration versus time graph of particle is as shown in figure. The correct velocity versus time graph is :
 View Solution
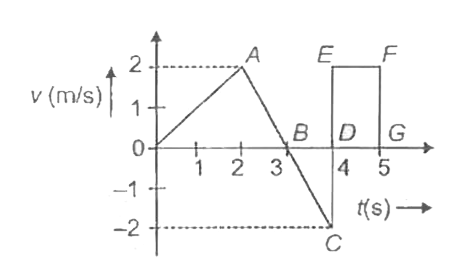
The velocity - time graph of a particle moving along a straight line is shown in the figure given below
The displacement of the particle in 5 second is
 View Solution
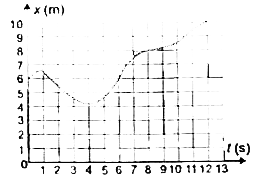
Position - time graph for a particle is shown in figure. Starting from t = 0, at what time t, the average velocity is zer?
 View Solution

