Two particles A and B start from the origin along x-axis. Velocity time graph of both particles are shown in the figure. During the given time interval, the maximum separation between the particles is

4m
1m
2m
3m
The correct Answer is:C
Step by step video & image solution for Two particles A and B start from the origin along x-axis. Velocity time graph of both particles are shown in the figure. During the given time interval, the maximum separation between the particles is by Physics experts to help you in doubts & scoring excellent marks in Class 11 exams.
Updated on:21/07/2023Topper's Solved these Questions
- KINEMATICS 1BOOK - DC PANDEY ENGLISHCHAPTER - KINEMATICS 1EXERCISE - MCQ_TYPE
27 Videos
- KINEMATICS 1BOOK - DC PANDEY ENGLISHCHAPTER - KINEMATICS 1EXERCISE - COMPREHENSION_TYPE
19 Videos
- KINEMATICSBOOK - DC PANDEY ENGLISHCHAPTER - KINEMATICSEXERCISE - INTEGER_TYPE
10 Videos
- LAWS OF MOTIONBOOK - DC PANDEY ENGLISHCHAPTER - LAWS OF MOTIONEXERCISE - Medical entrances gallery
39 Videos
Similar Questions
The velocity − time graph of a particle is as shown in figure

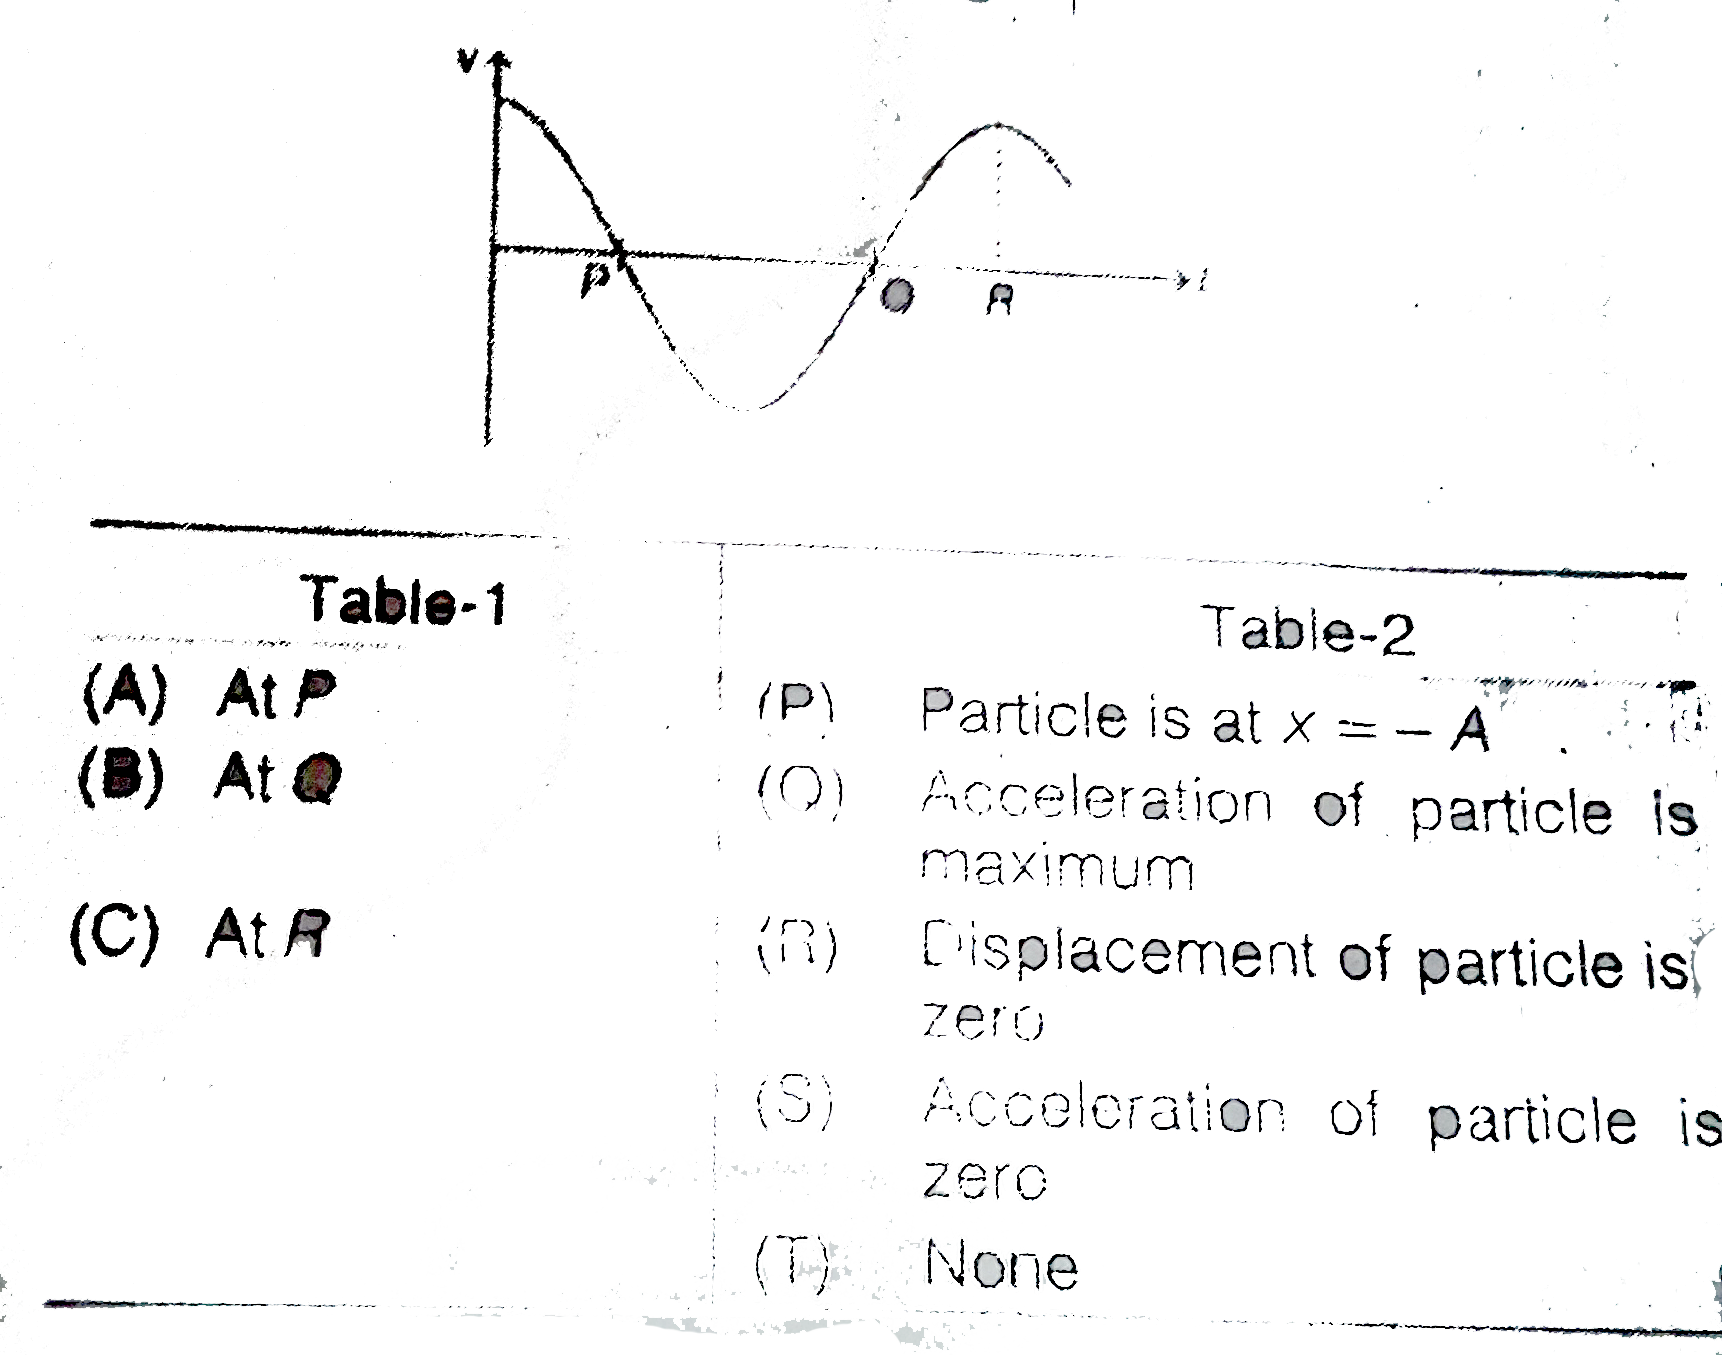
View SolutionVelocity-time graph of a particle in SHM is as shown in figure. Match the following
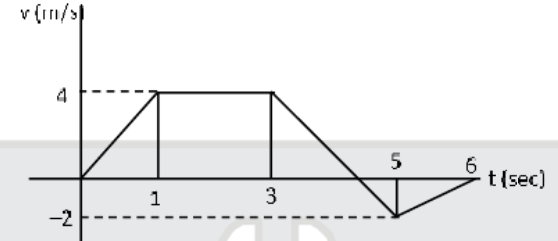
View Solutionvelocity time graph of a particle is shown in figure. Find displacement of the particle.
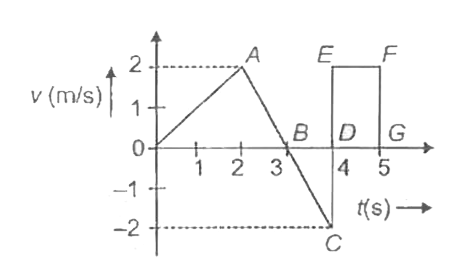
View SolutionThe velocity - time graph of a particle moving along a straight line is shown in the figure given below
The displacement of the particle in 5 second is
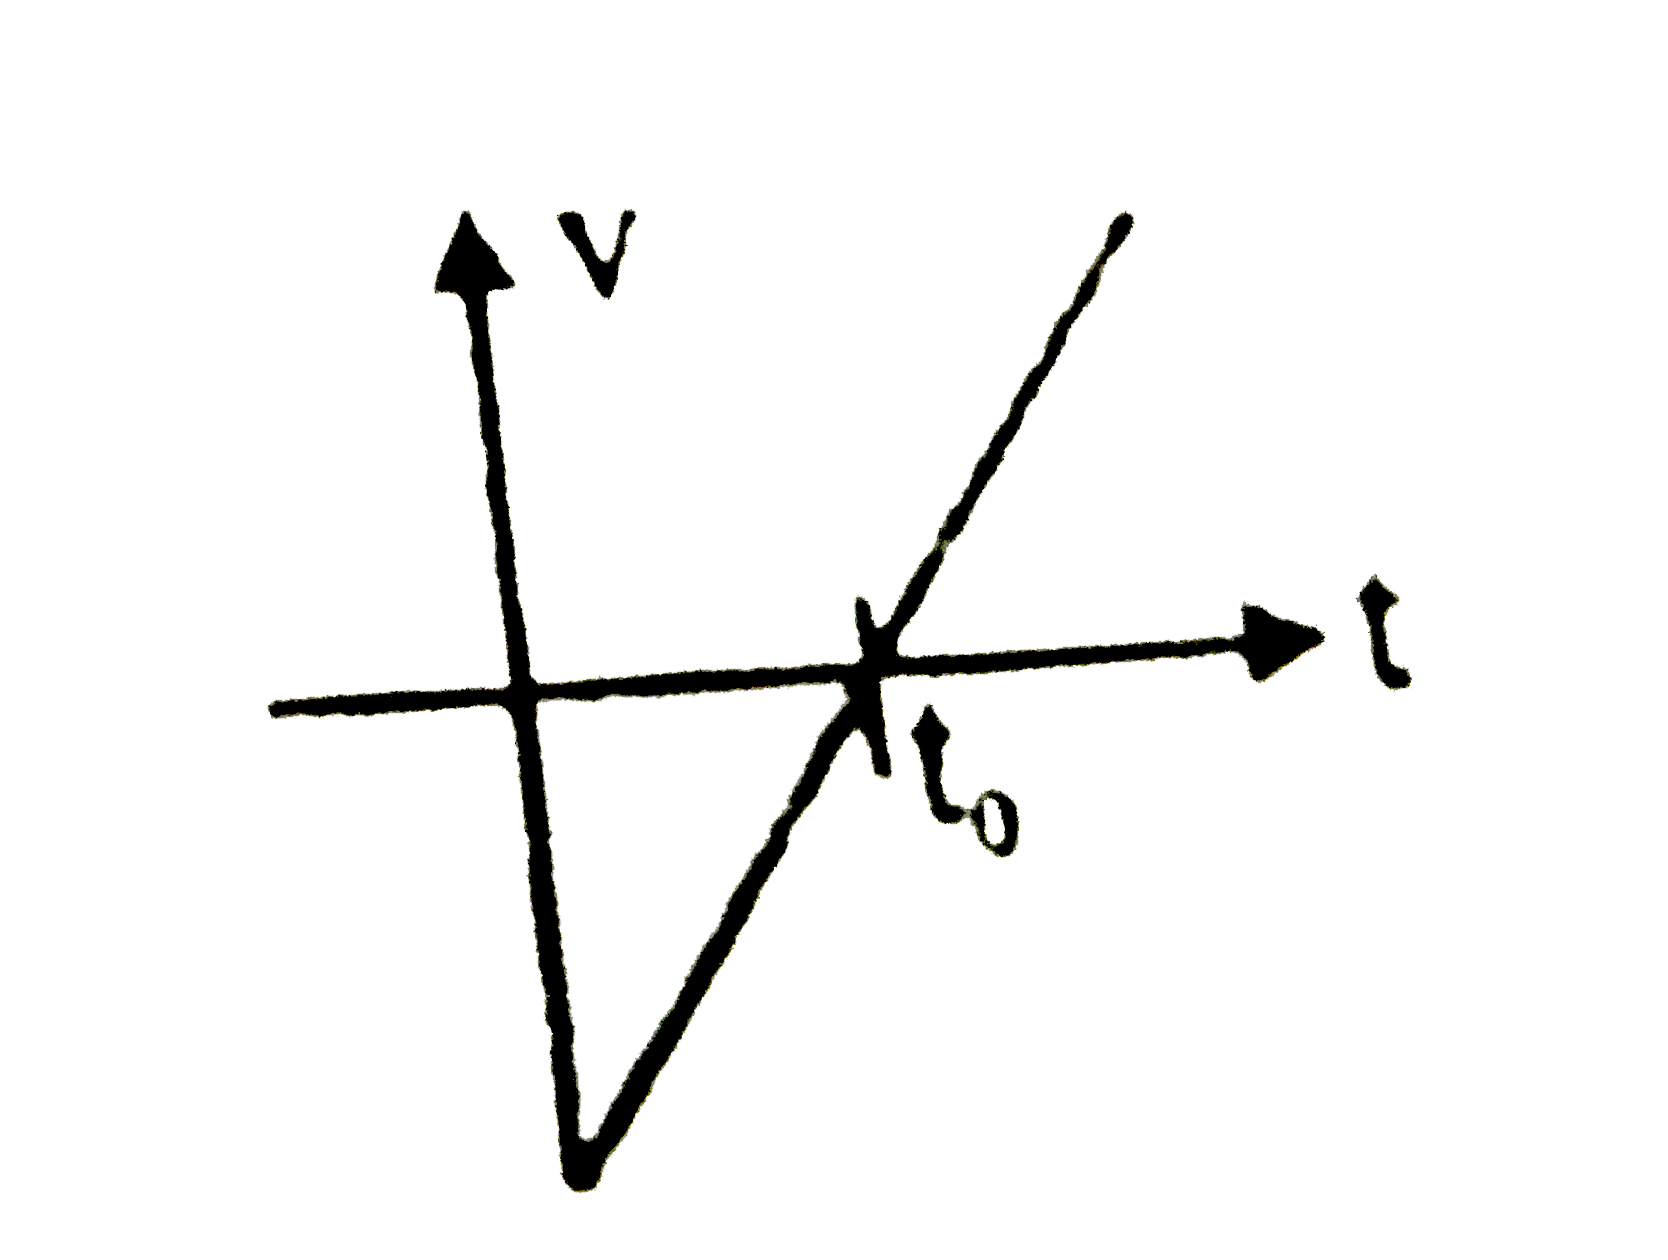
View SolutionThe velocity time graph of a particle moving in a straight line is given line is given in the figure. Then starting from t=0, the particle
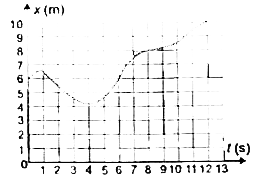
View SolutionPosition - time graph for a particle is shown in figure. Starting from t = 0, at what time t, the average velocity is zer?
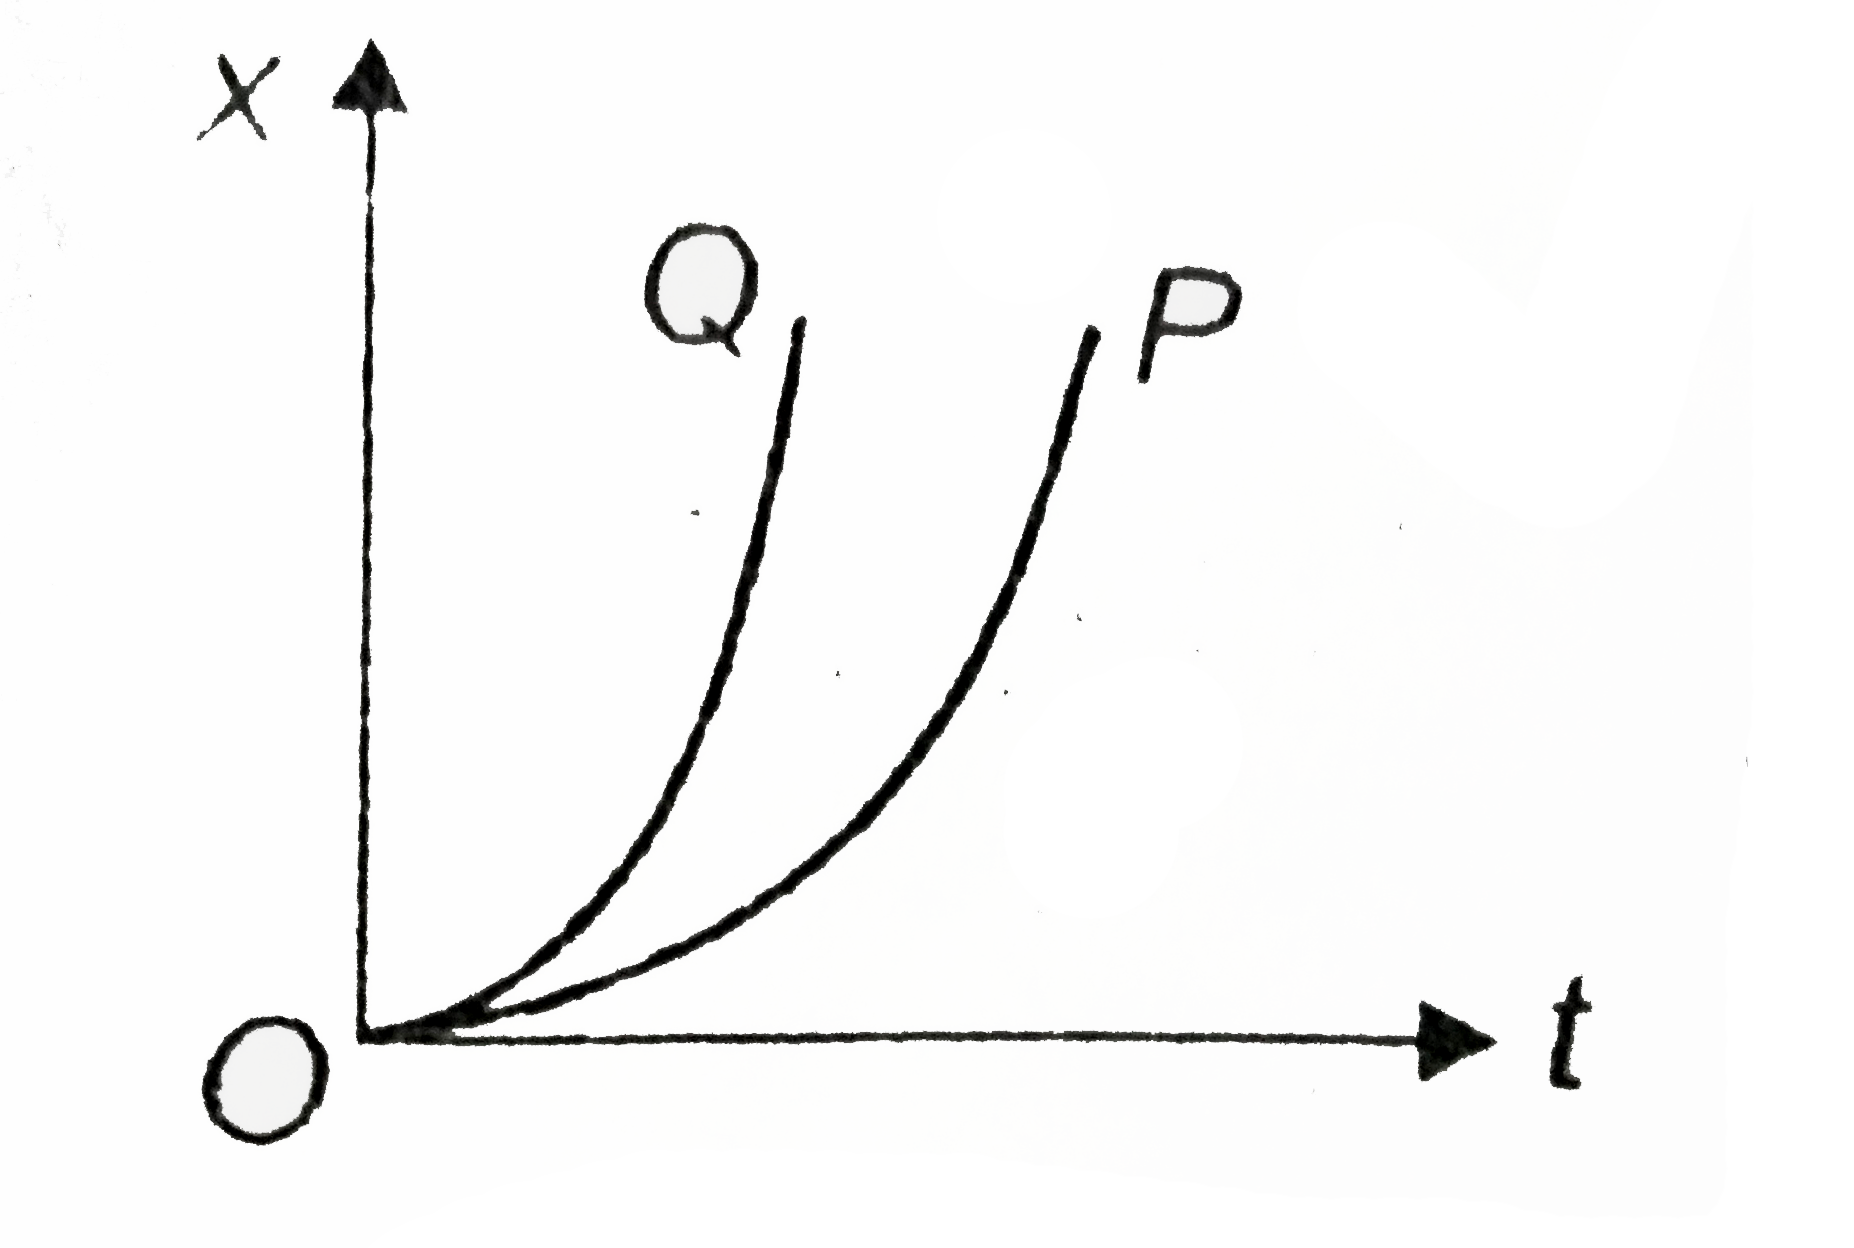
View SolutionThe position-time graph for two particles P and Q moving on x-axis is shown in the figure. Then
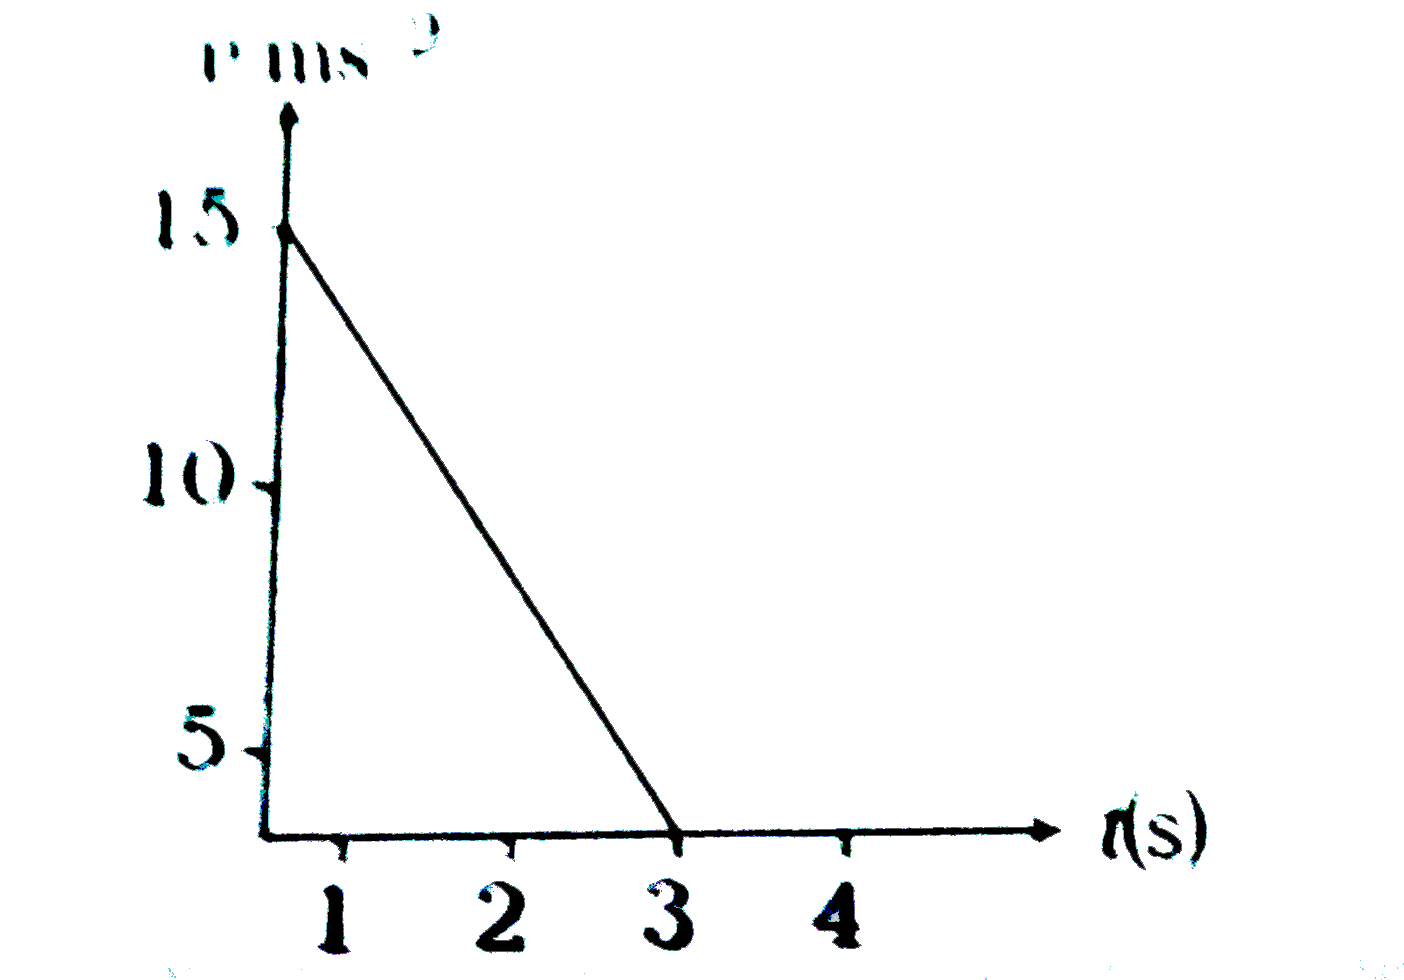
View SolutionThe velocity - time graph is shown in the figure, for a particle. The acceleration of particle is
View SolutionThe displacement-time graph of a particle executing SHM is as shown in the figure.

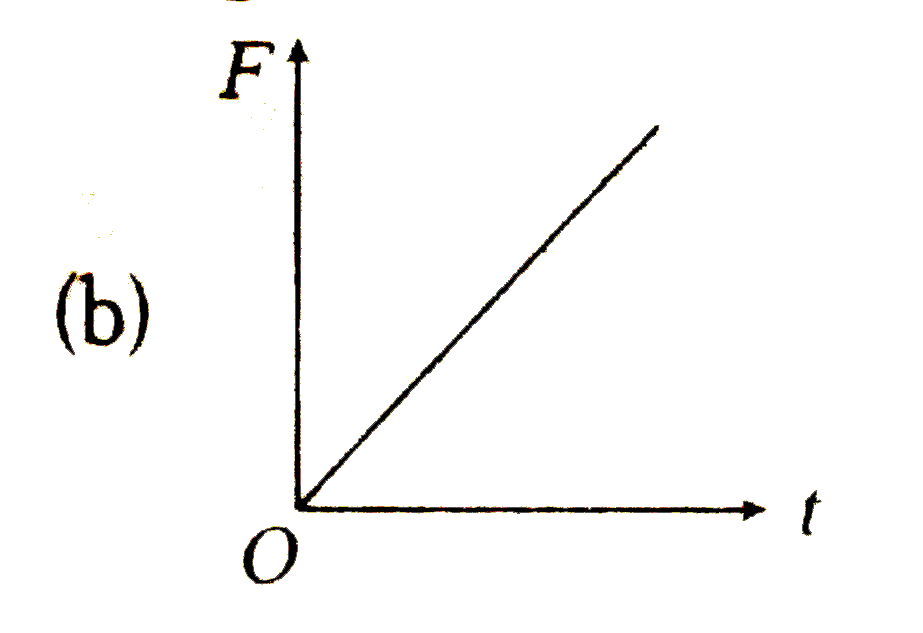
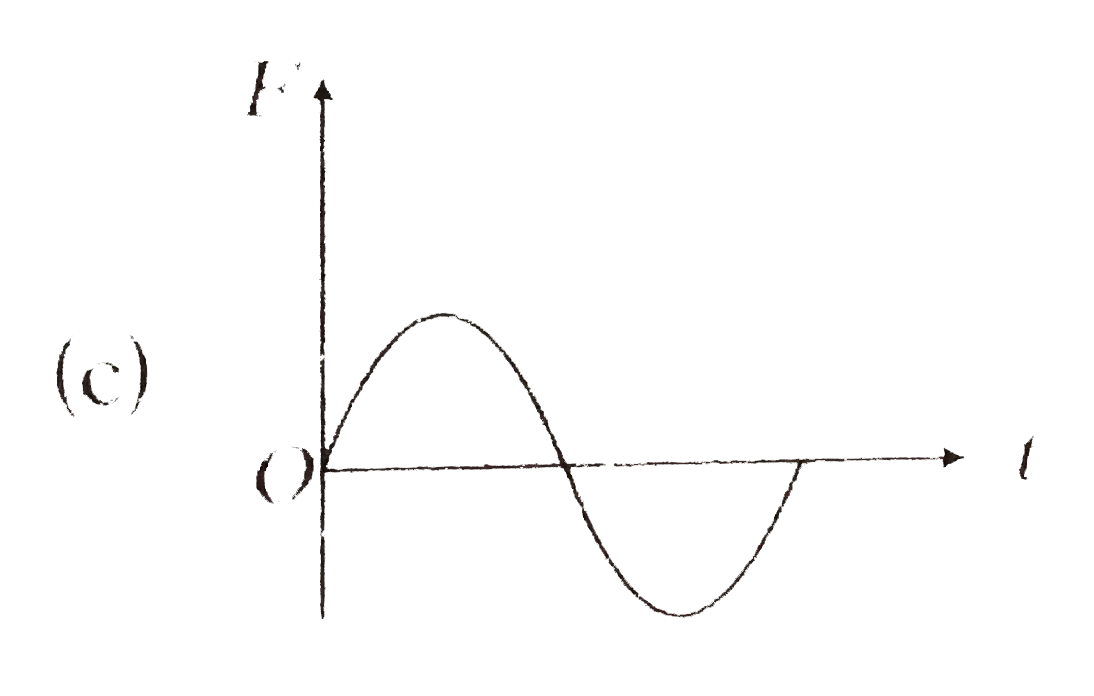
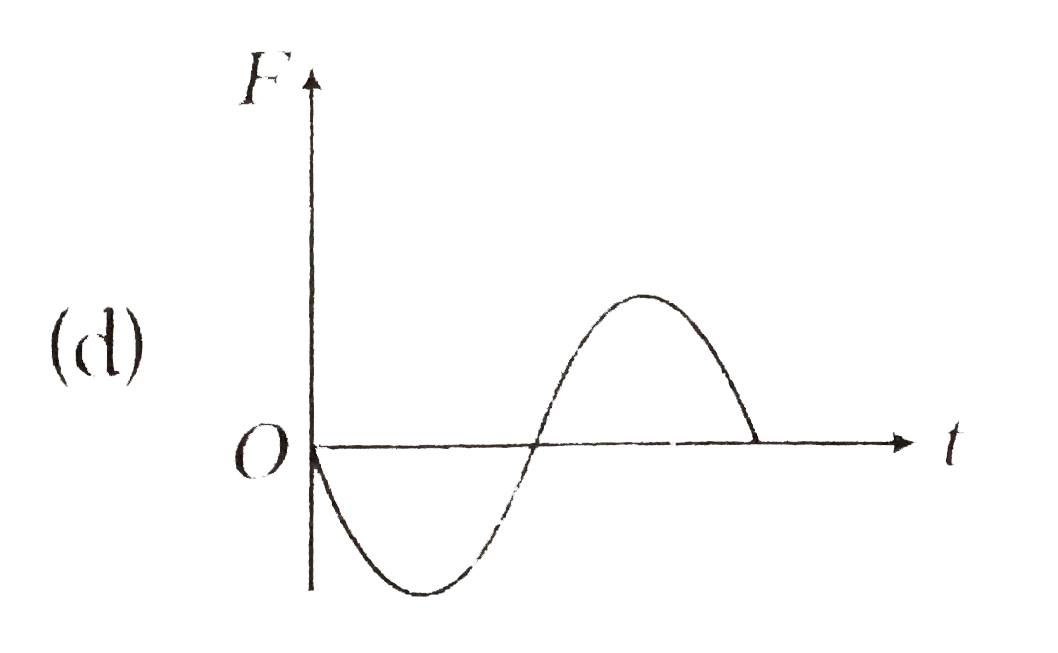
The corresponding force-time graph of the particle is
(a)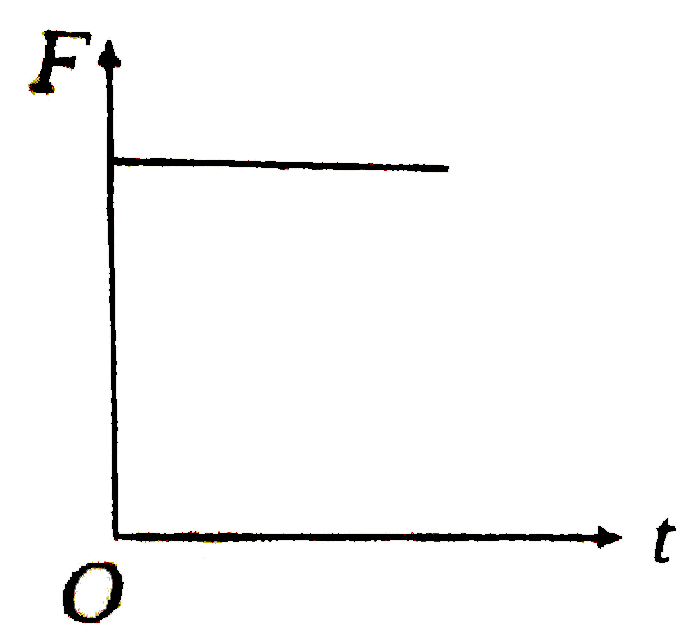
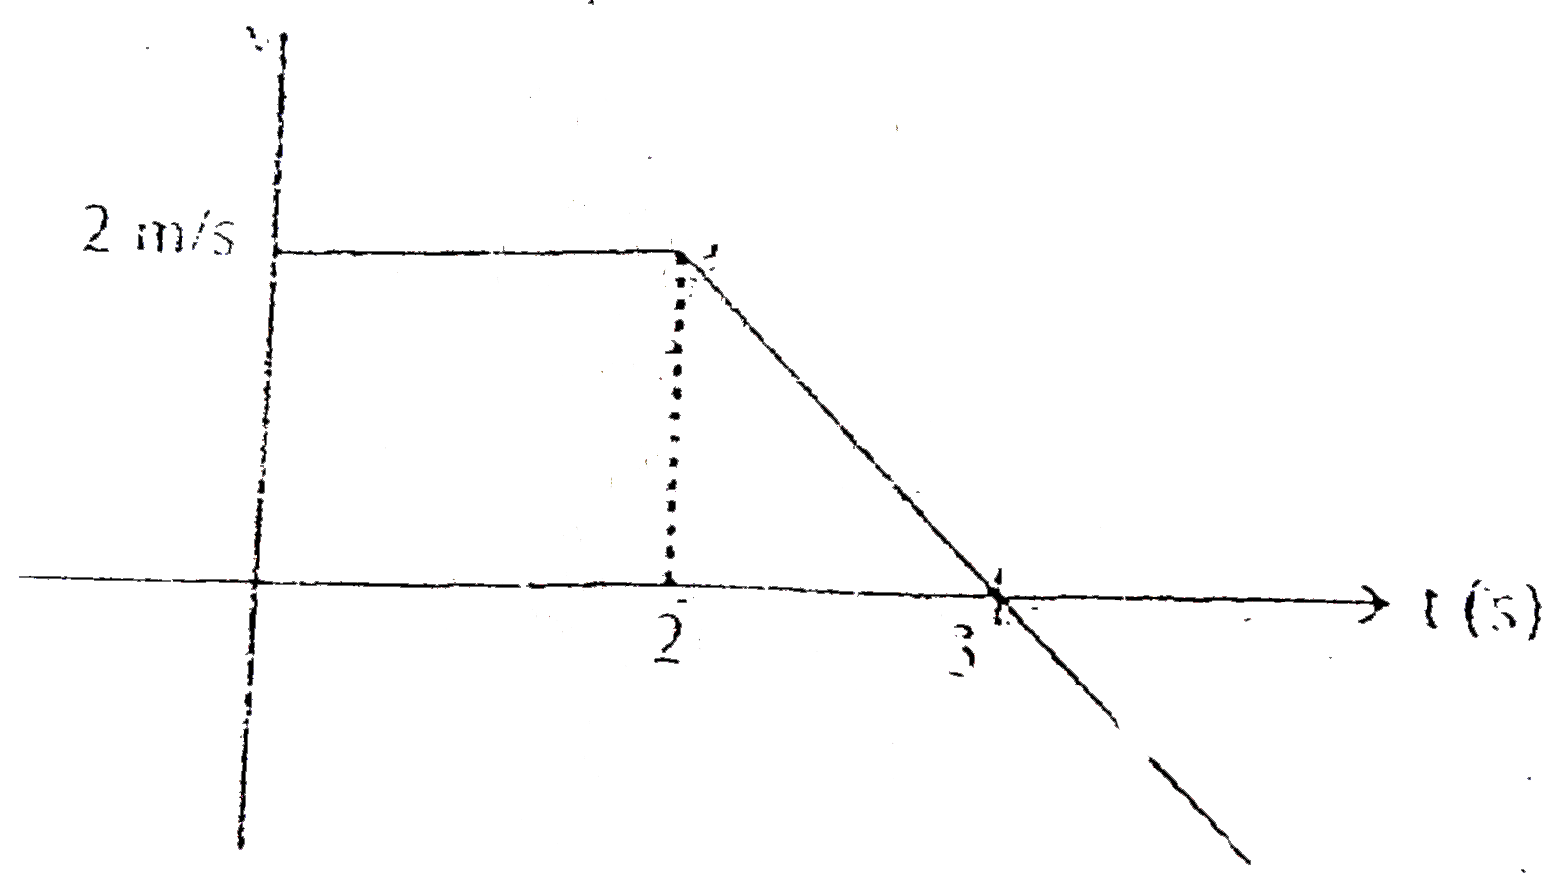
View SolutionA particle is moving on X−axis. Its velocity time graph is given in the figure. Find distance travelled by the particle in 5sec.
View Solution
