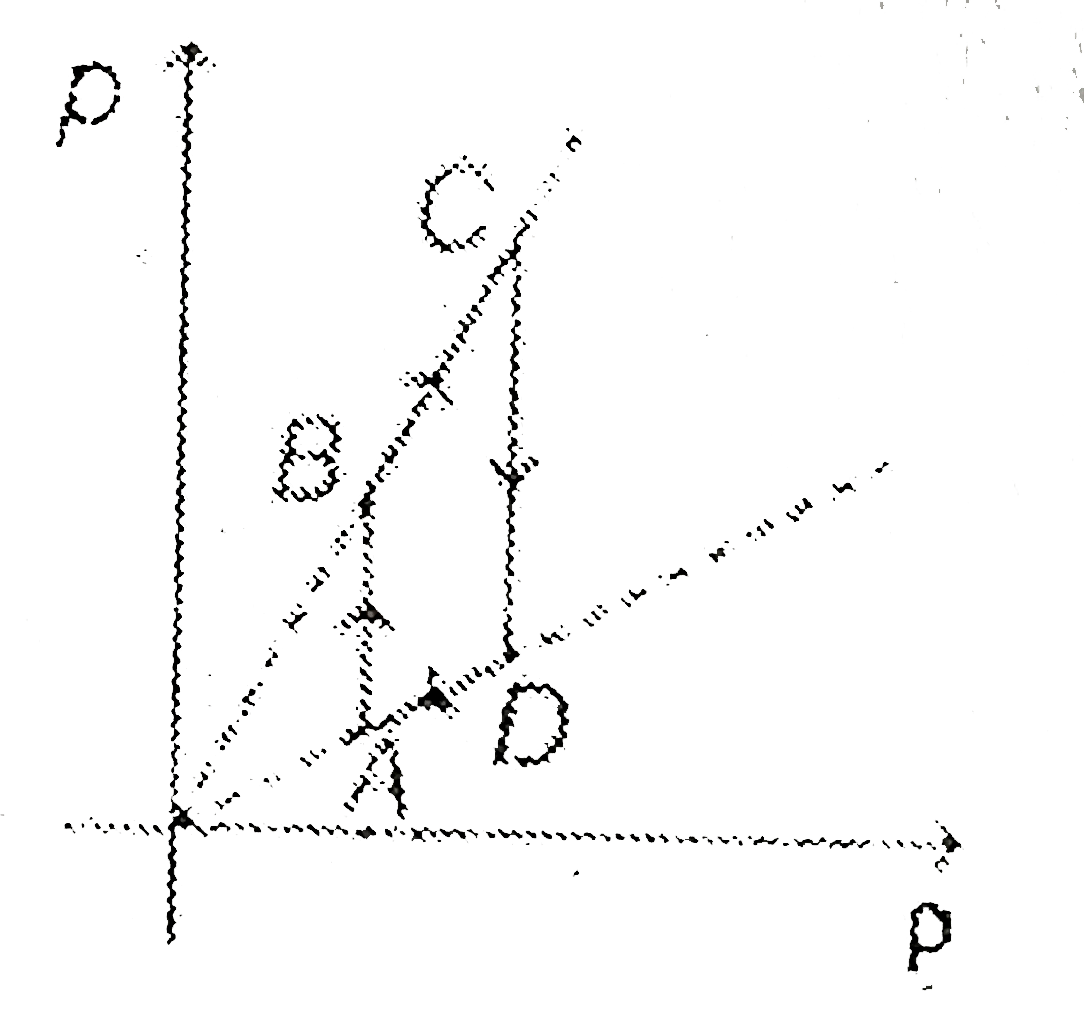
In the process PV = constant, pressure (P) versus density (ρ) graph of an ideal gas is
a straight line parallel to P-axis
a straight line parallel to ρ-axis
a straight line passing through origin
a parabola
The correct Answer is:C
Step by step video & image solution for In the process PV = constant, pressure (P) versus density (rho) graph of an ideal gas is by Physics experts to help you in doubts & scoring excellent marks in Class 11 exams.
Updated on:21/07/2023Topper's Solved these Questions
Similar Questions
Knowledge Check
The graph of PV vs P for a gas is
AparabolicBhyperbolicCa straight line parallel to X-axisDa straight line passing through origin
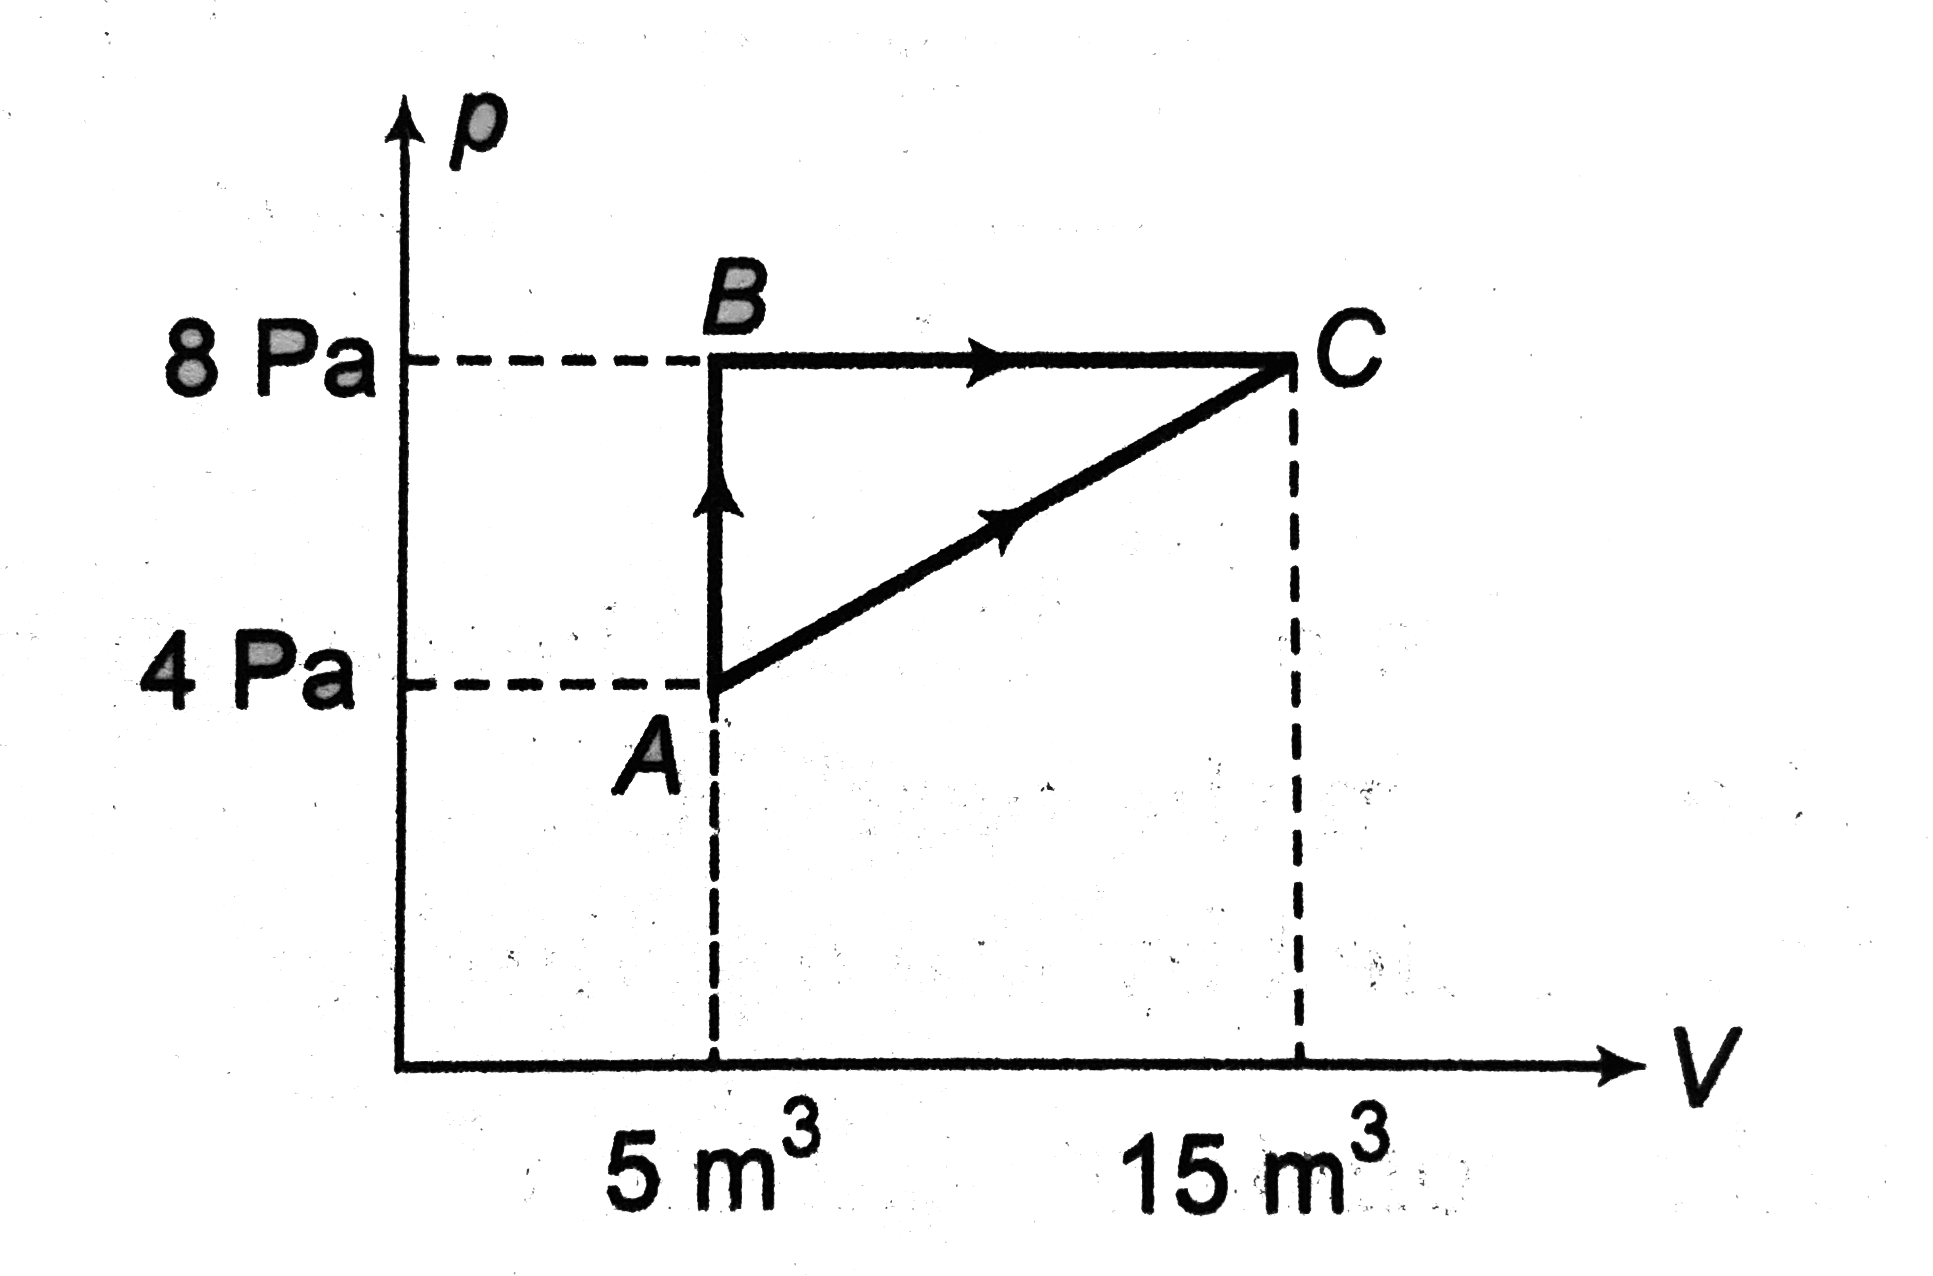
p-V diagram of an ideal gas for a process ABC is as shown in the figure.
(a) Find total heat absorbed or released by the gas during the process ABC.
(b) Change in internal energy of the gas during the process ABC.
(c) Plot pressure versus density graph of the gas for the process ABC.
View SolutionWhich of the following shown the correct relationship between the pressure 'P' and density ρ of an ideal gas at constant temperature?
View SolutionFor polytropic process PVn = constant, molar heat capacity (Cm) of an ideal gas is given by:
View SolutionAt a constant temperature what is the relation between pressure P density d of an ideal gas ?
View SolutionIn the process pV2= constant, if temperature of gas is increased, then
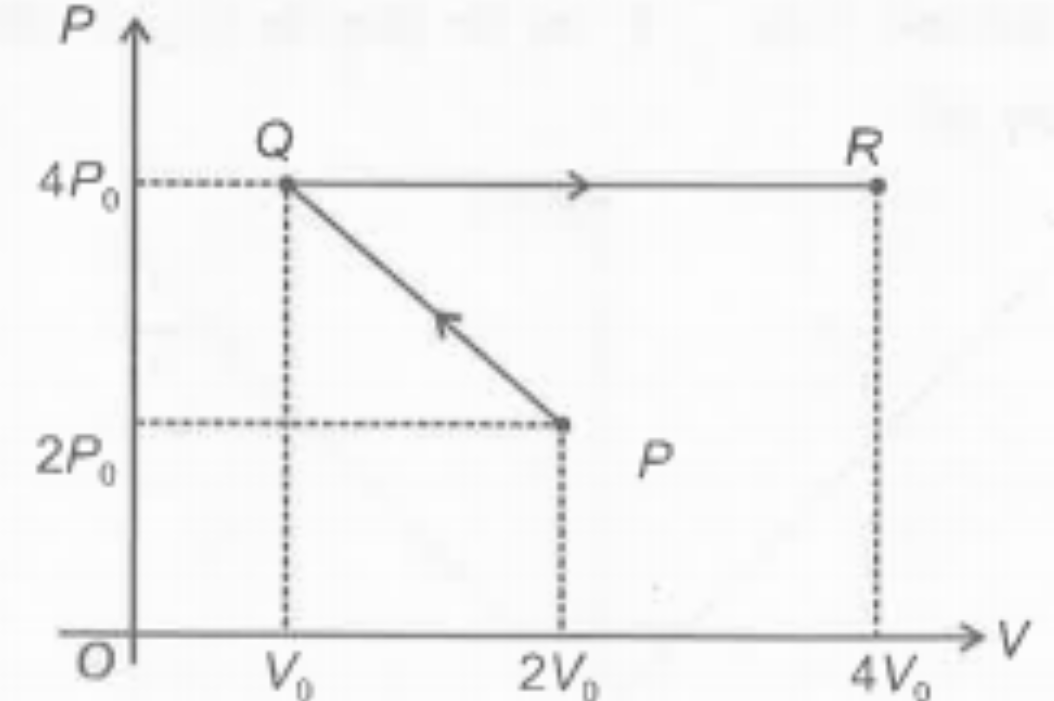
View SolutionAn ideal gas undergoes a process P→Q→R as shown in pressure (p) - volume (v) diagram.The work done by the gas is

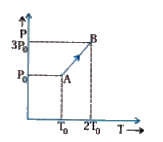
View SolutionIn figure shown,Pressure versus temperature graph of an ideal gas is as . Density of the gas at point A is ρ0 . Density at point B will be ____

View Solution

