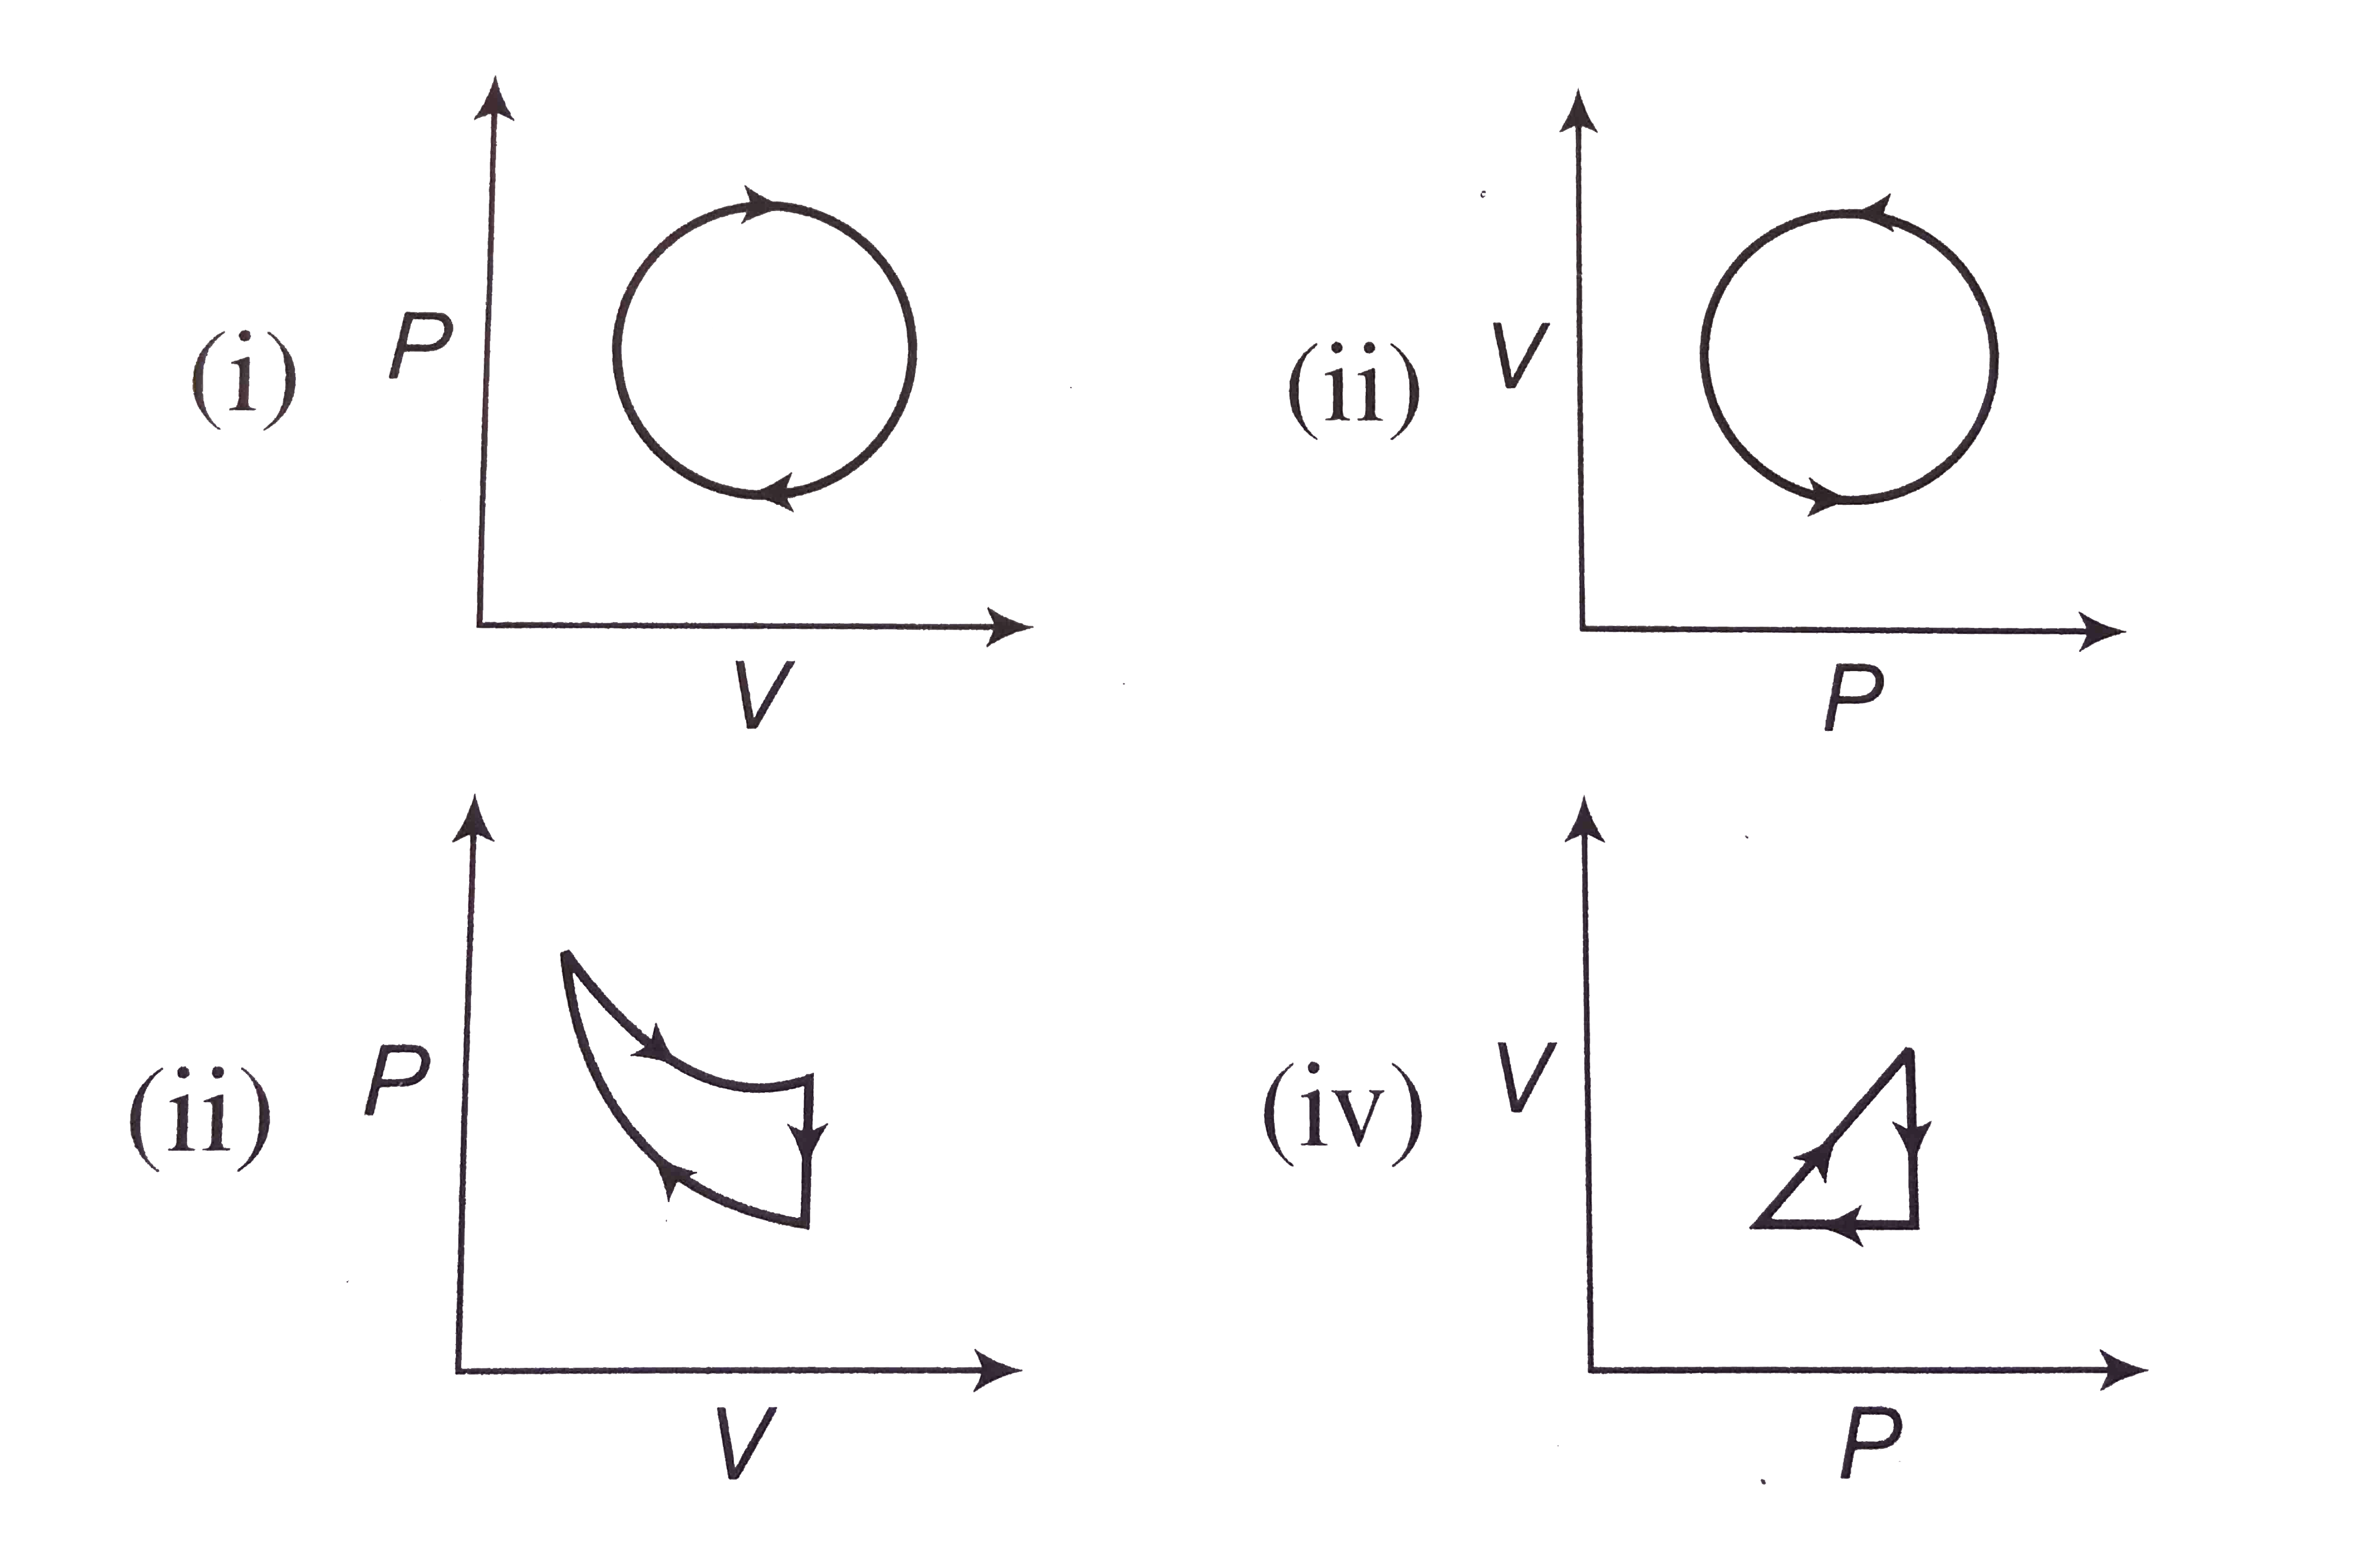
The following are the P−V diagram for cyclic process for a gas. In which of these processes, heat is not obsorbed by the gas?
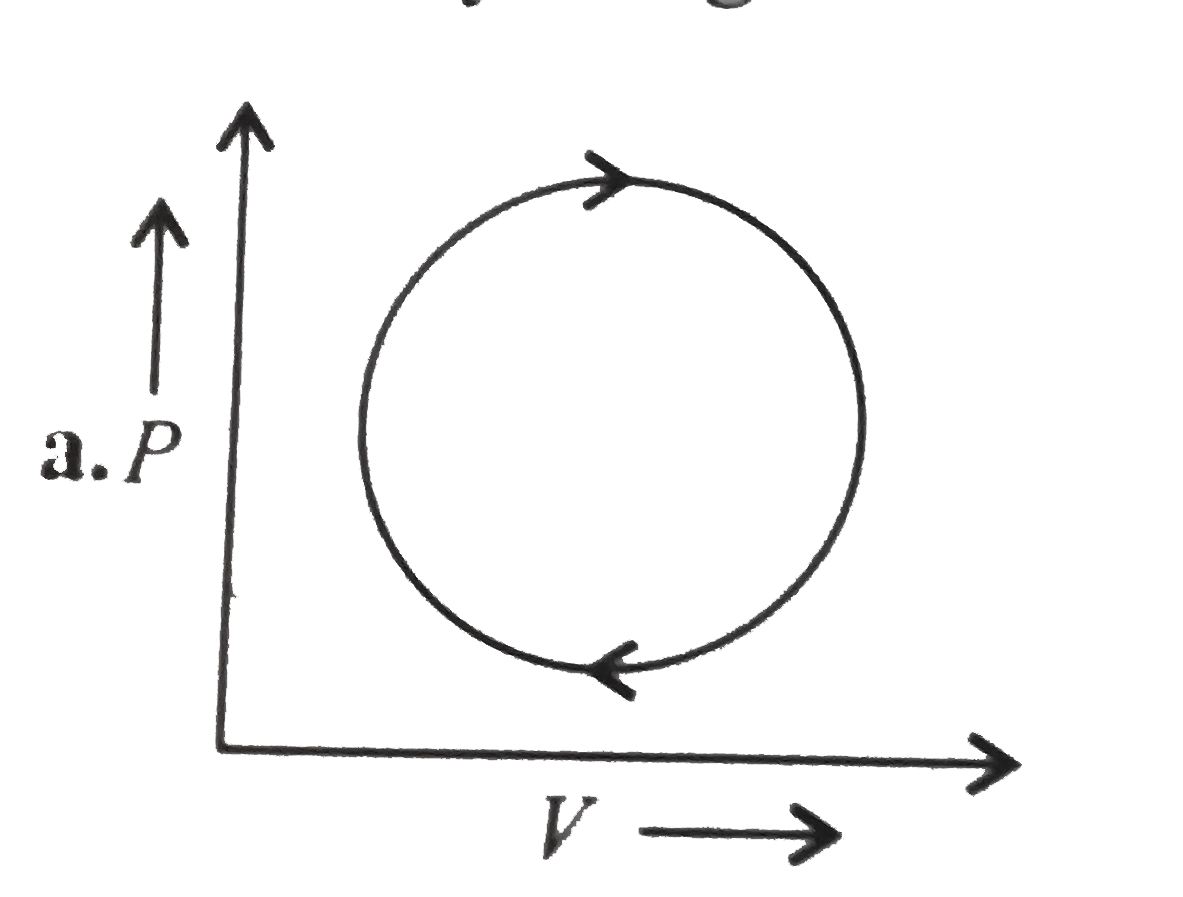
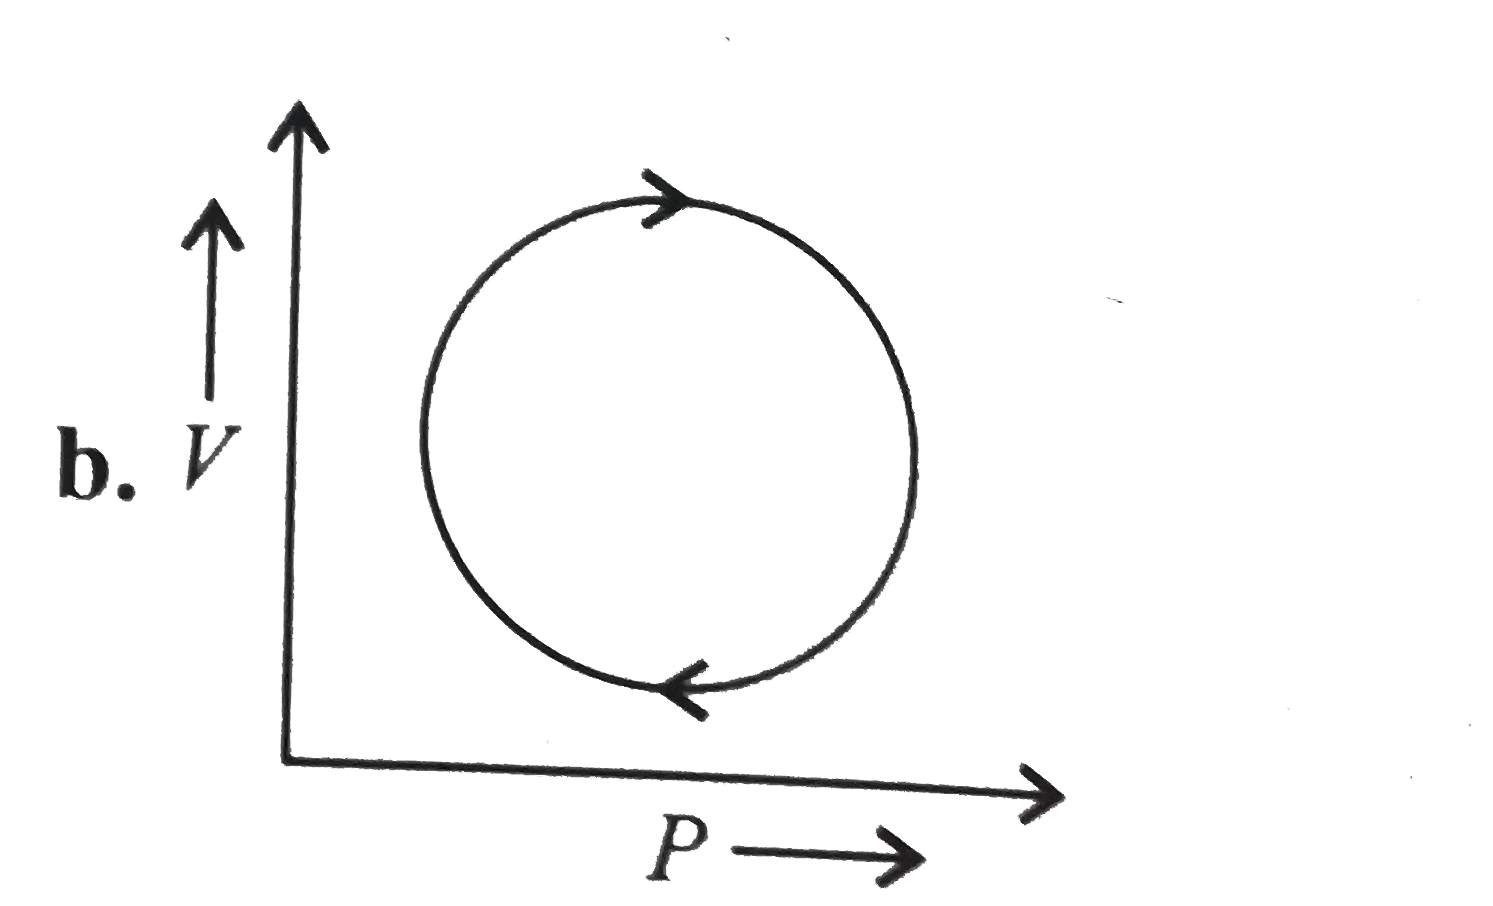
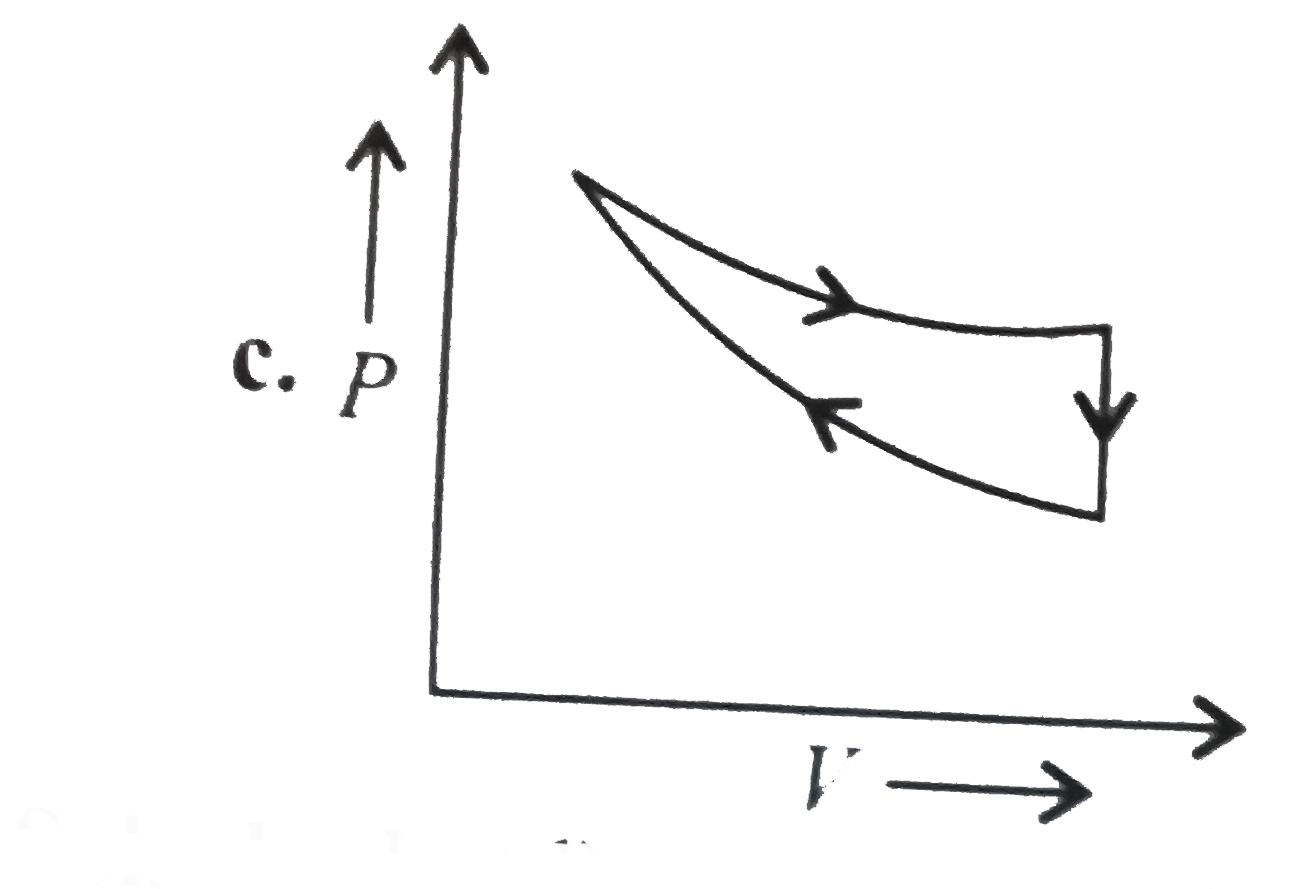
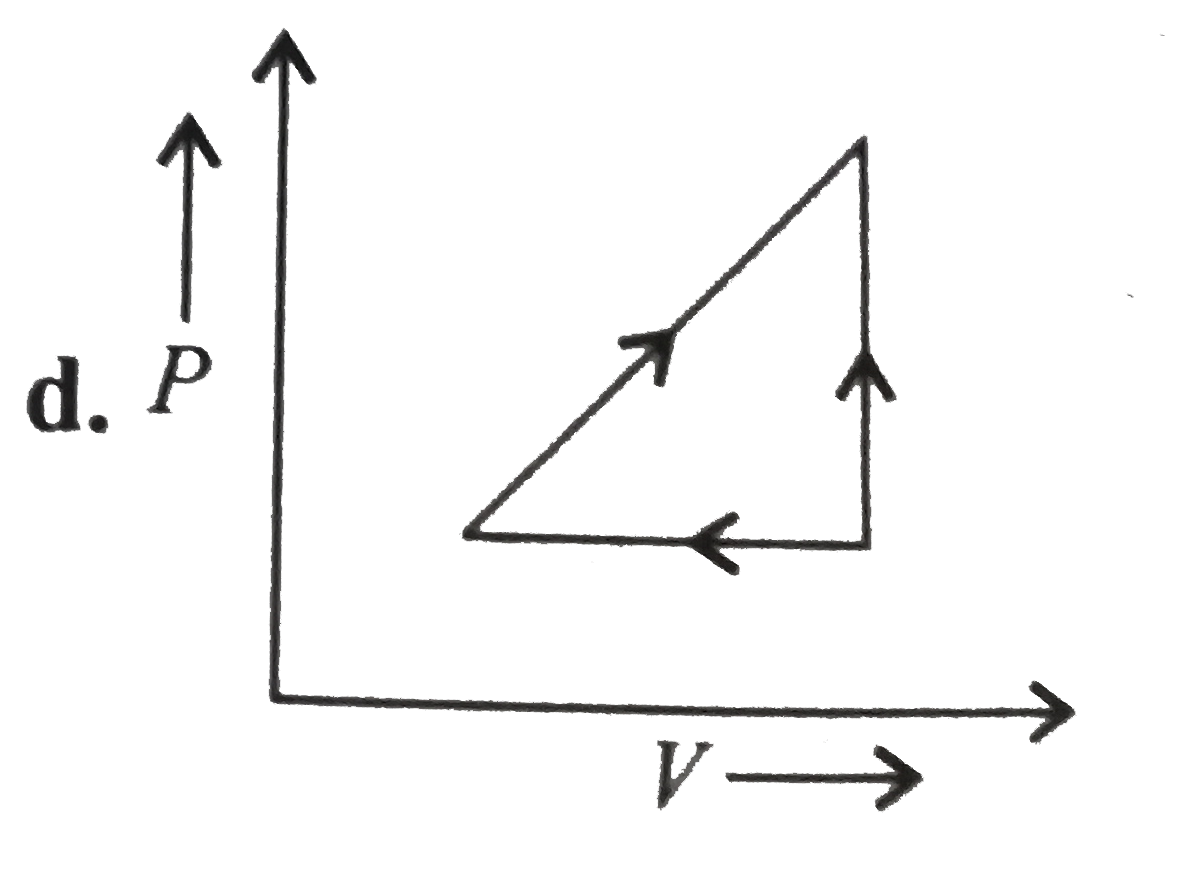
To solve the question regarding which of the given P-V diagrams for a cyclic process indicates that heat is not absorbed by the gas, we can analyze the characteristics of cyclic processes in thermodynamics.
1. Understanding Cyclic Processes: In a cyclic process, the system (gas) returns to its initial state after completing a cycle. The net change in internal energy over one complete cycle is zero.
2. Work Done in Cyclic Processes: The work done by the gas during a cyclic process can be determined by the area enclosed by the P-V diagram. If the area is positive (the process moves in a clockwise direction), the gas does work on the surroundings, and heat is absorbed by the gas.
3. Analyzing the P-V Diagrams: Examine each P-V diagram provided:
- Diagram A: If the process is clockwise, the gas absorbs heat.
- Diagram B: If the process is counterclockwise, the gas releases heat.
- Diagram C: Similar to A, if it’s clockwise, heat is absorbed.
- Diagram D: If it is a straight line or a closed loop that does not enclose any area, it indicates no net work done.
4. Identifying the Correct Diagram: From the analysis:
- If Diagram B represents a counterclockwise process, it indicates that the gas is not absorbing heat, as it is doing work on the surroundings without receiving heat.
5. Conclusion: The process represented in Diagram B is the one where heat is not absorbed by the gas.
Final Answer:
The process in which heat is not absorbed by the gas is represented by Diagram B.
---
- Diagram A: If the process is clockwise, the gas absorbs heat.
- Diagram B: If the process is counterclockwise, the gas releases heat.
- Diagram C: Similar to A, if it’s clockwise, heat is absorbed.
- Diagram D: If it is a straight line or a closed loop that does not enclose any area, it indicates no net work done.
- If Diagram B represents a counterclockwise process, it indicates that the gas is not absorbing heat, as it is doing work on the surroundings without receiving heat.
The process in which heat is not absorbed by the gas is represented by Diagram B.
Topper's Solved these Questions
- THERMODYNAMICSBOOK - CENGAGE CHEMISTRY ENGLISHCHAPTER - THERMODYNAMICSEXERCISE - Exercise
1 Videos
- THERMODYNAMICSBOOK - CENGAGE CHEMISTRY ENGLISHCHAPTER - THERMODYNAMICSEXERCISE - Ex 6.1
26 Videos
- STOICHIOMETRYBOOK - CENGAGE CHEMISTRY ENGLISHCHAPTER - STOICHIOMETRYEXERCISE - Archives Subjective
33 Videos
Similar Questions
Knowledge Check
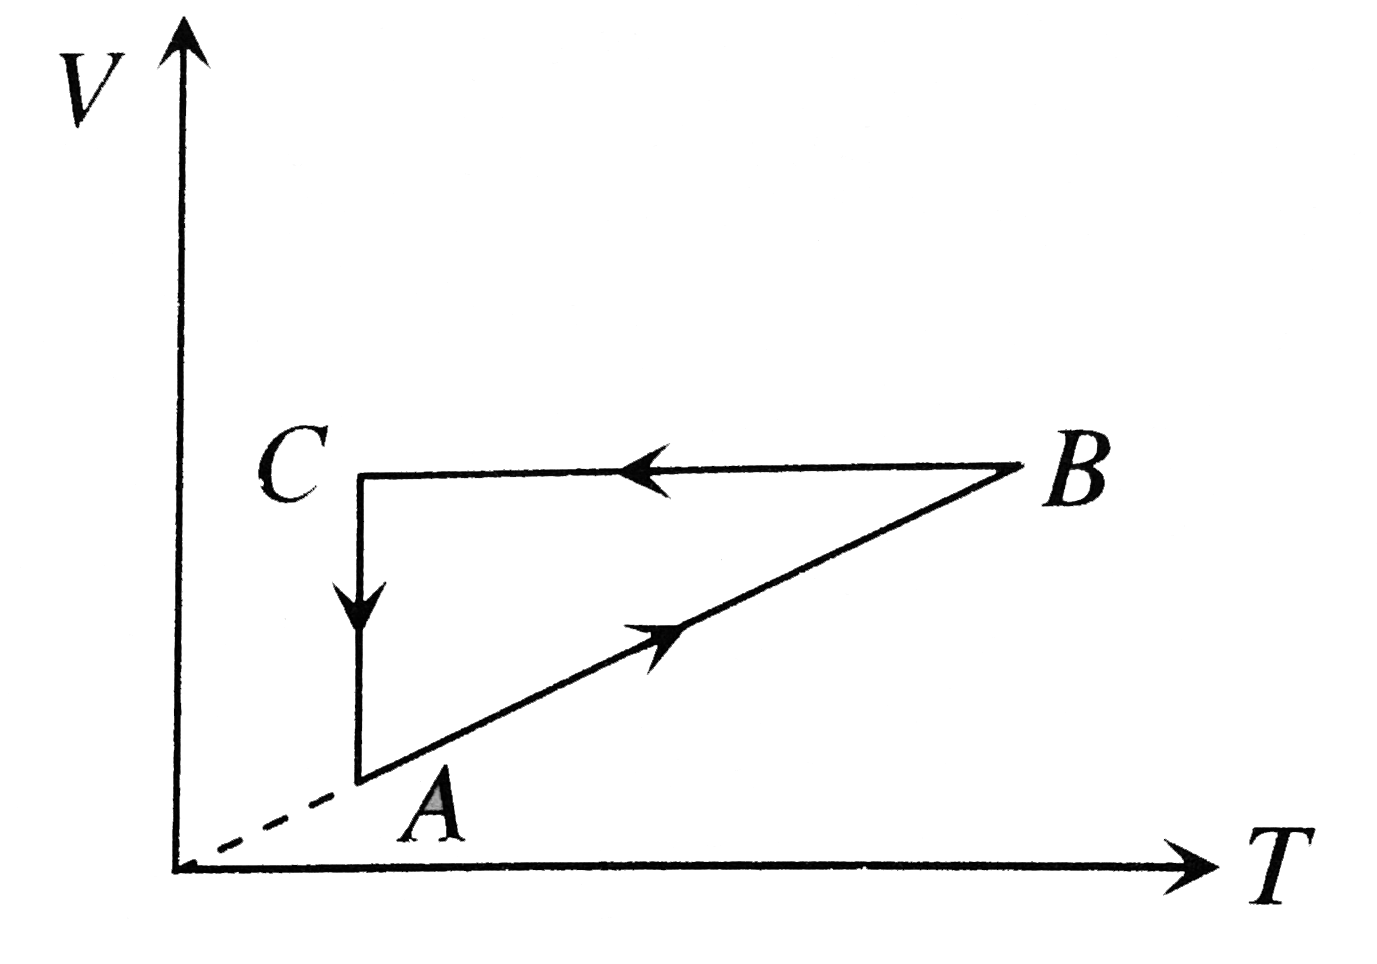
A cyclic process ABCA is shown in the V−T diagram process on the P−V
 A
A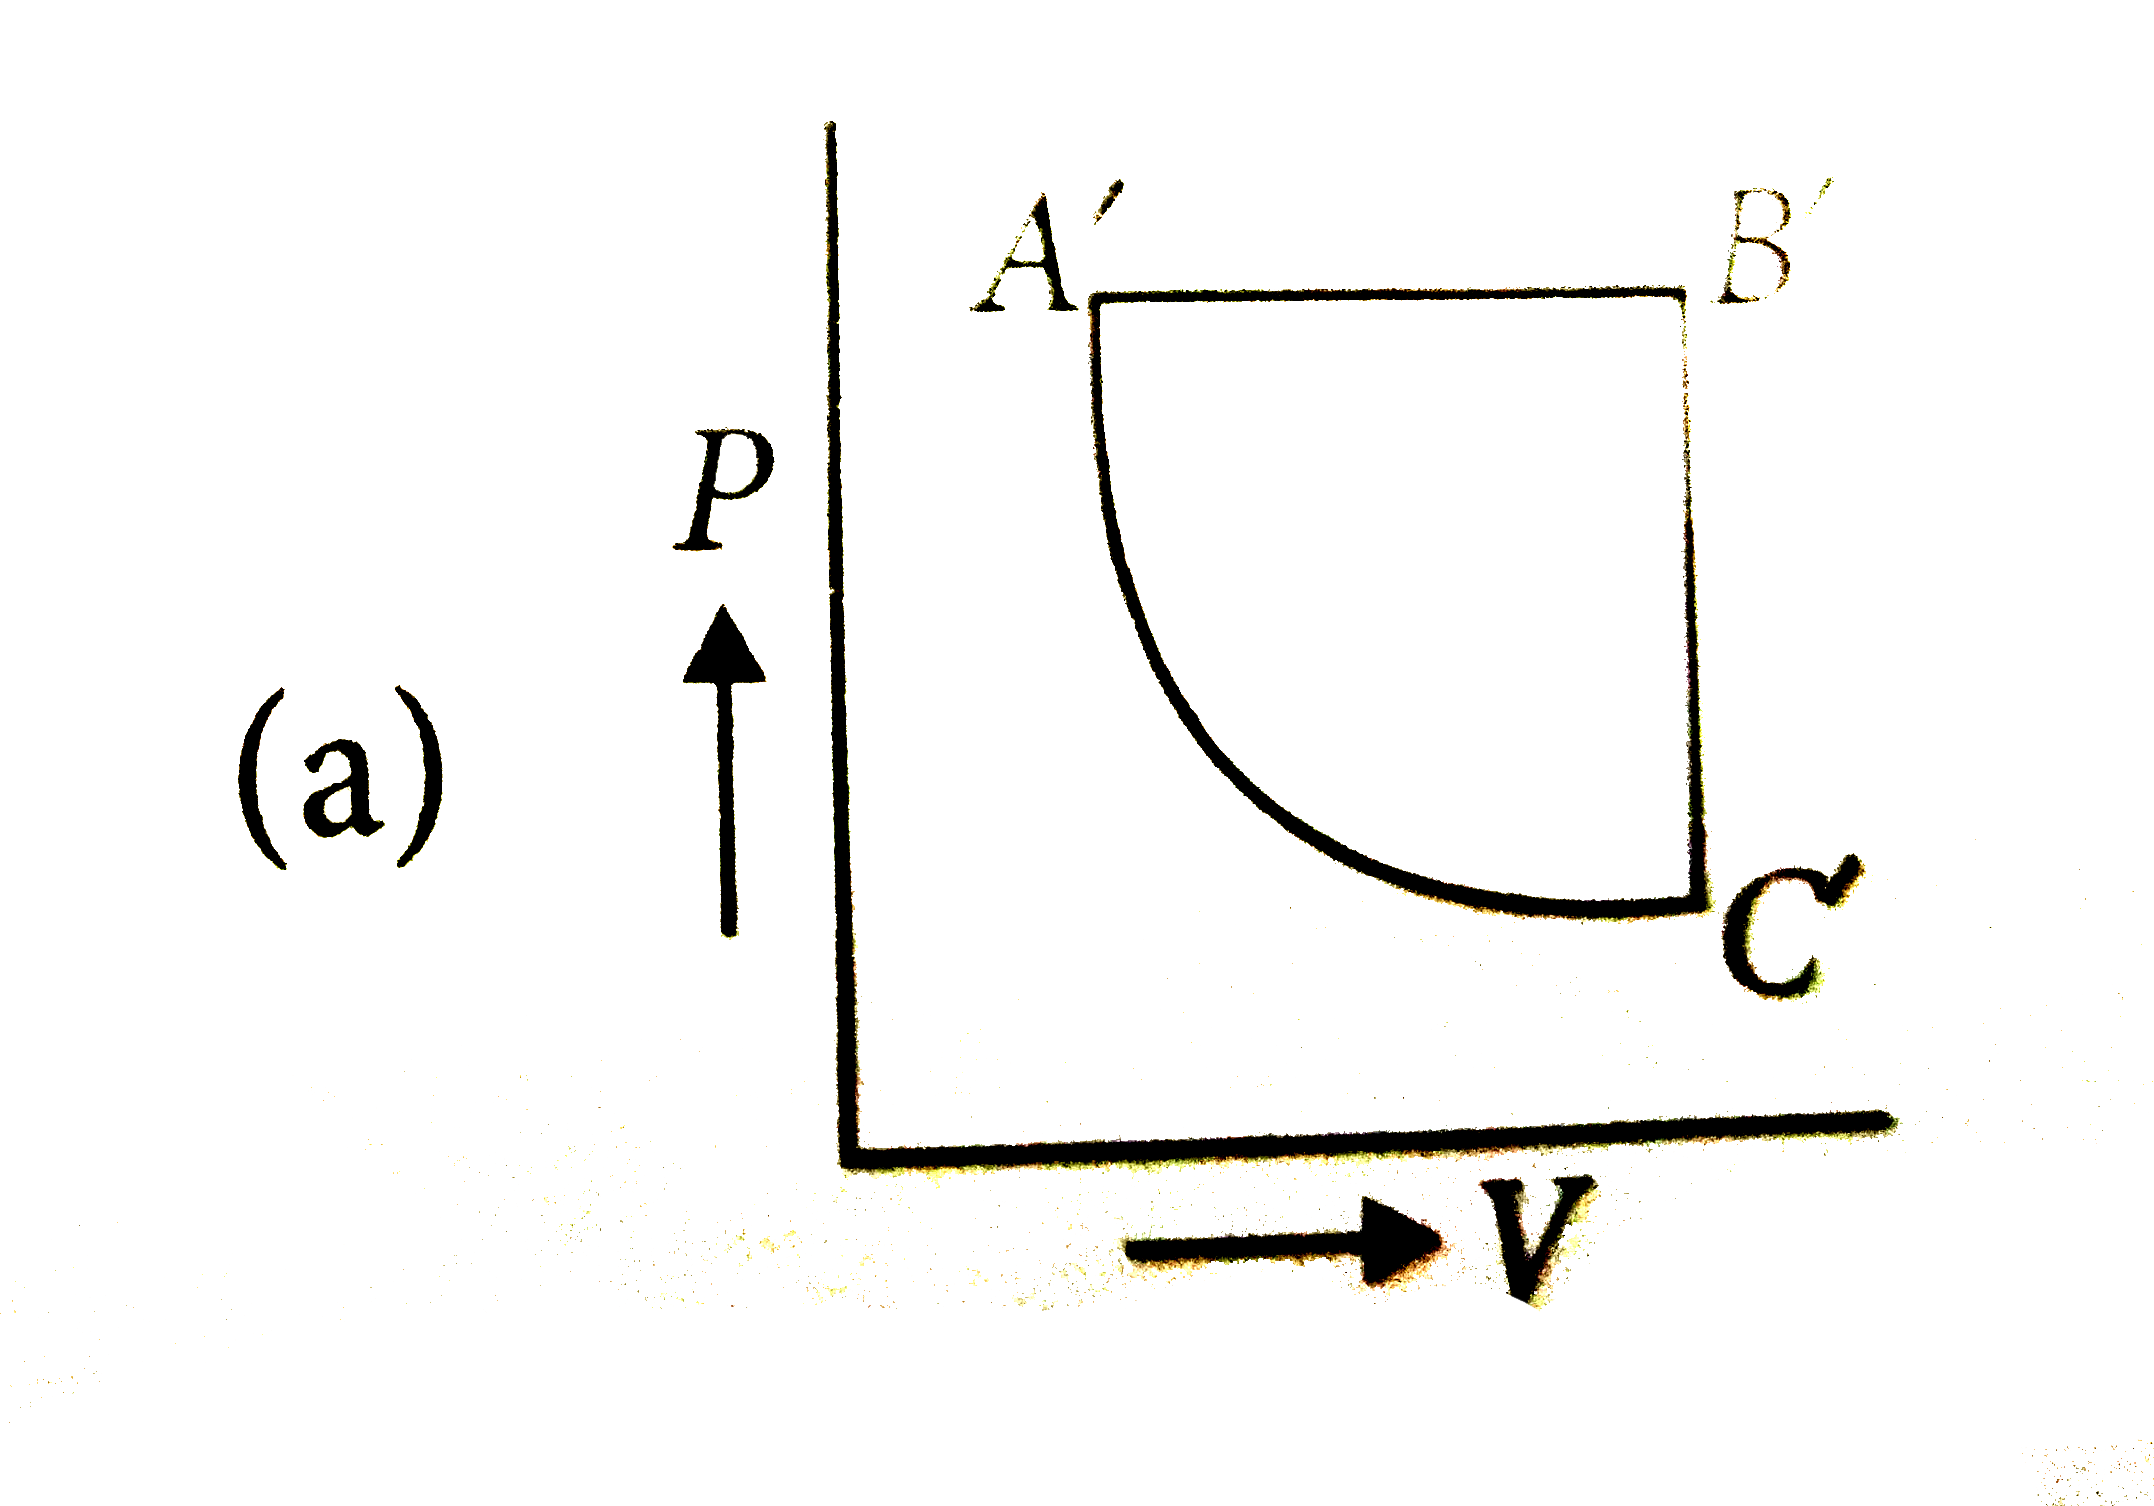 B
B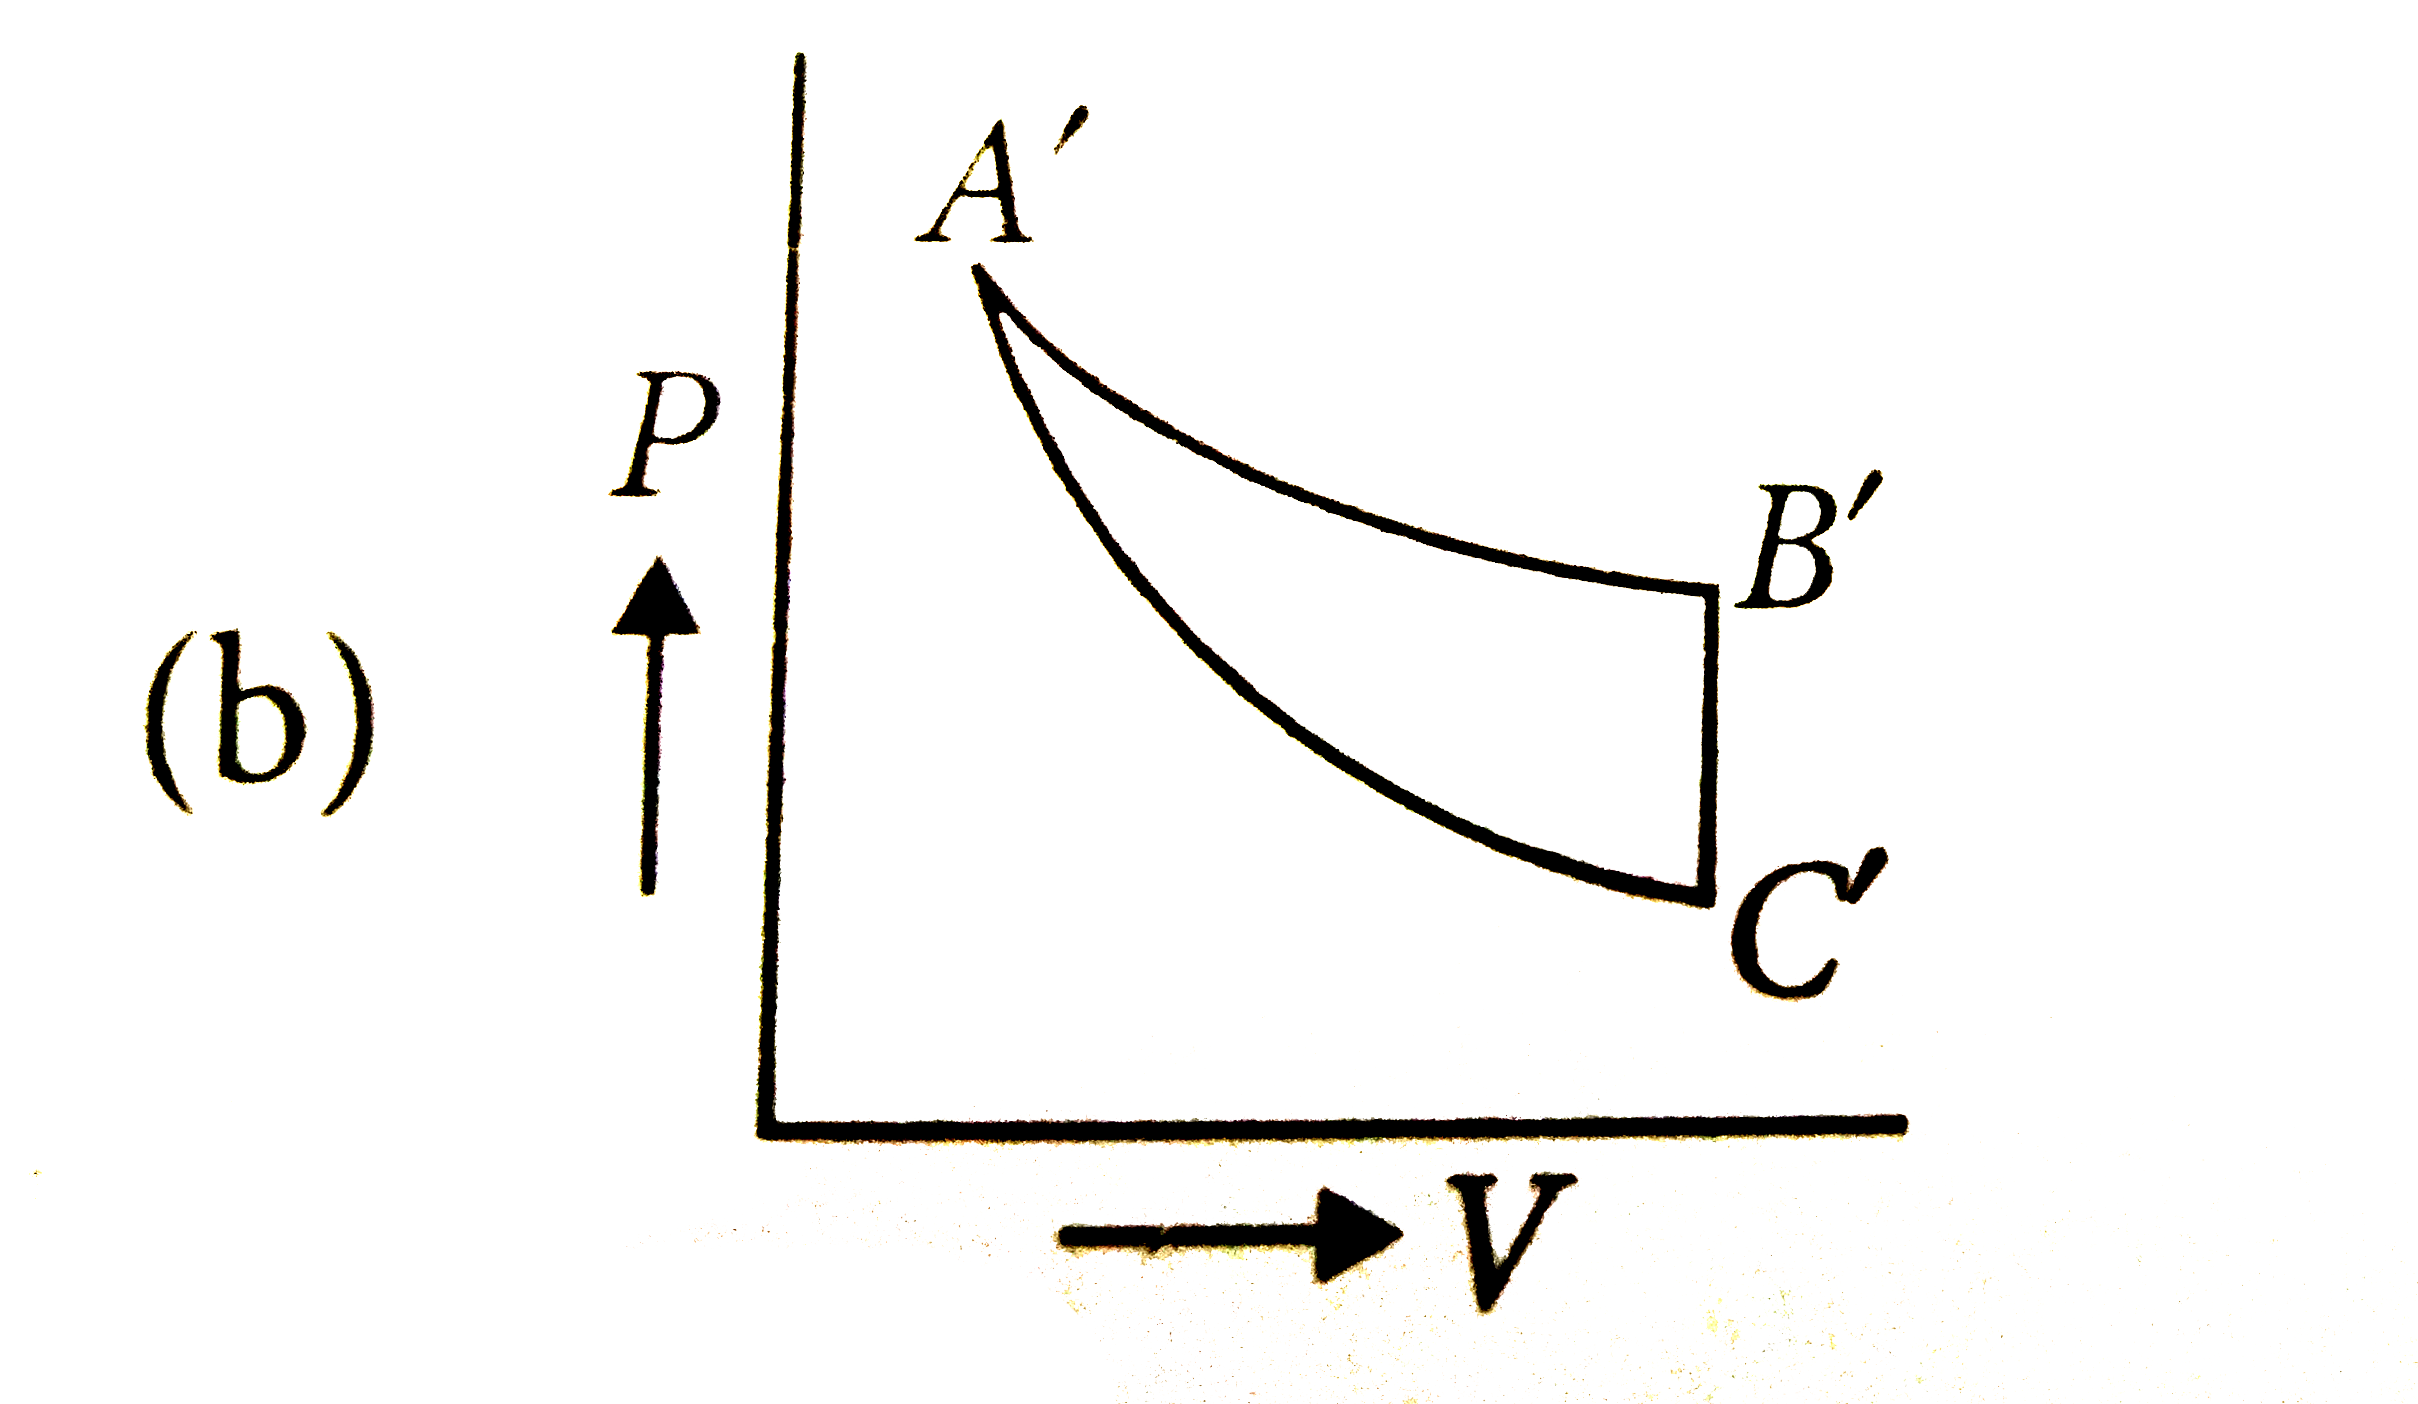 C
C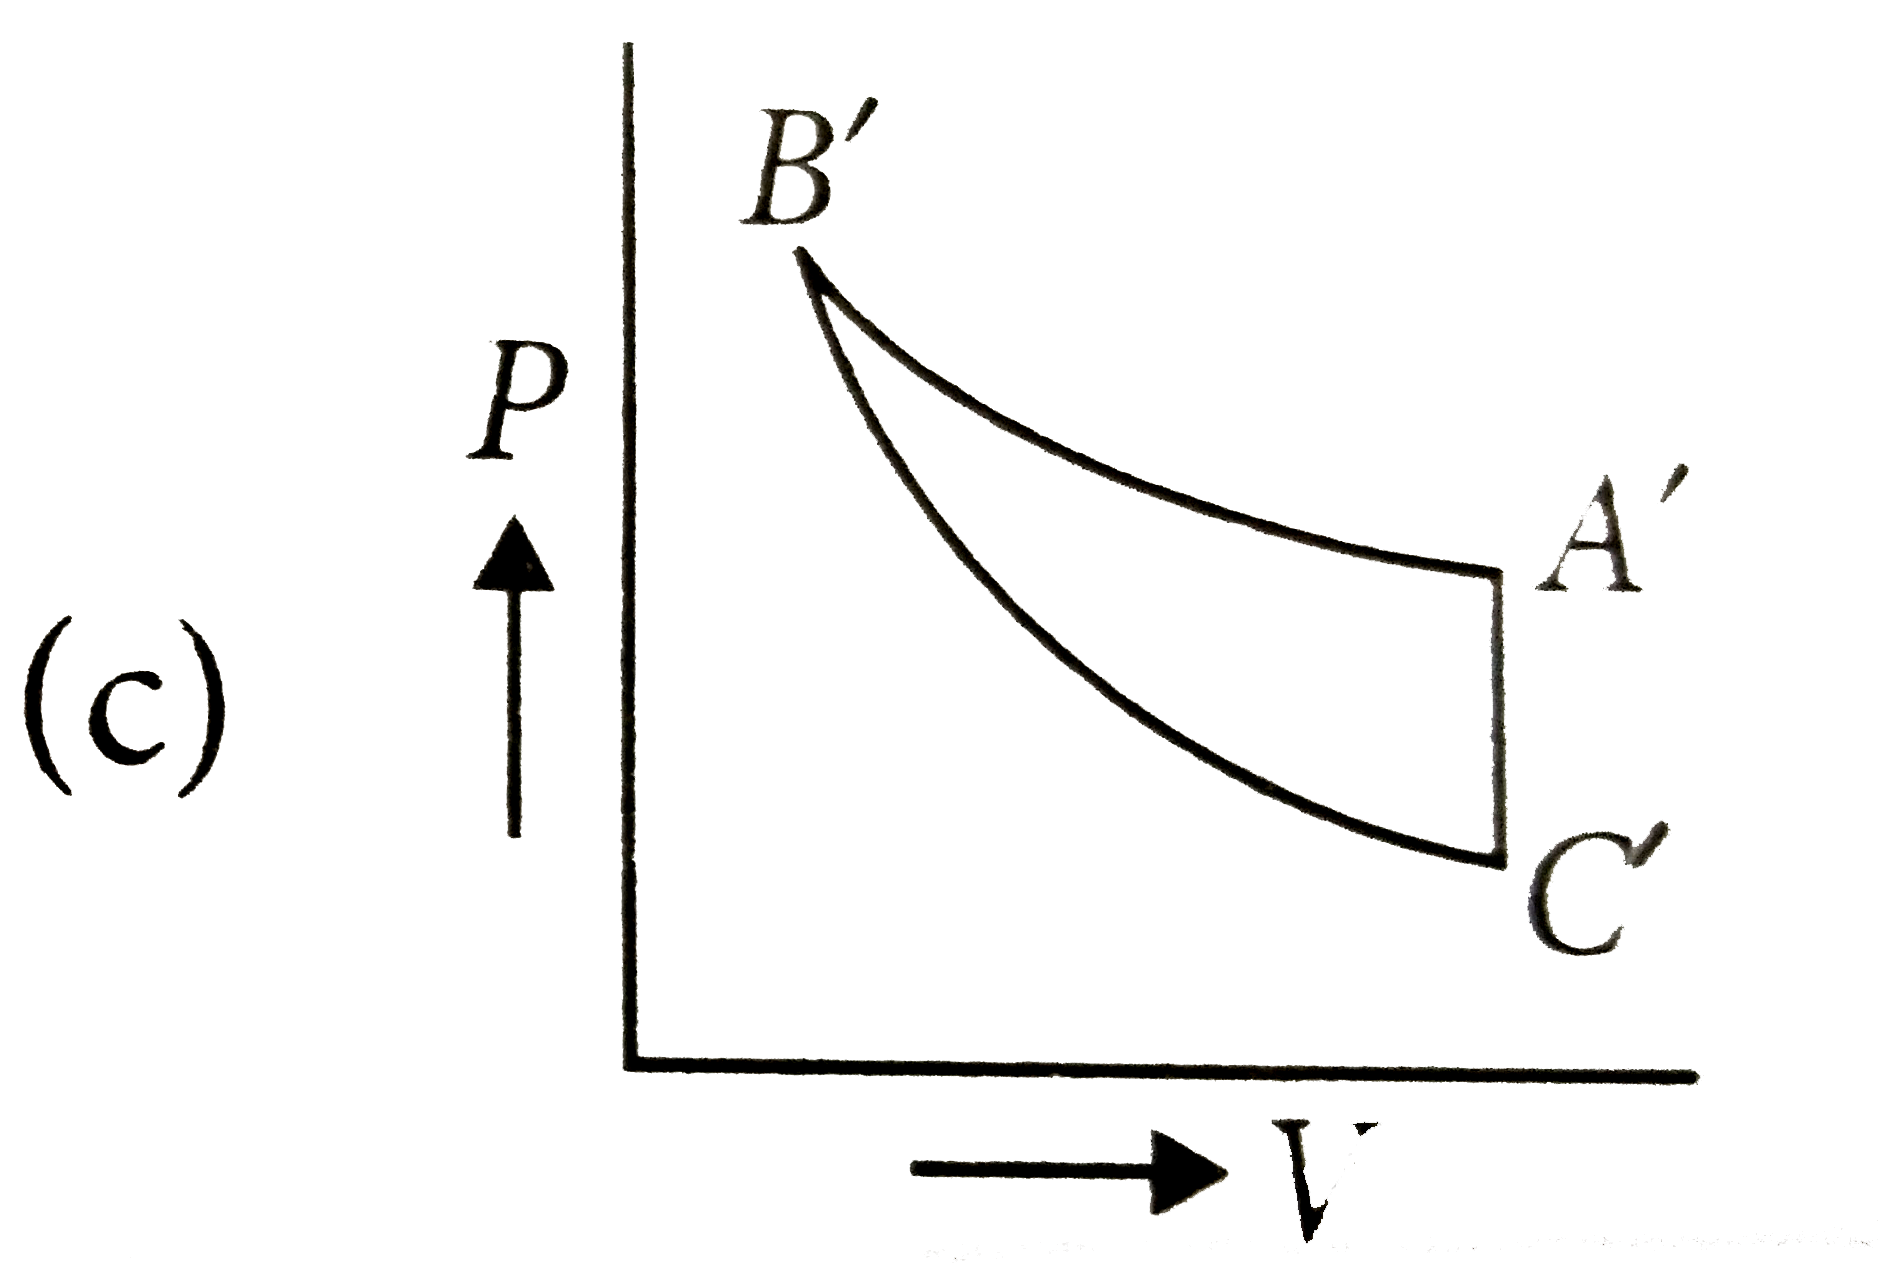 D
D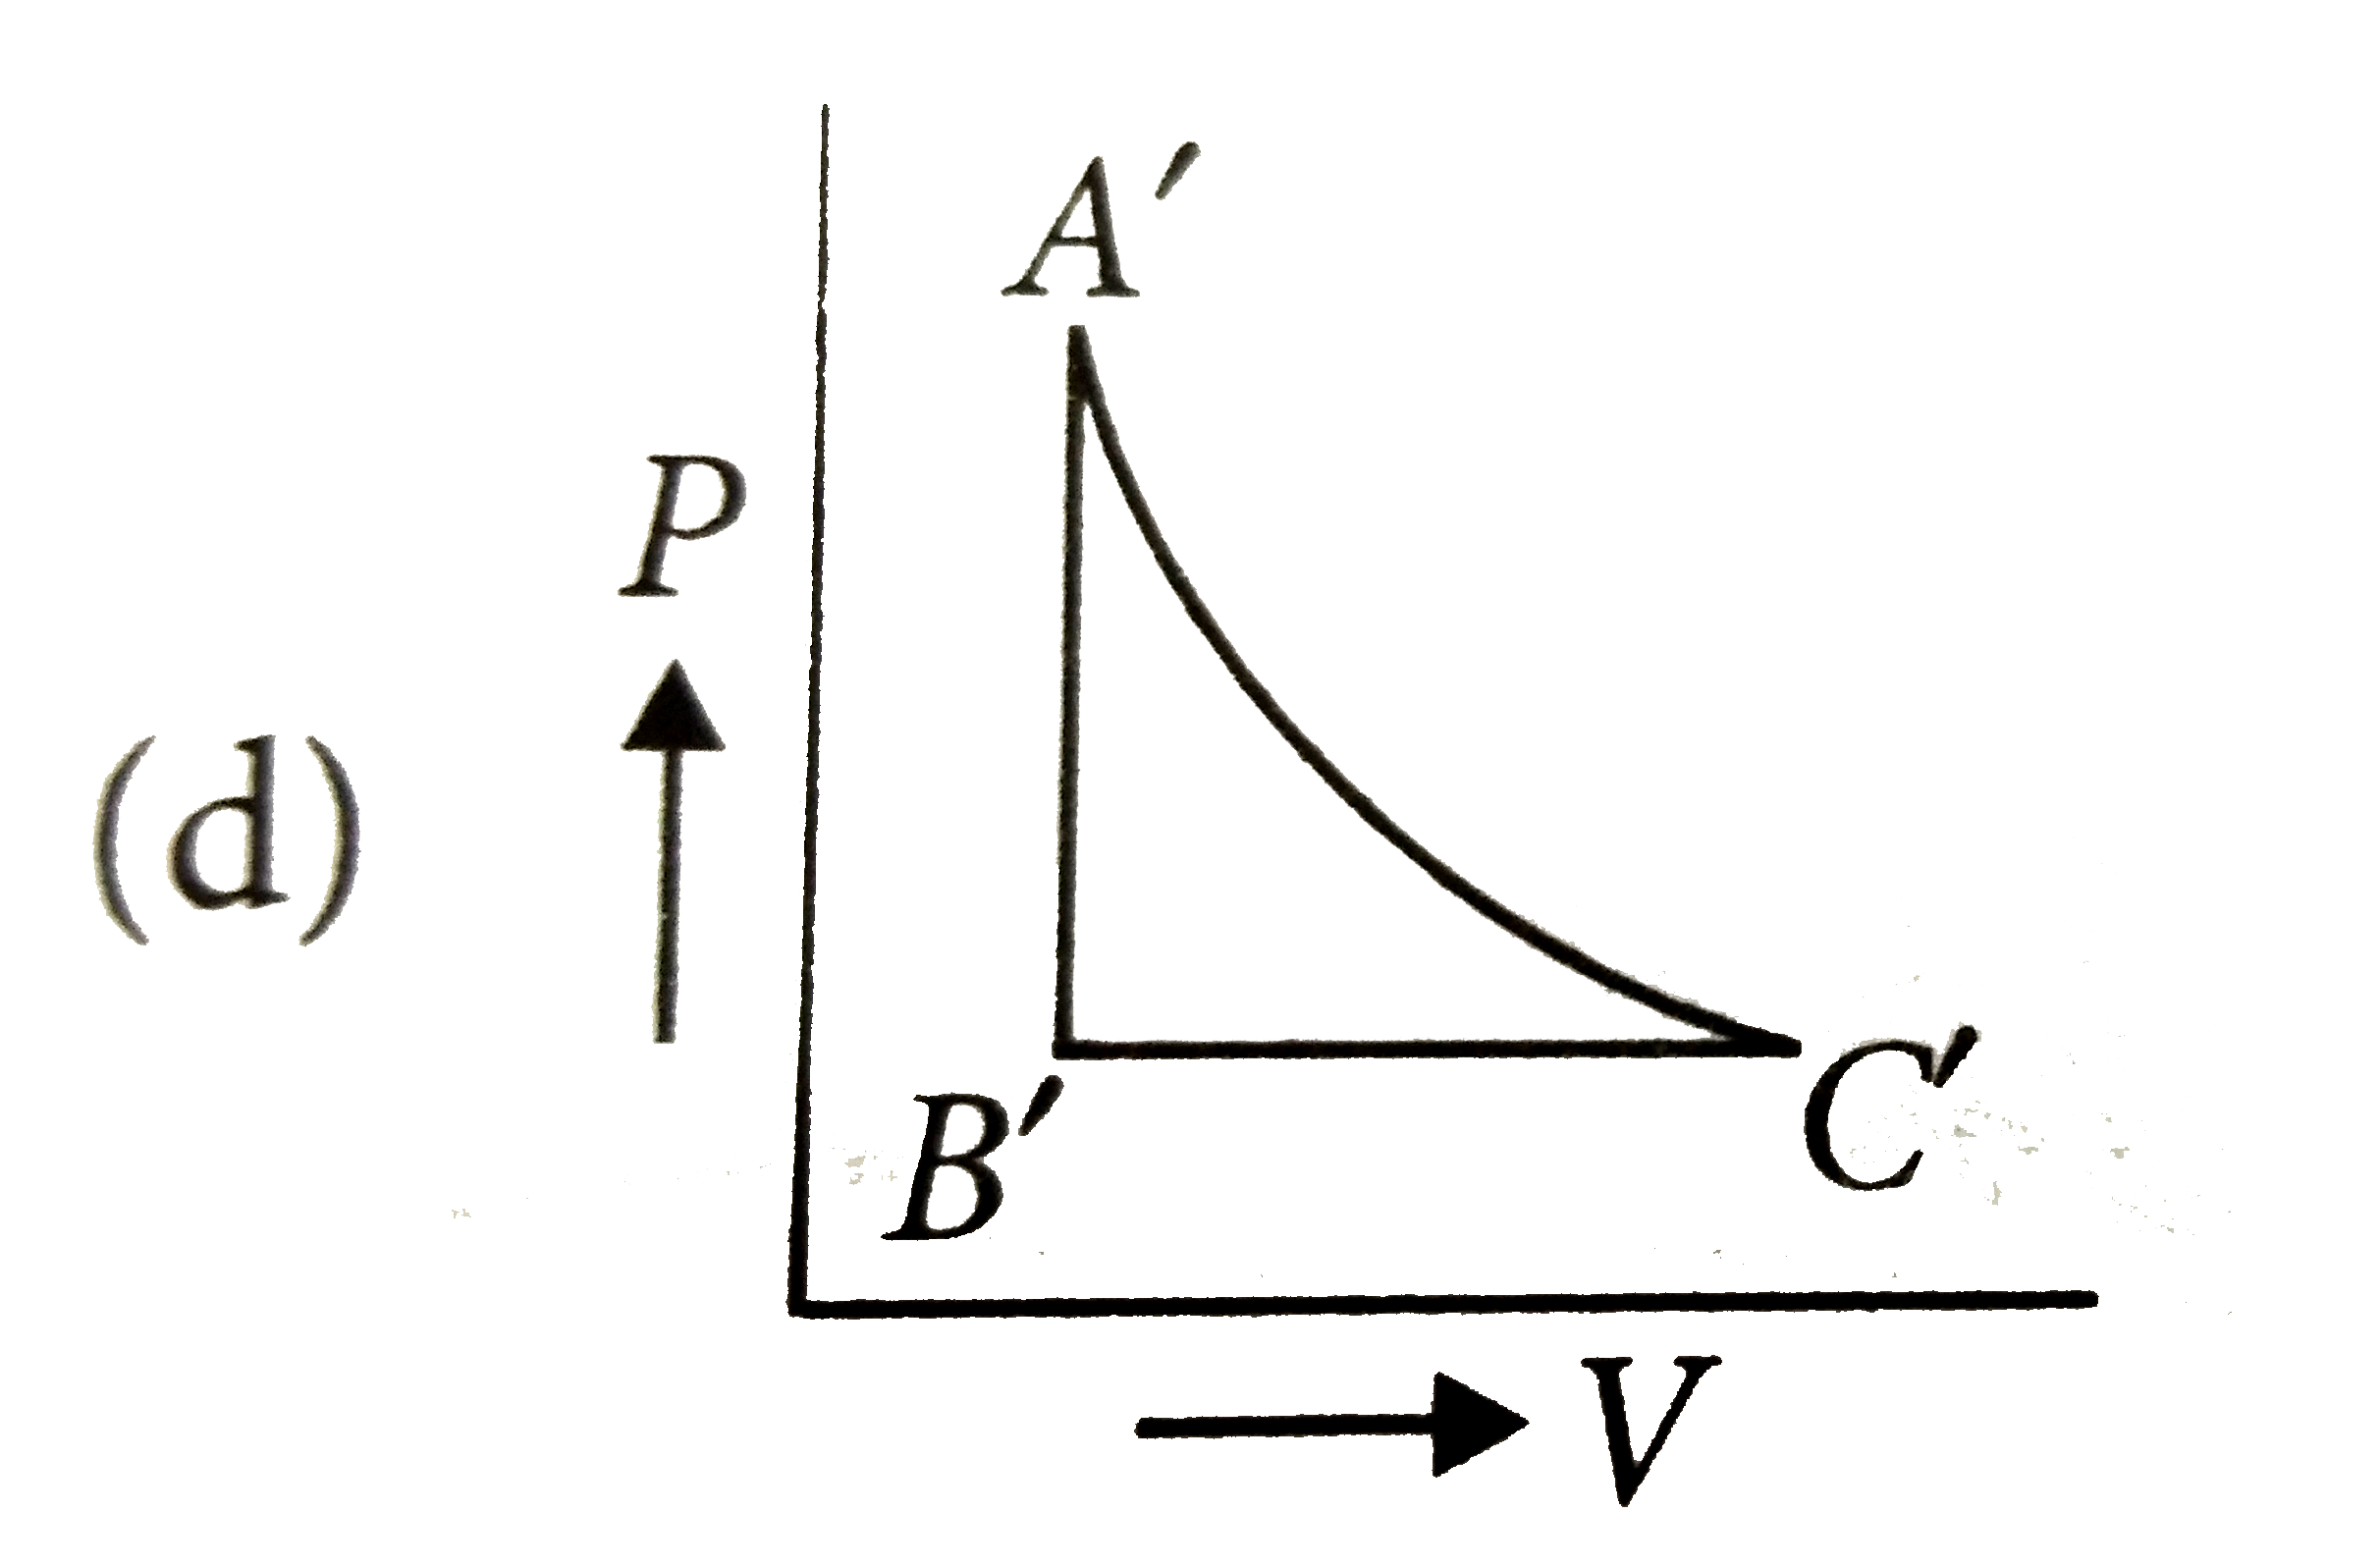
p−T curve for a cyclic process is as shown
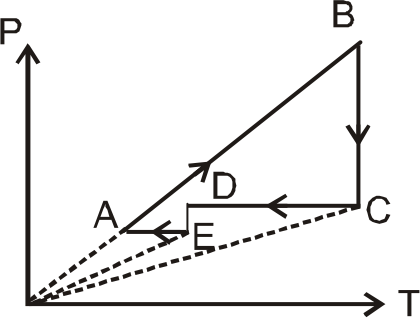
P−V graph for this process will be:
View SolutionAn ideal diatomic gas undergoes a thermodynamic process as shown in the P−V diagram. The process AB is isochoric while the process BC is isothermal. The total heat gein to the gas in the process is nearly (use ln2=0.7)
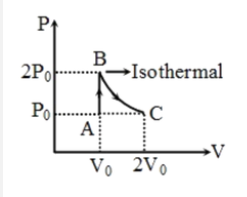
View Solution
Two moles of an ideal monoatomic gas is taken through a cyclic process as shown in the P-T diagram. In the process BC, PT−2= constant. Then the ratio of heat absorbed and heat released by the gas during the process AB and process BC respectively is.
View SolutionA gas is taken through a cyclic process ABCA as shown in, if 2.4 cal of heat is given in the process, what is the value of J ?
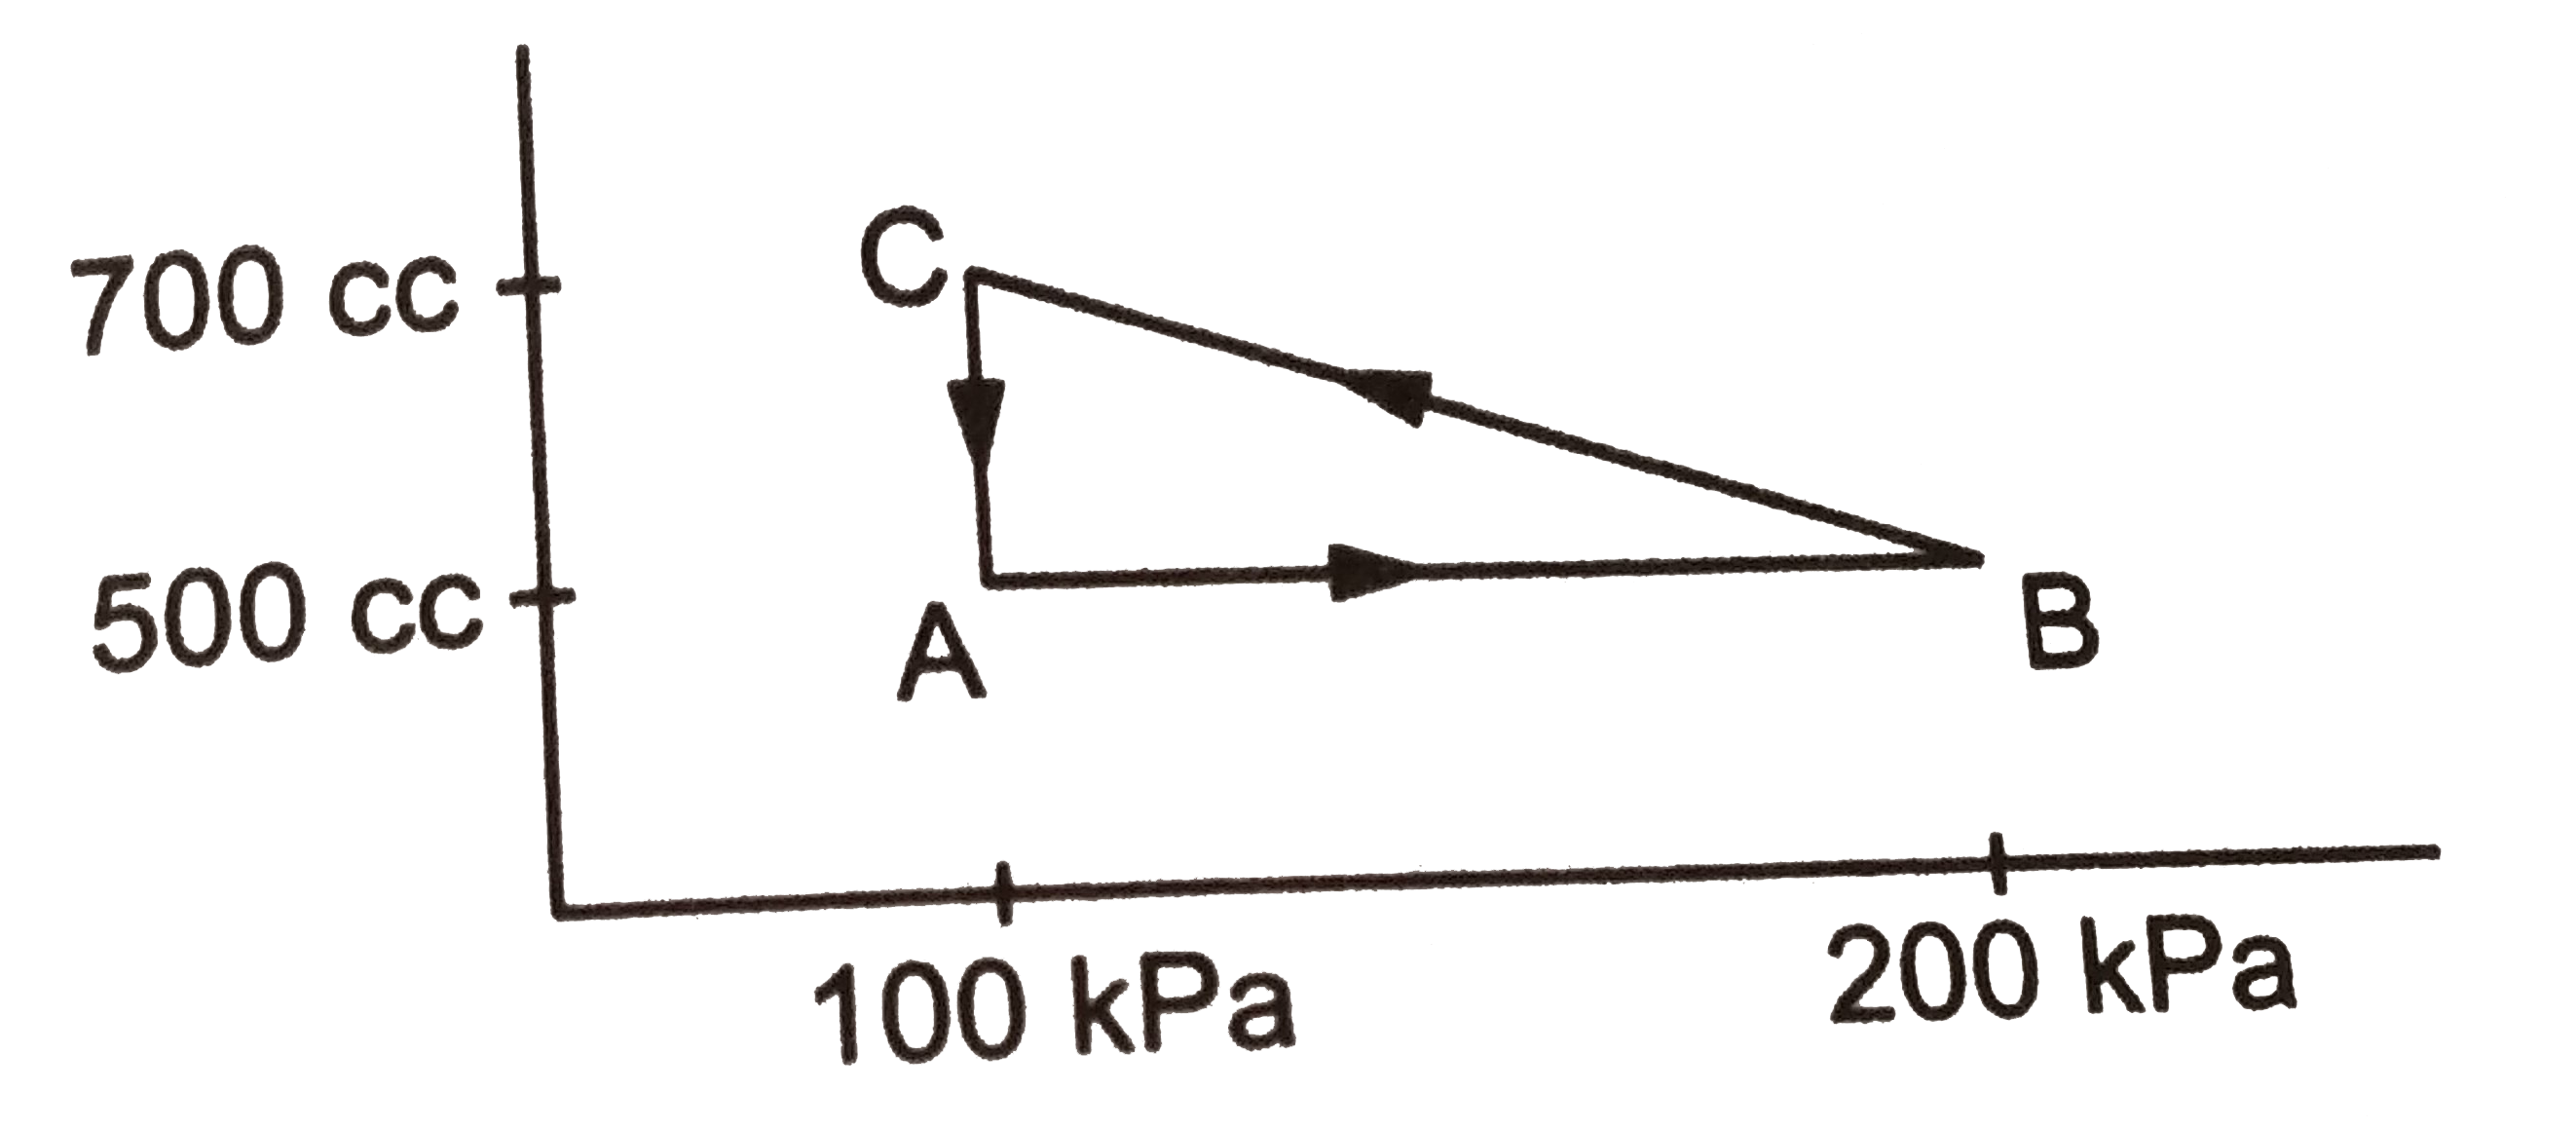
View SolutionA gas is taken through a cyclic process ABCA as shown in, if 2.4cal of heat is given in the process, what is the value of J ?

View SolutionTwo moles of an ideal gas are undergone a cyclic process 1-2-3-1. If net heat exchange in the process is 300J, the work done by the gas in the process 2-3 is
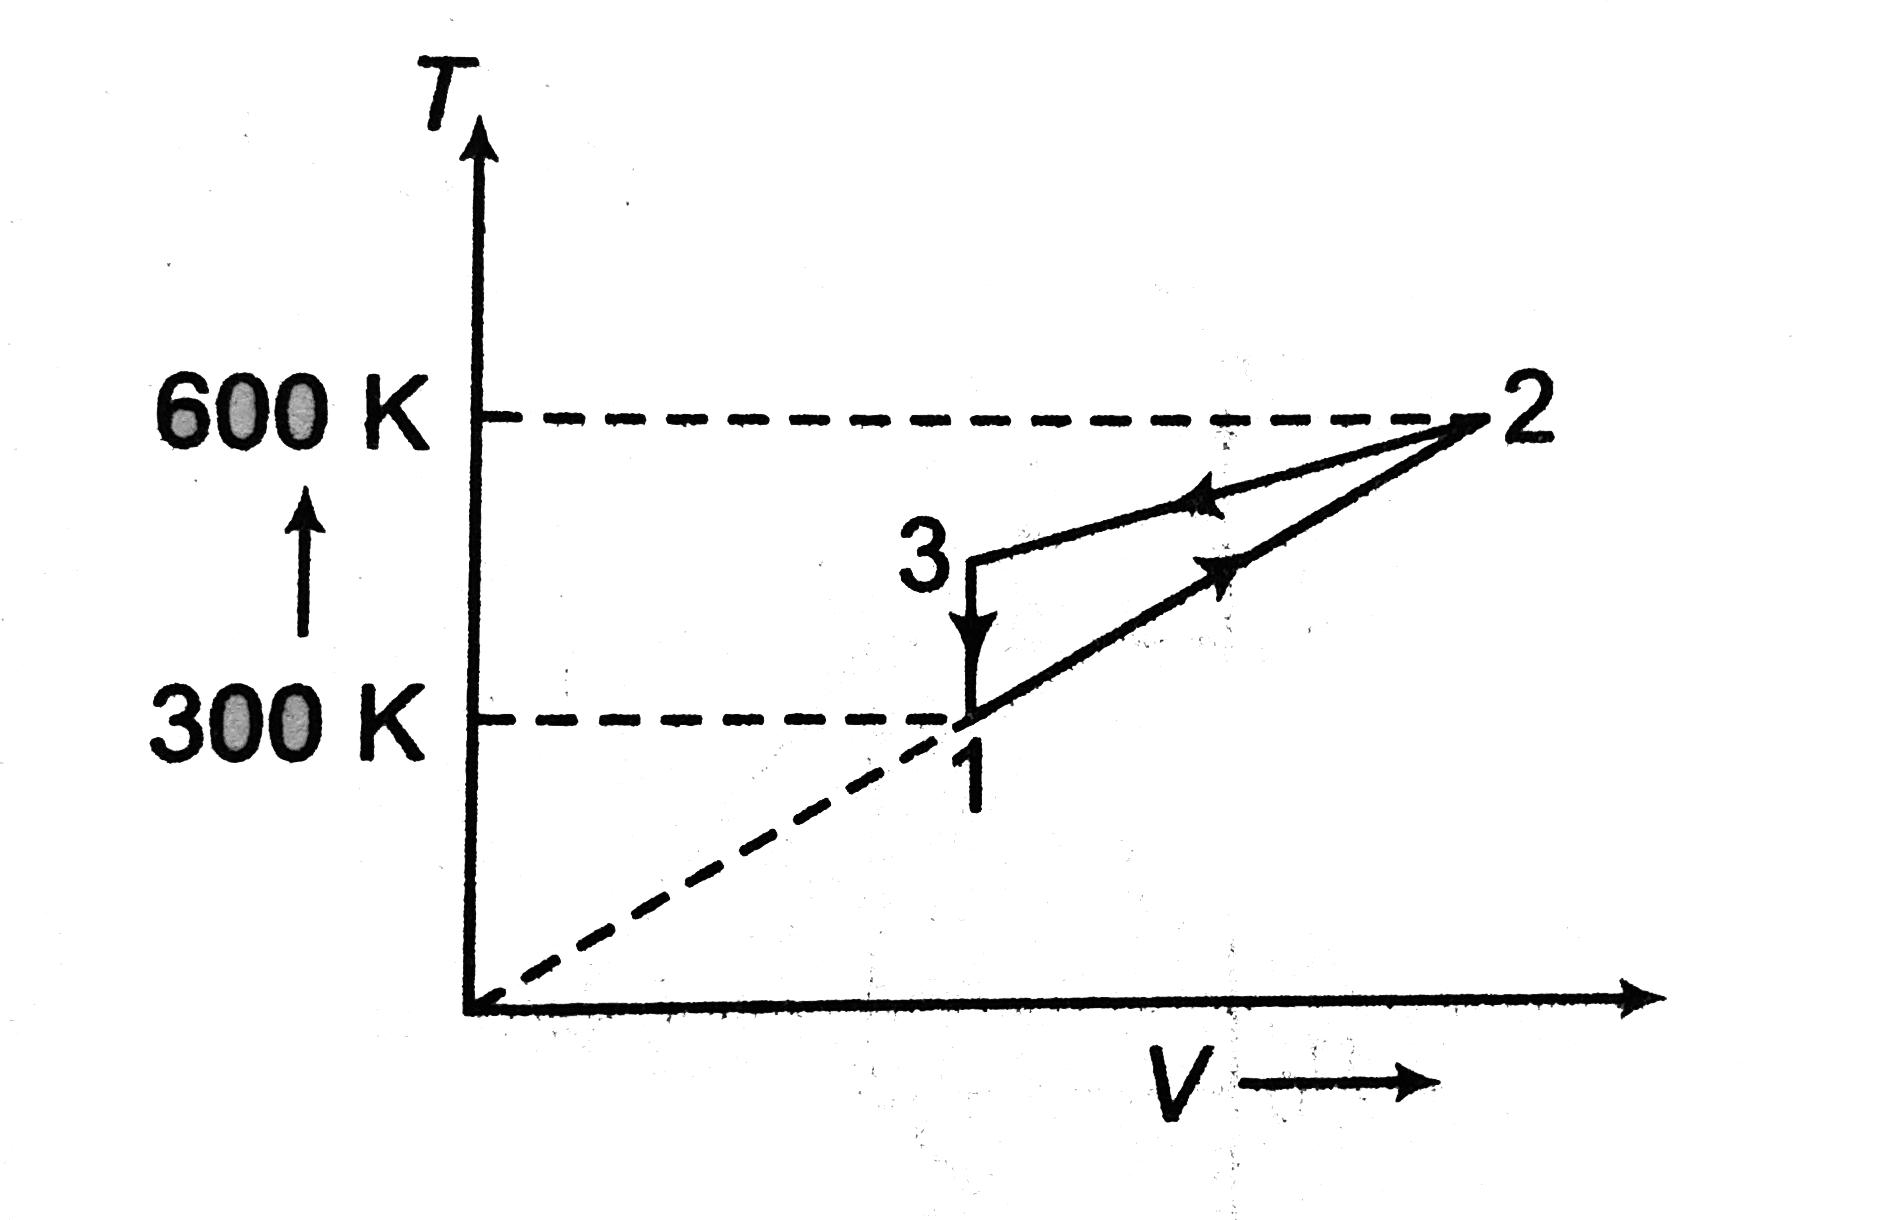
View Solution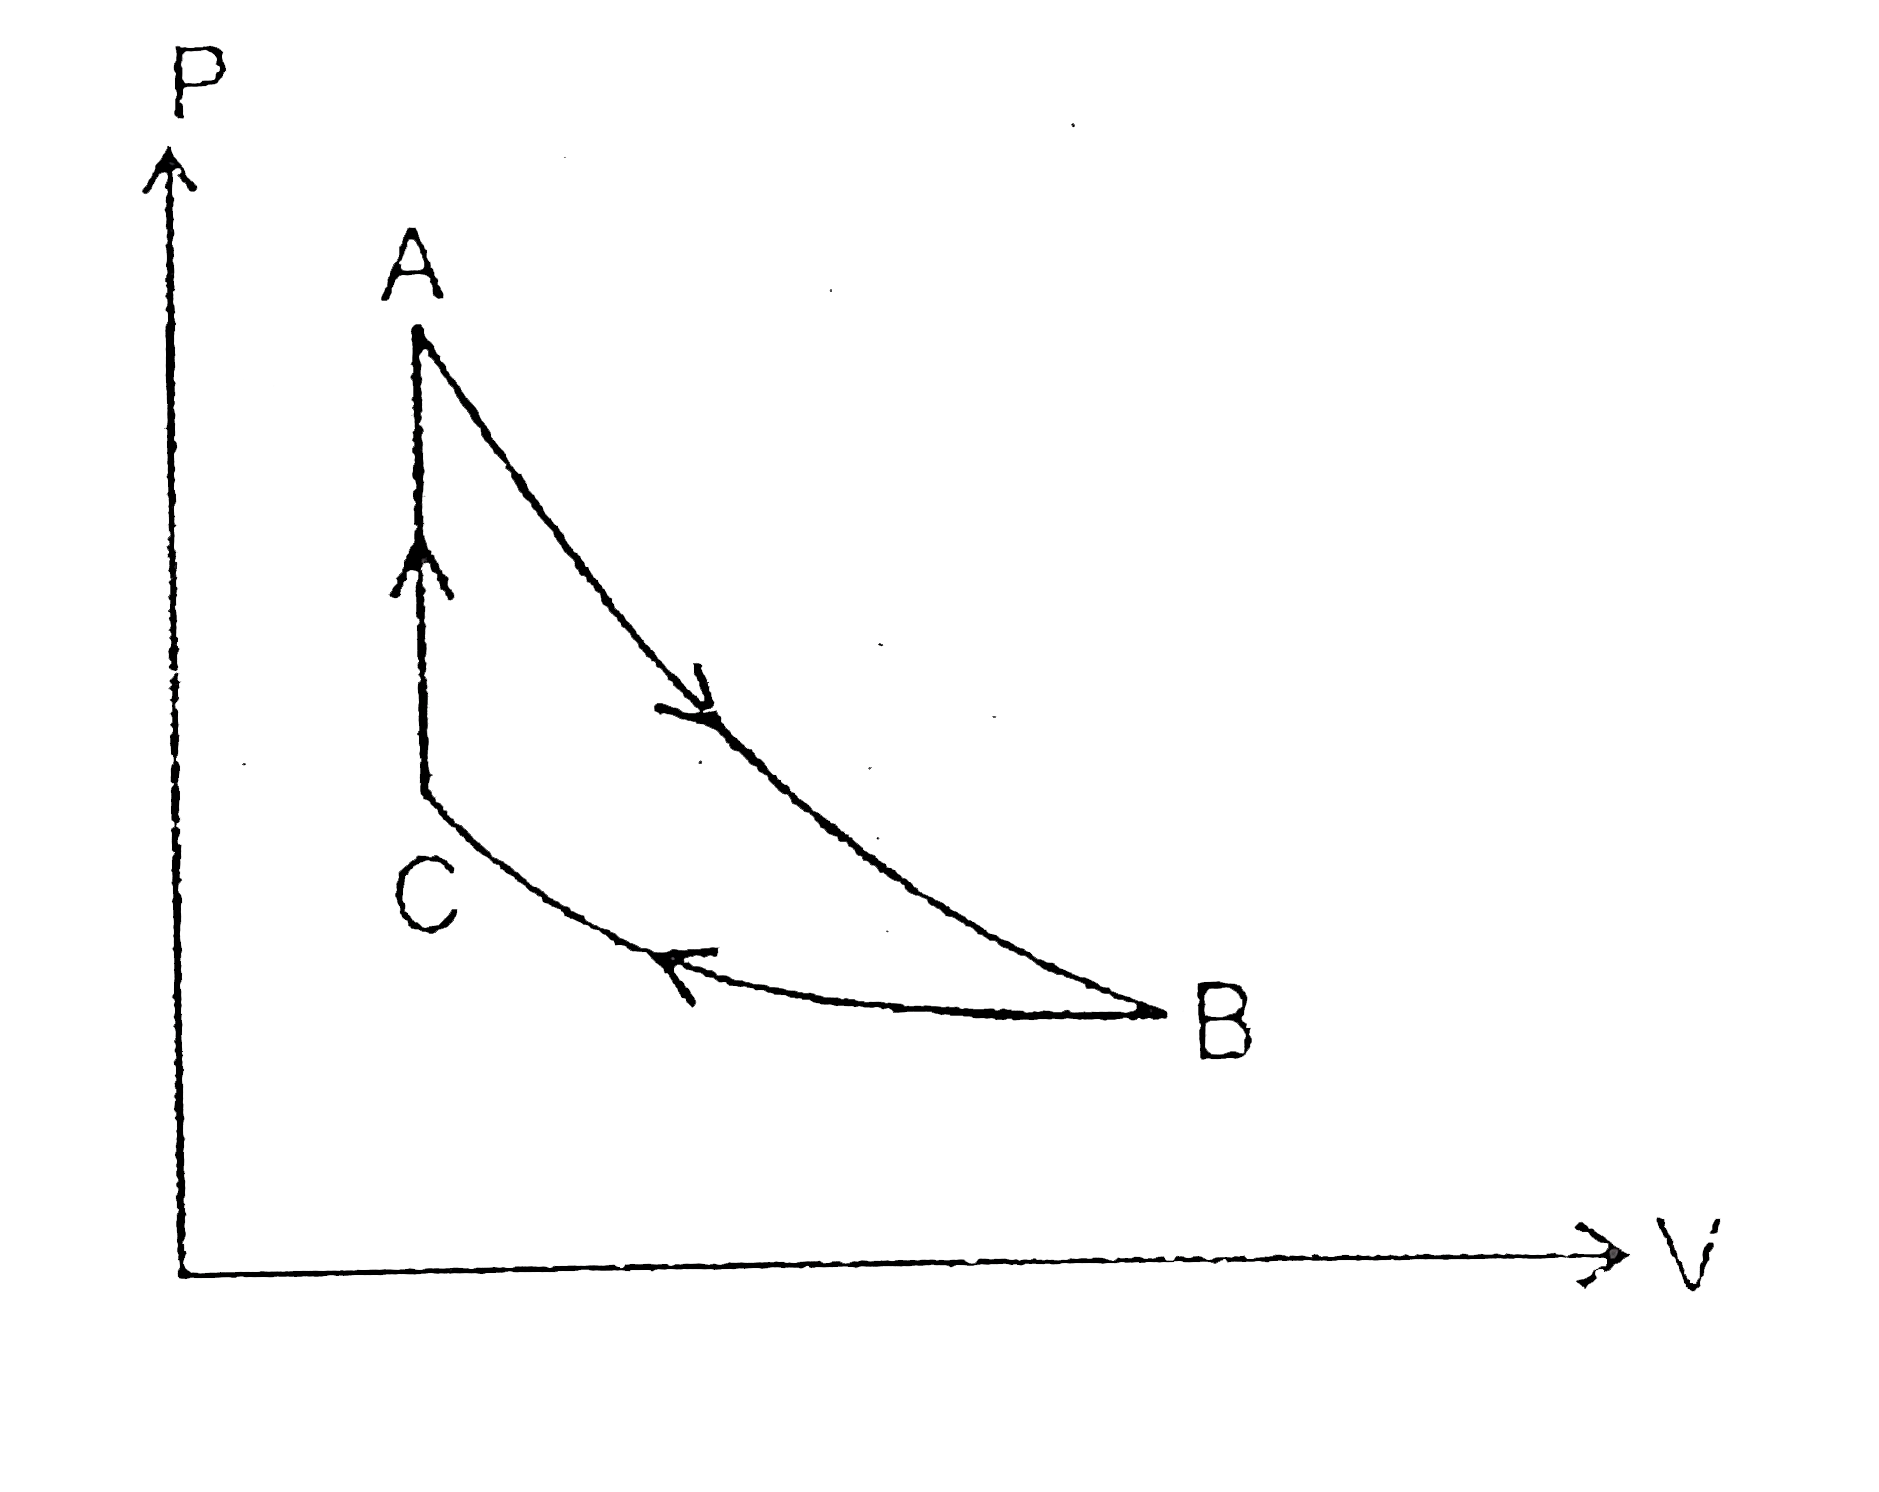
An ideal gas undergoes a cyclic process, in which one process is isochoric, one process is isothermal and one process is adiabatic. During the isothermal process, 40 J heat is released by the gas, and during the isochoric process, 80 J heat is absorbed by the gas. if work done by the gas during adiabatic process is W1 and during isothermal process is W2 then the magnitude of W1W2 will be equal to:
View Solution

