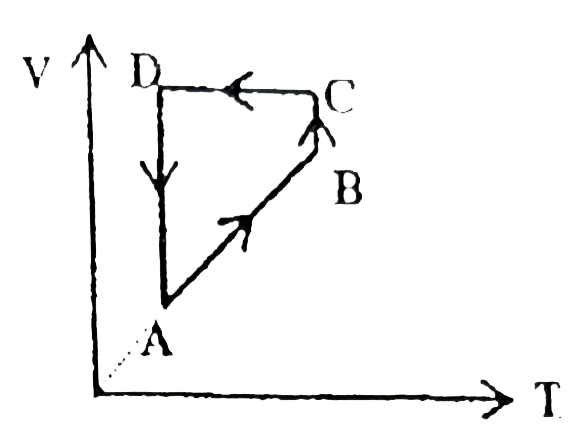
A sample of ideal gas is taken through the cyclic process shown in the figure. The temerauture of the gas in state A is =200 K. In states B and C the temperature of the gas is the same.
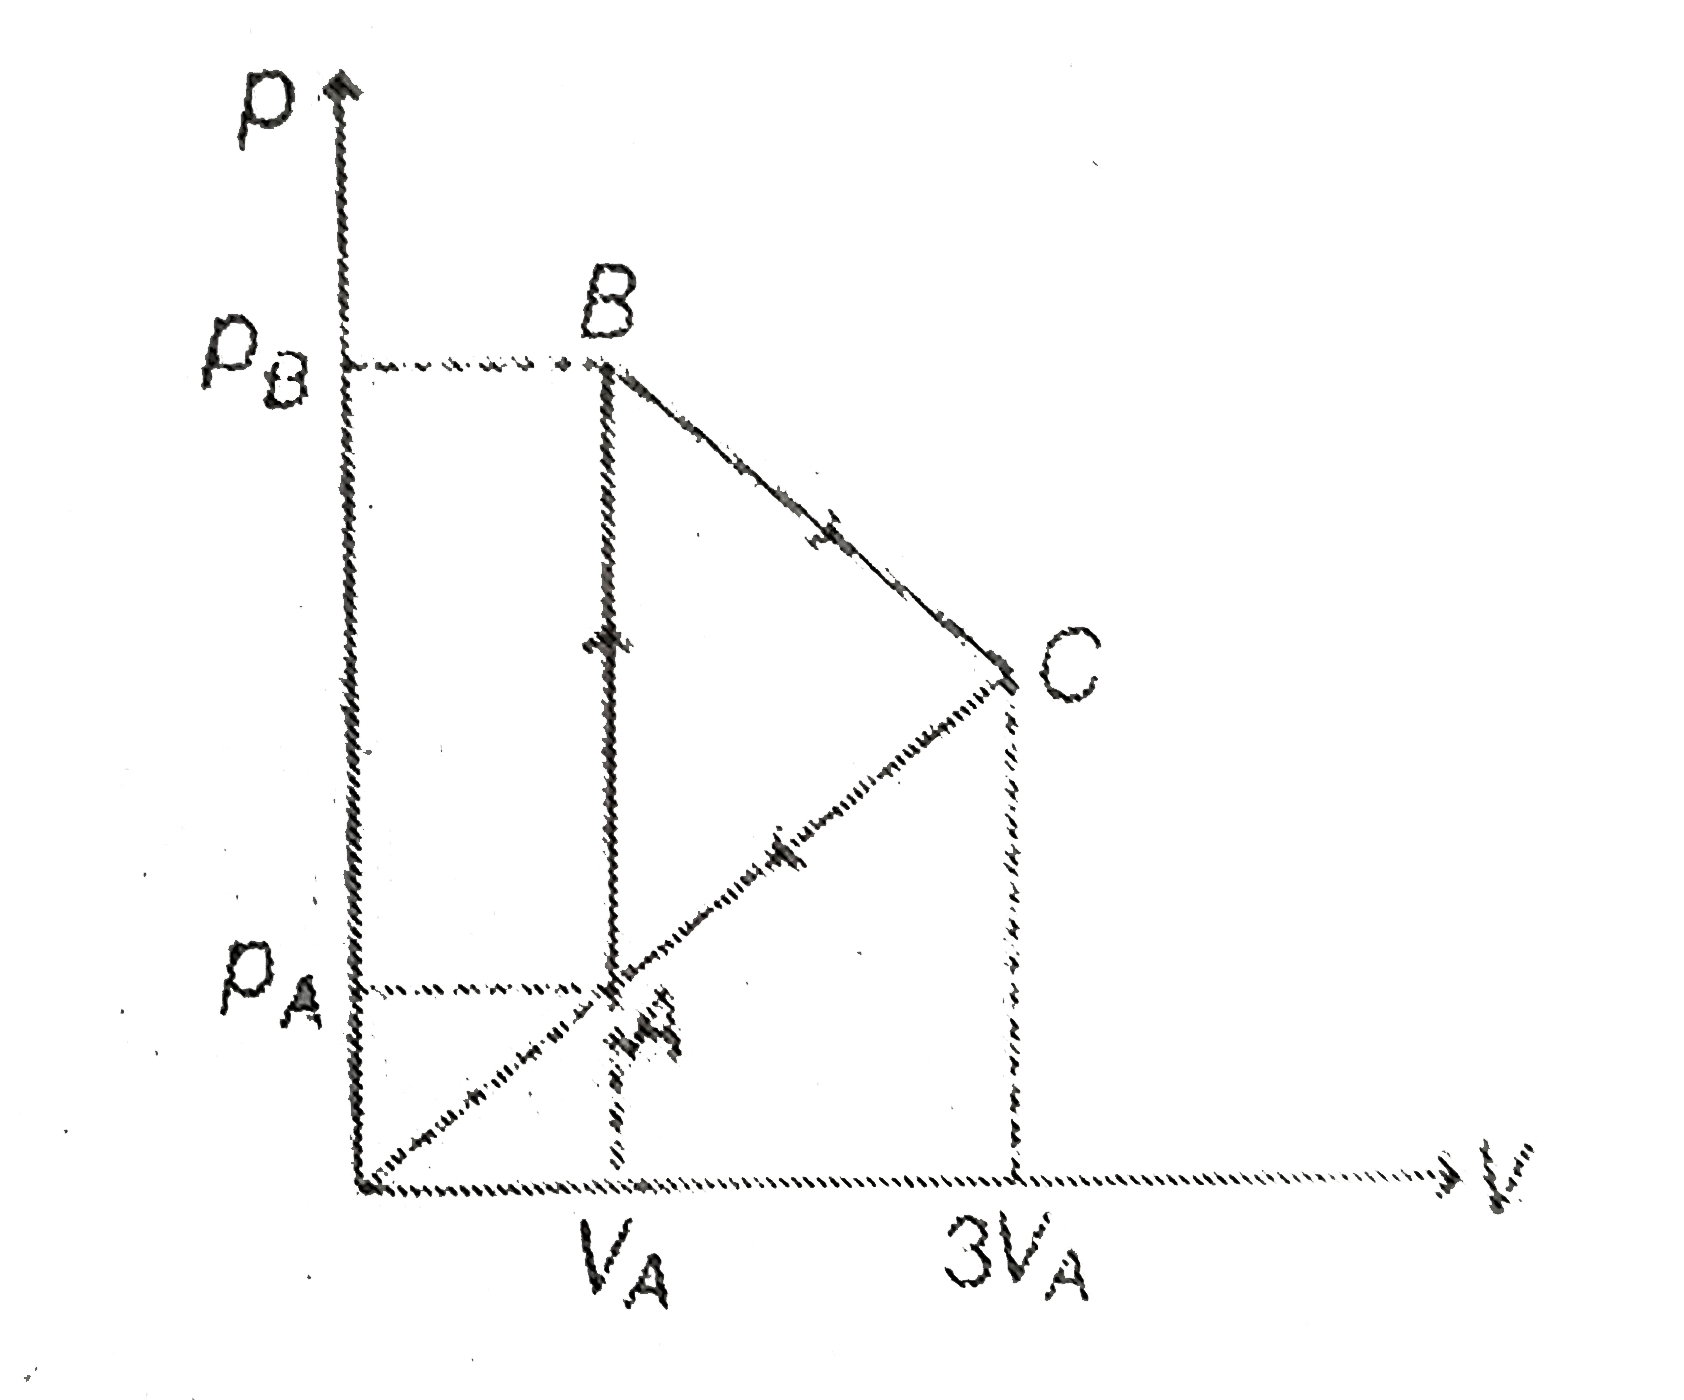
Which of the following graphs best reprsent the cyclic process in T-V diagram
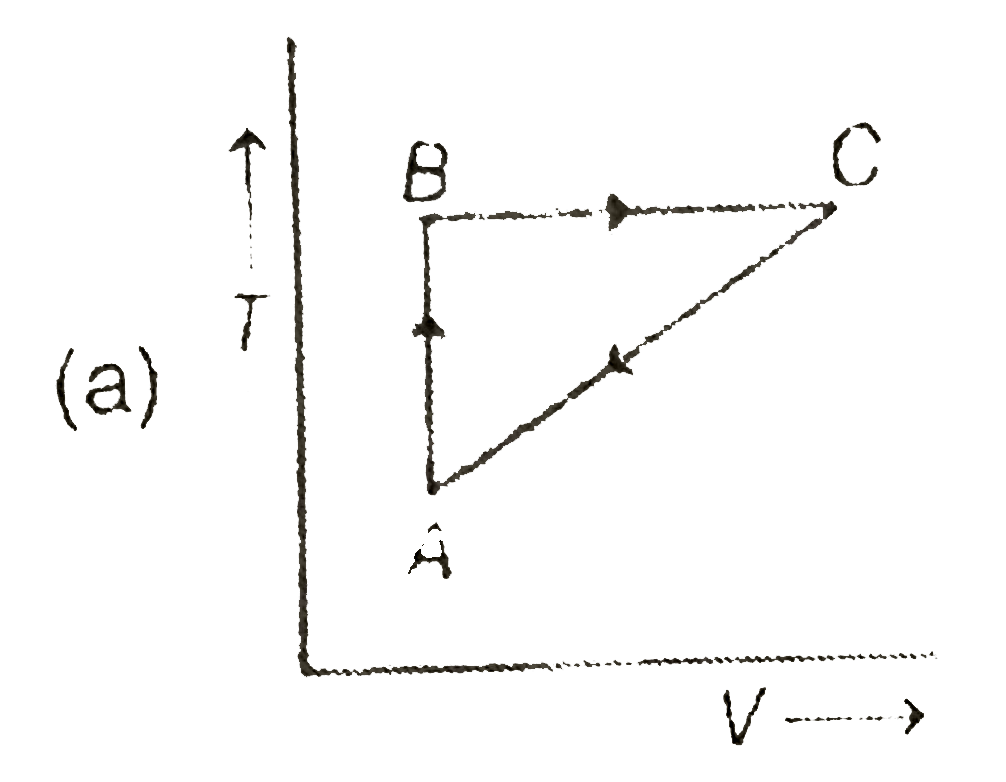
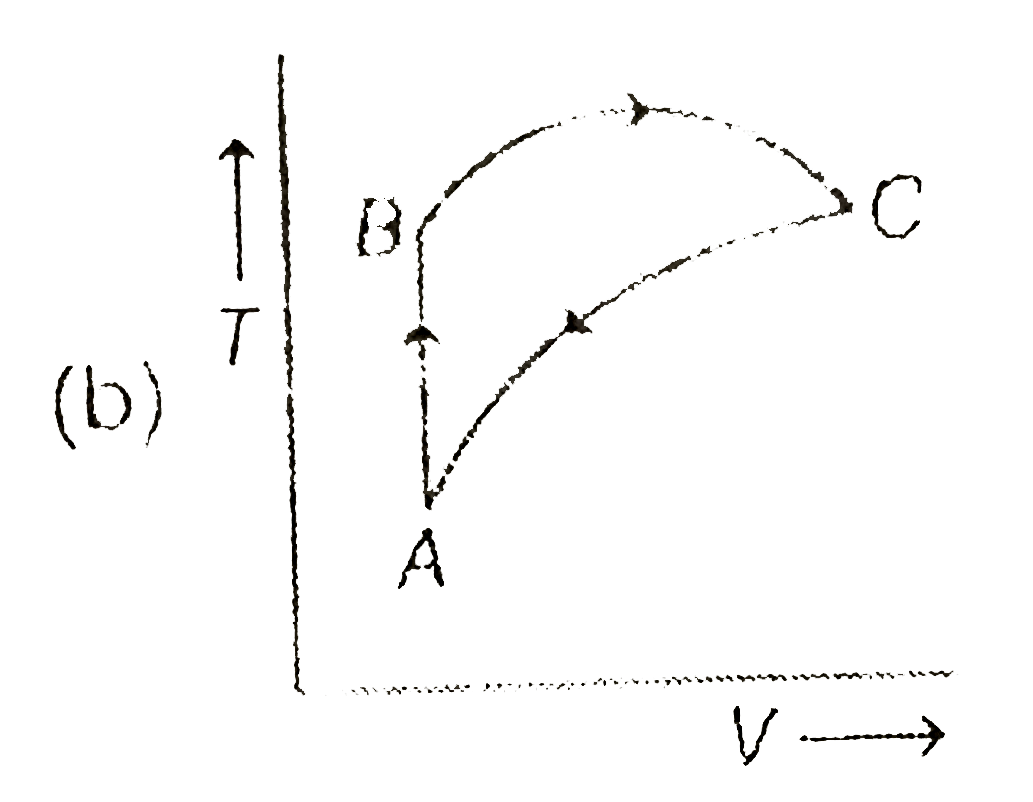
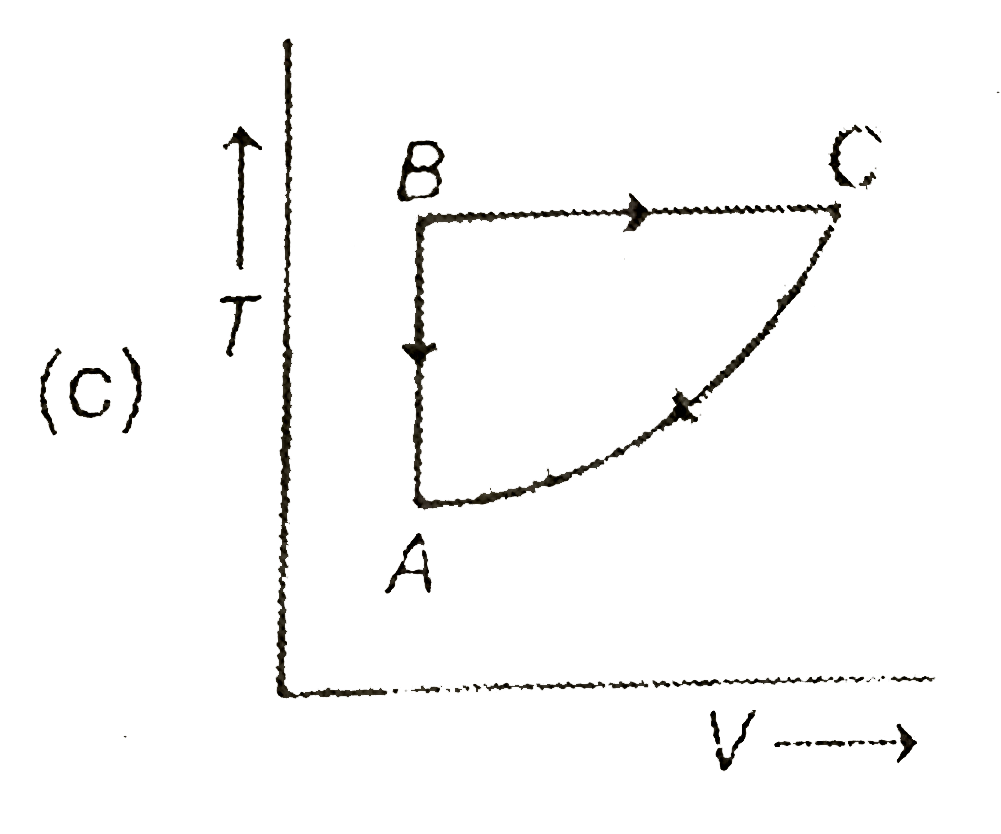
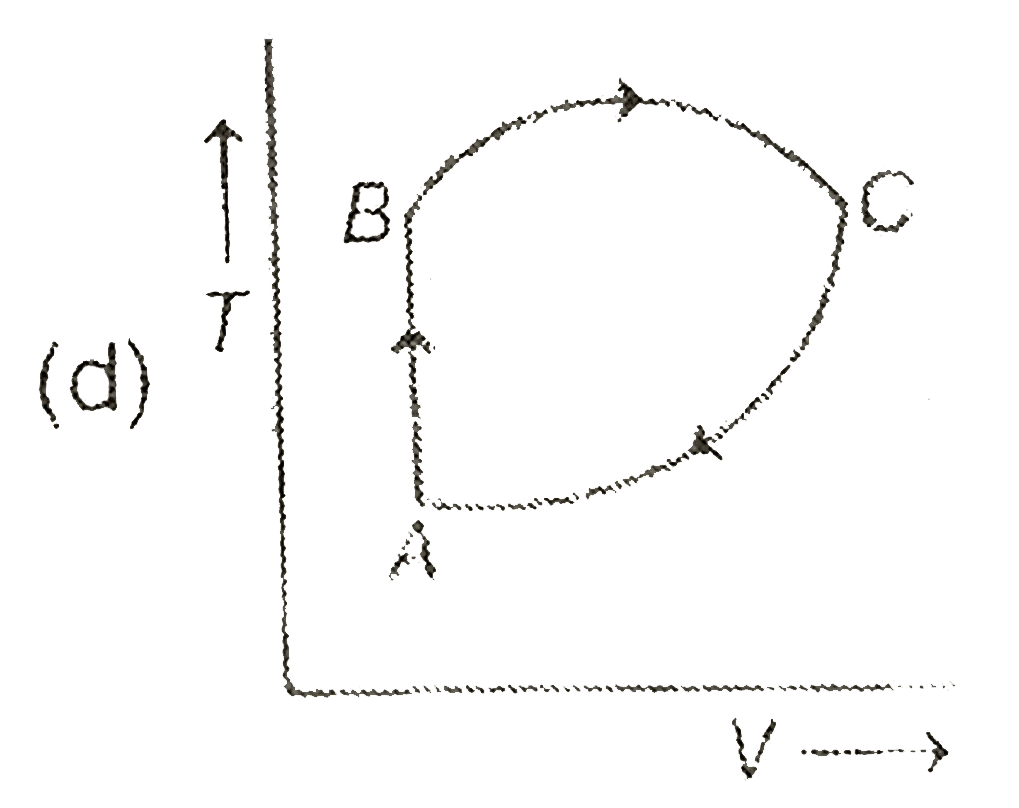
The correct Answer is:D
Step by step video & image solution for A sample of ideal gas is taken through the cyclic process shown in the figure. The temerauture of the gas in state A is T_(A) =200 K. In states B and C the temperature of the gas is the same. Which of the following graphs best reprsent the cyclic process in T-V diagram by Physics experts to help you in doubts & scoring excellent marks in Class 11 exams.
Updated on:21/07/2023Topper's Solved these Questions
Similar Questions
A sample of ideal gas is taken through the cyclic process shown in the figure. The temerauture of the gas in state A is TA =200 K. In states B and C the temperature of the gas is the same.
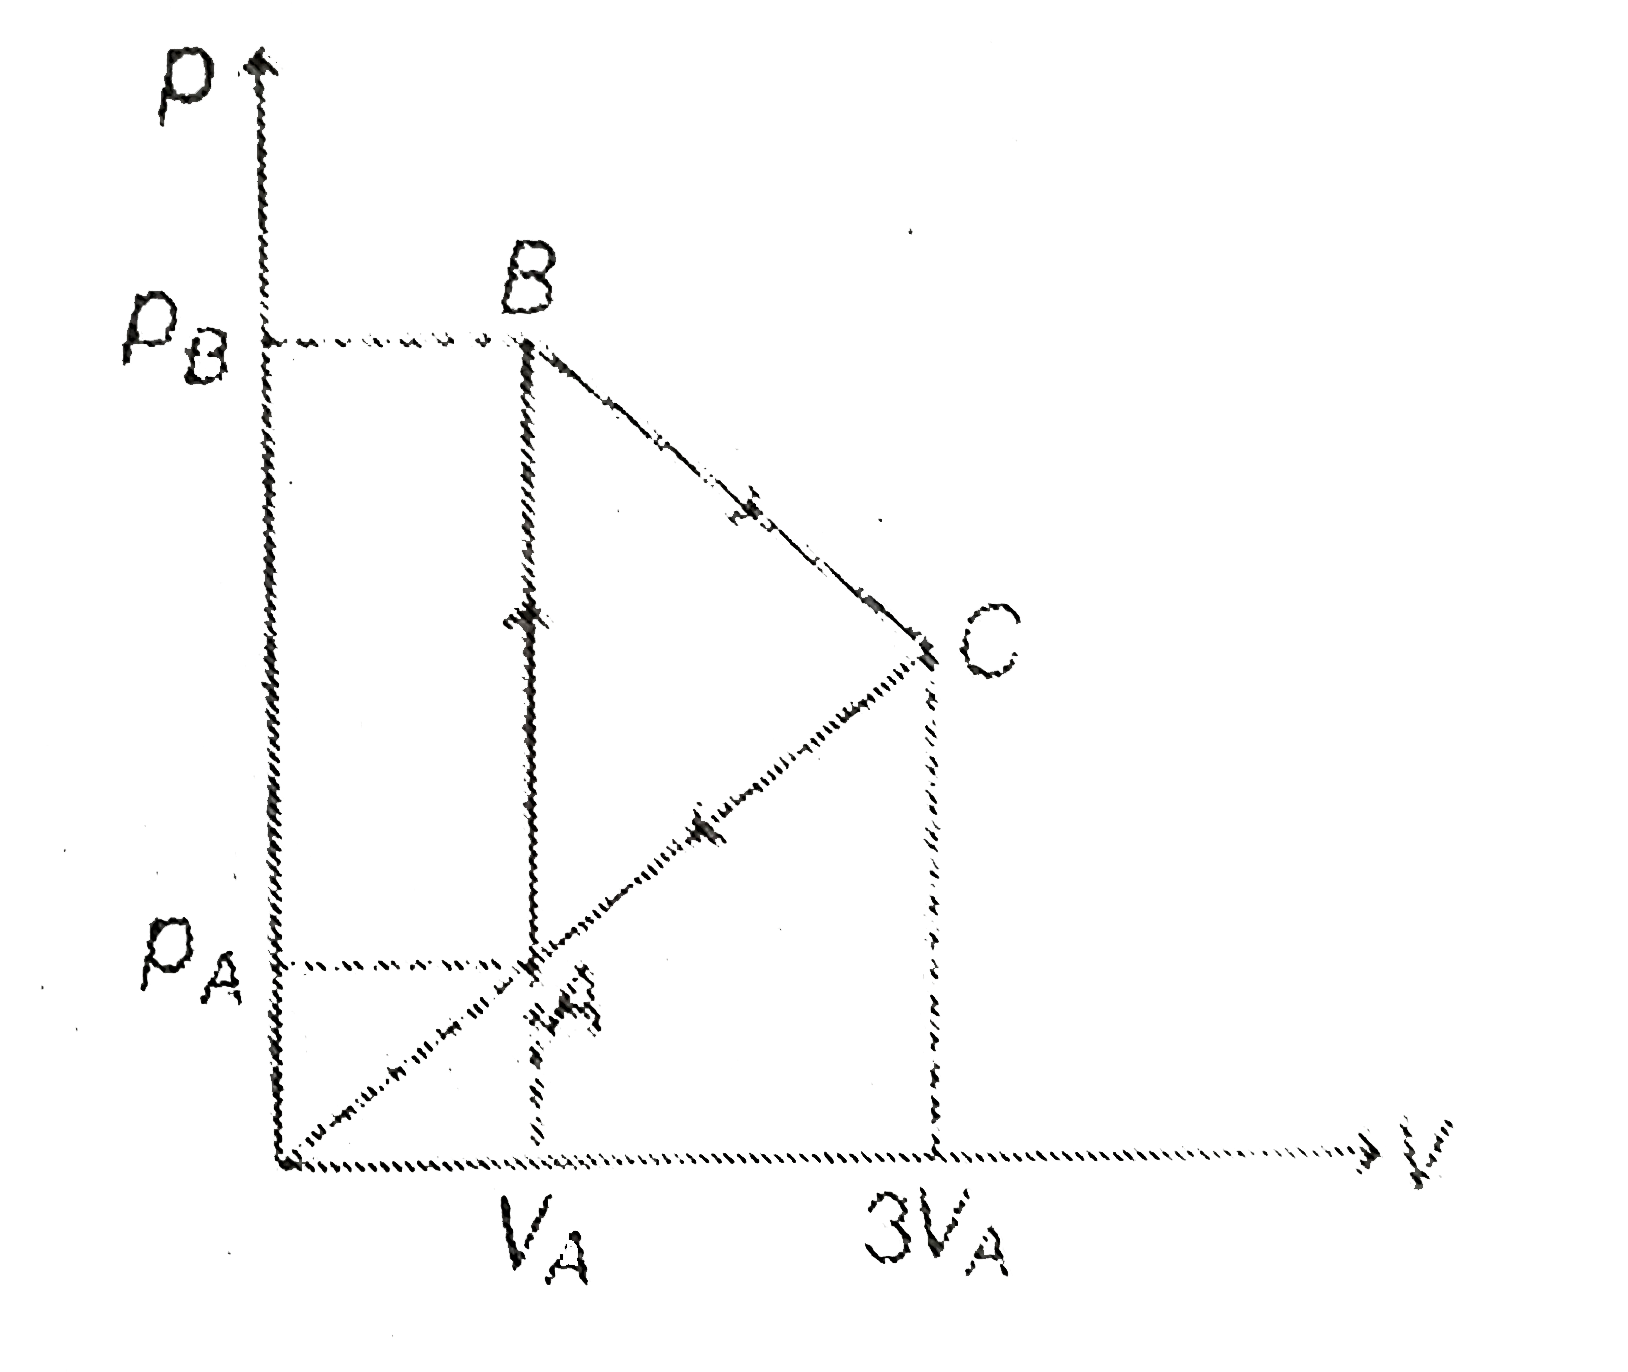
Net work done by the gas in the process is
View SolutionIdeal gas is taken through the process shown in the figure :
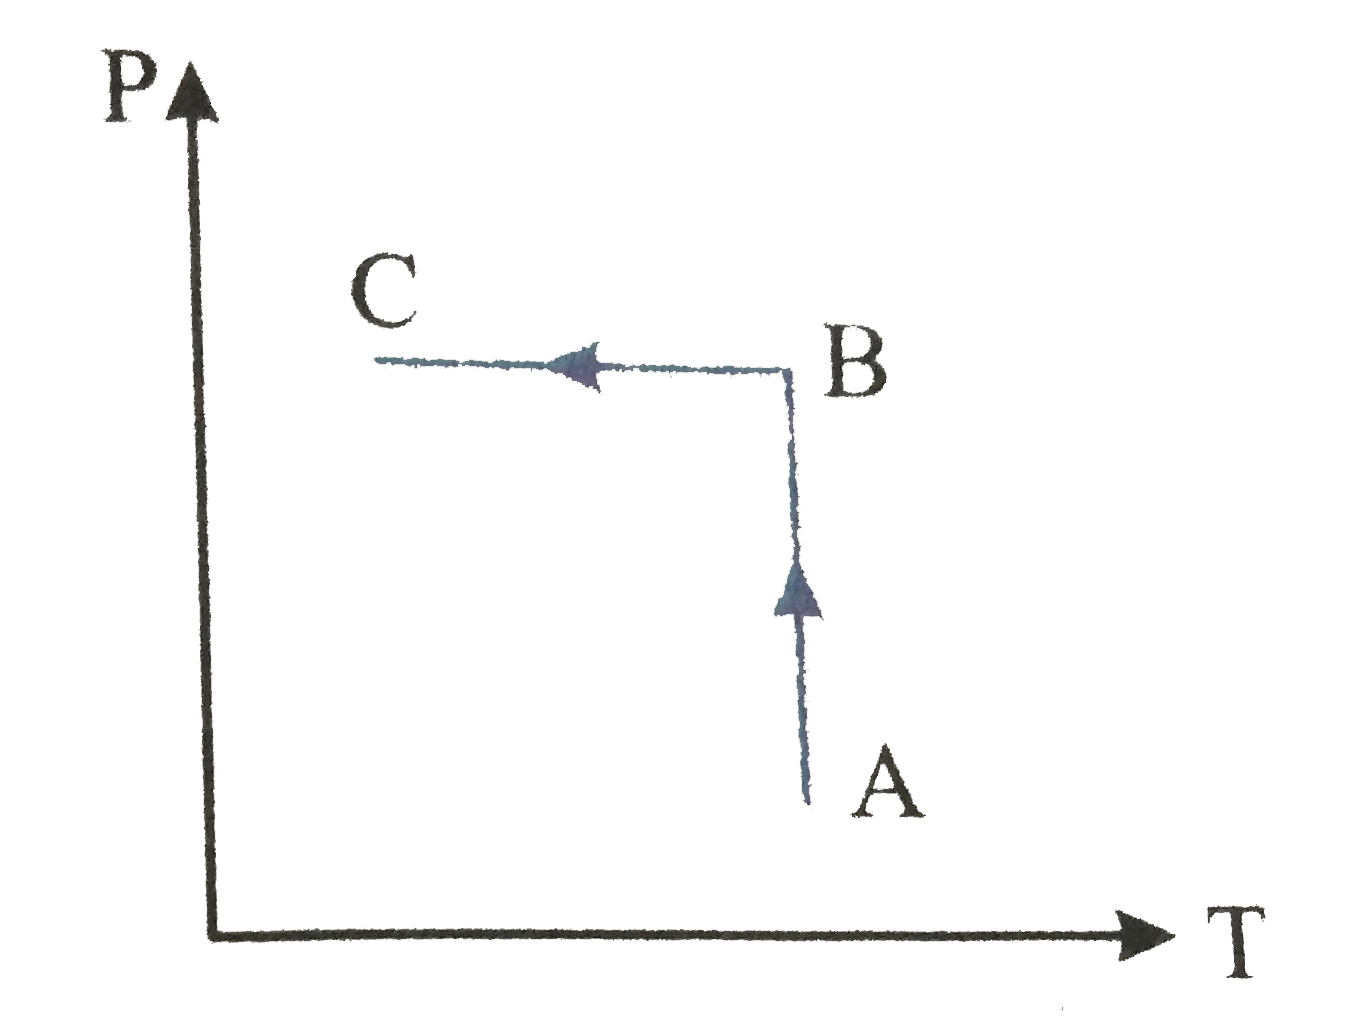
View SolutionIdeal gas is taken through the process shown in the figure :

View SolutionA sample of gas is going through cyclic process, work done by gas is
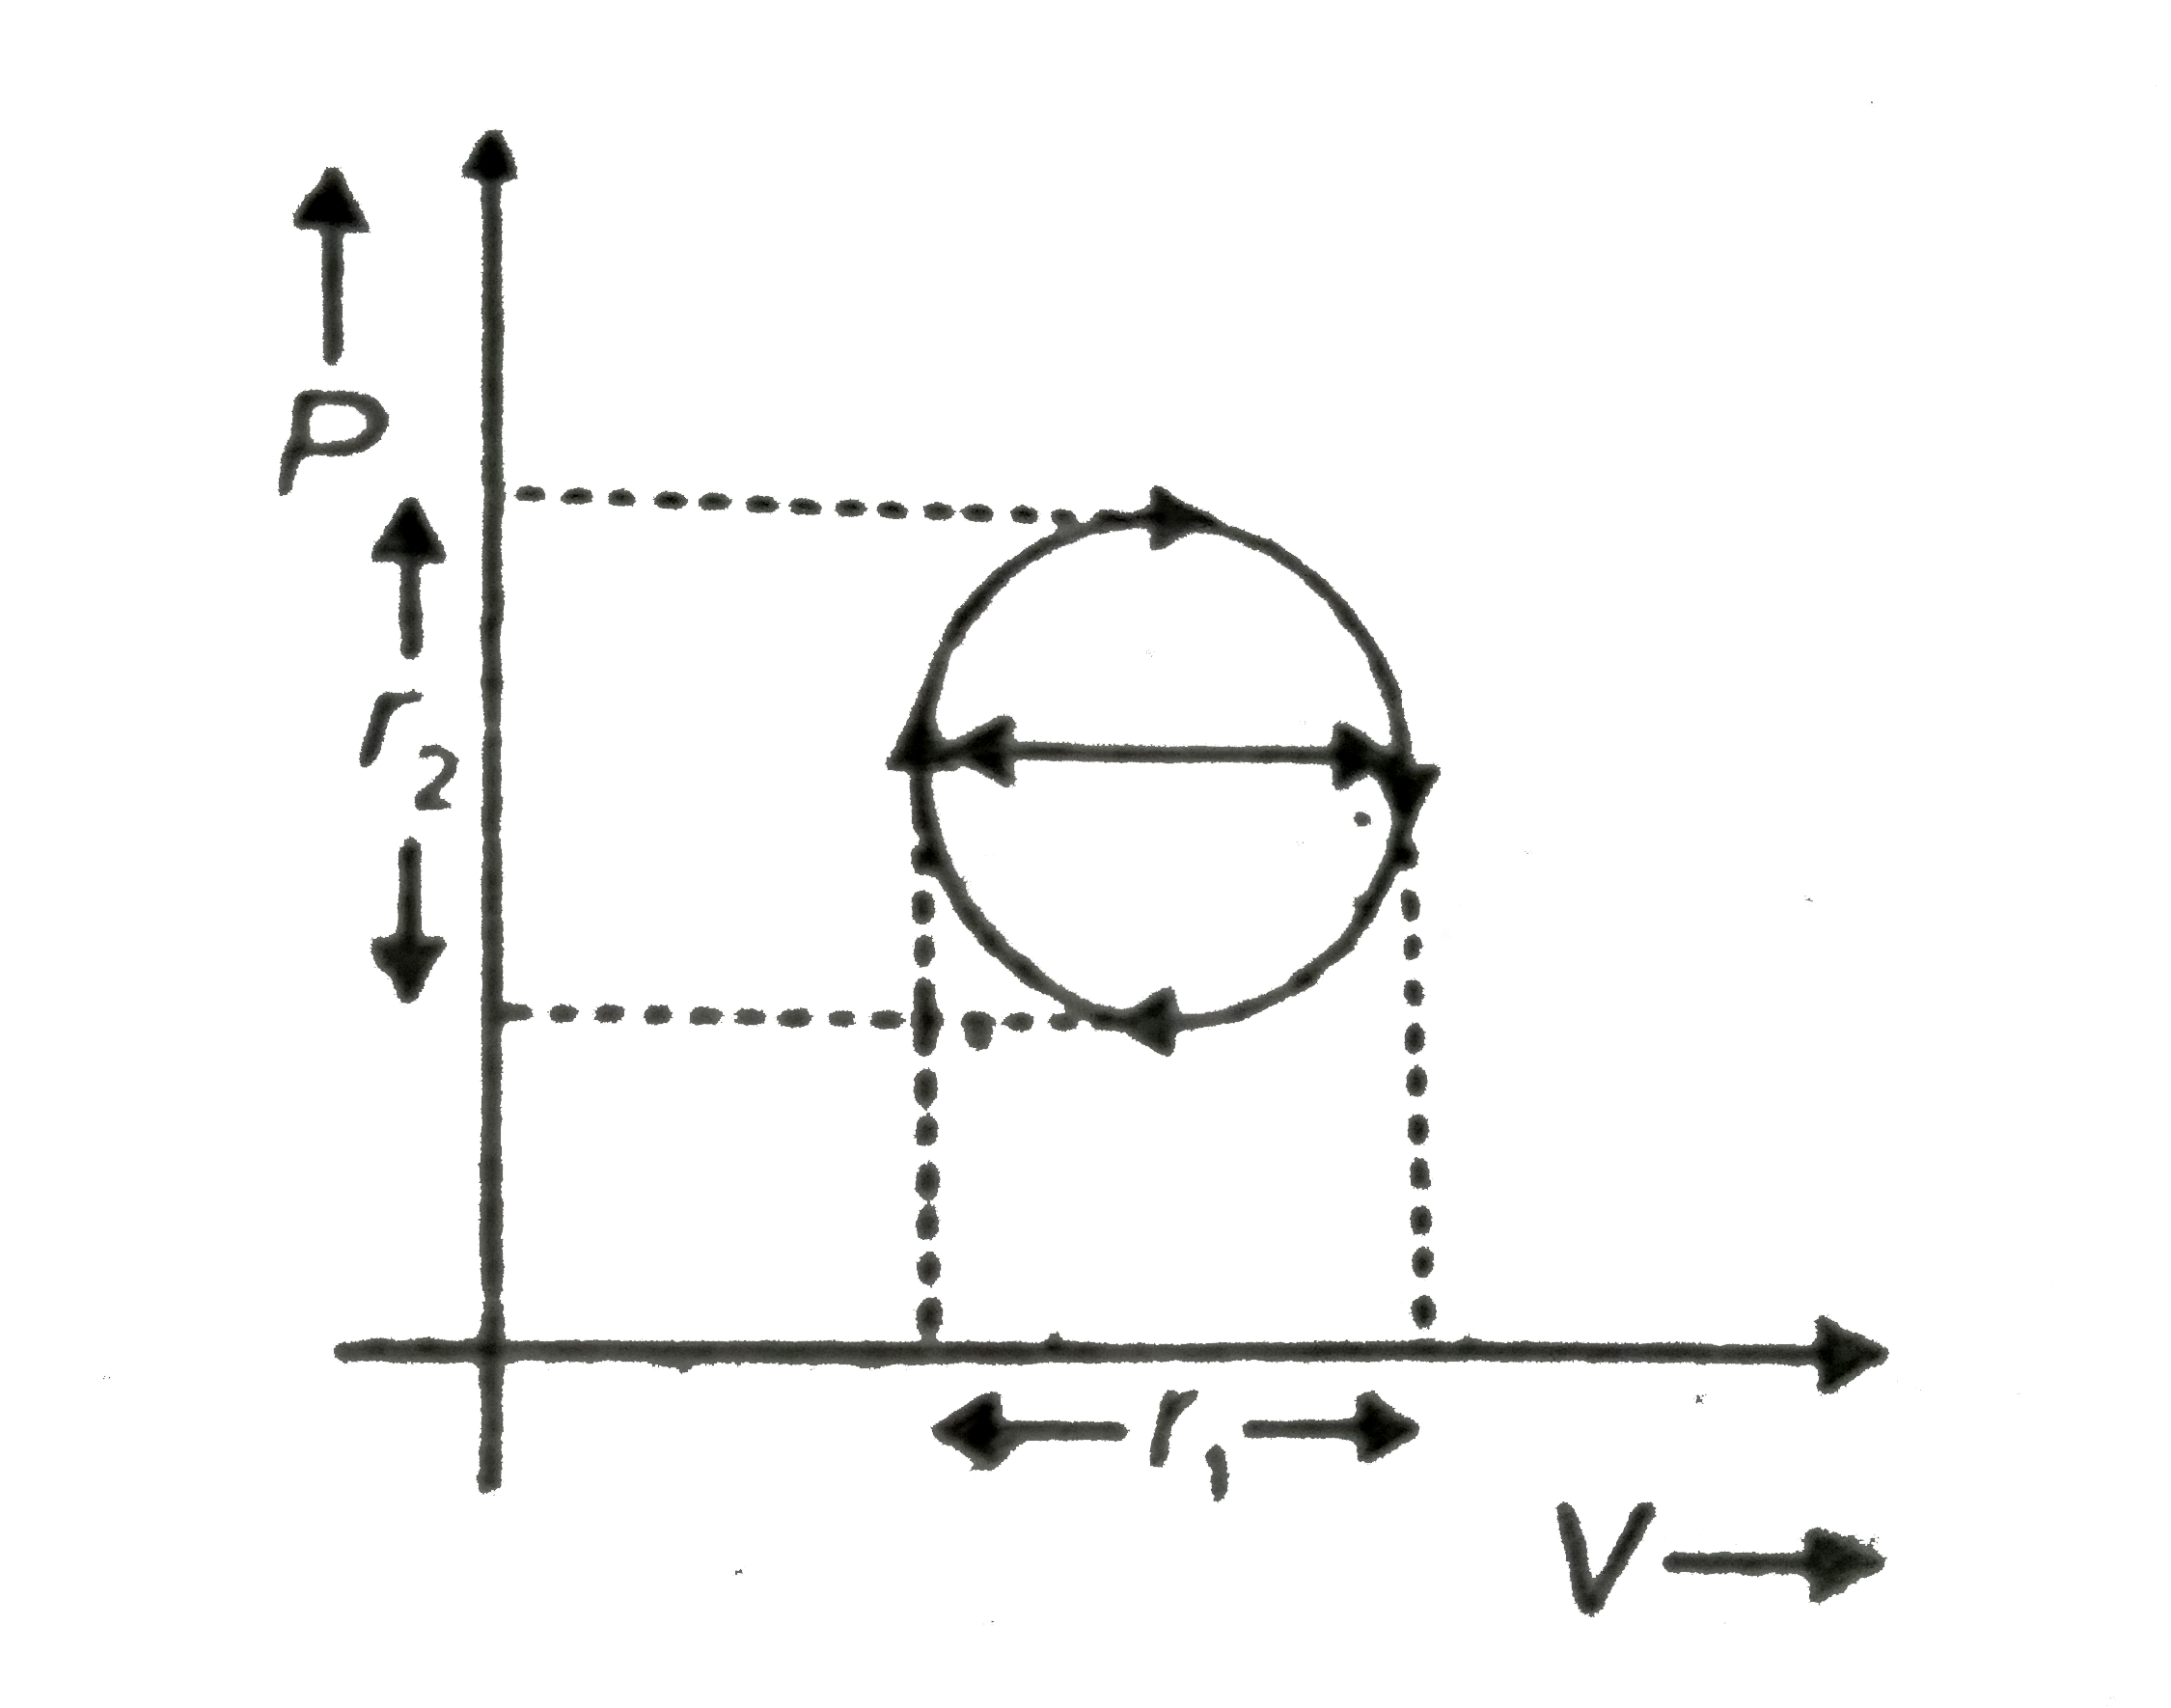
View SolutionAn ideal gas undergoes the cyclic process shown in a graph below :
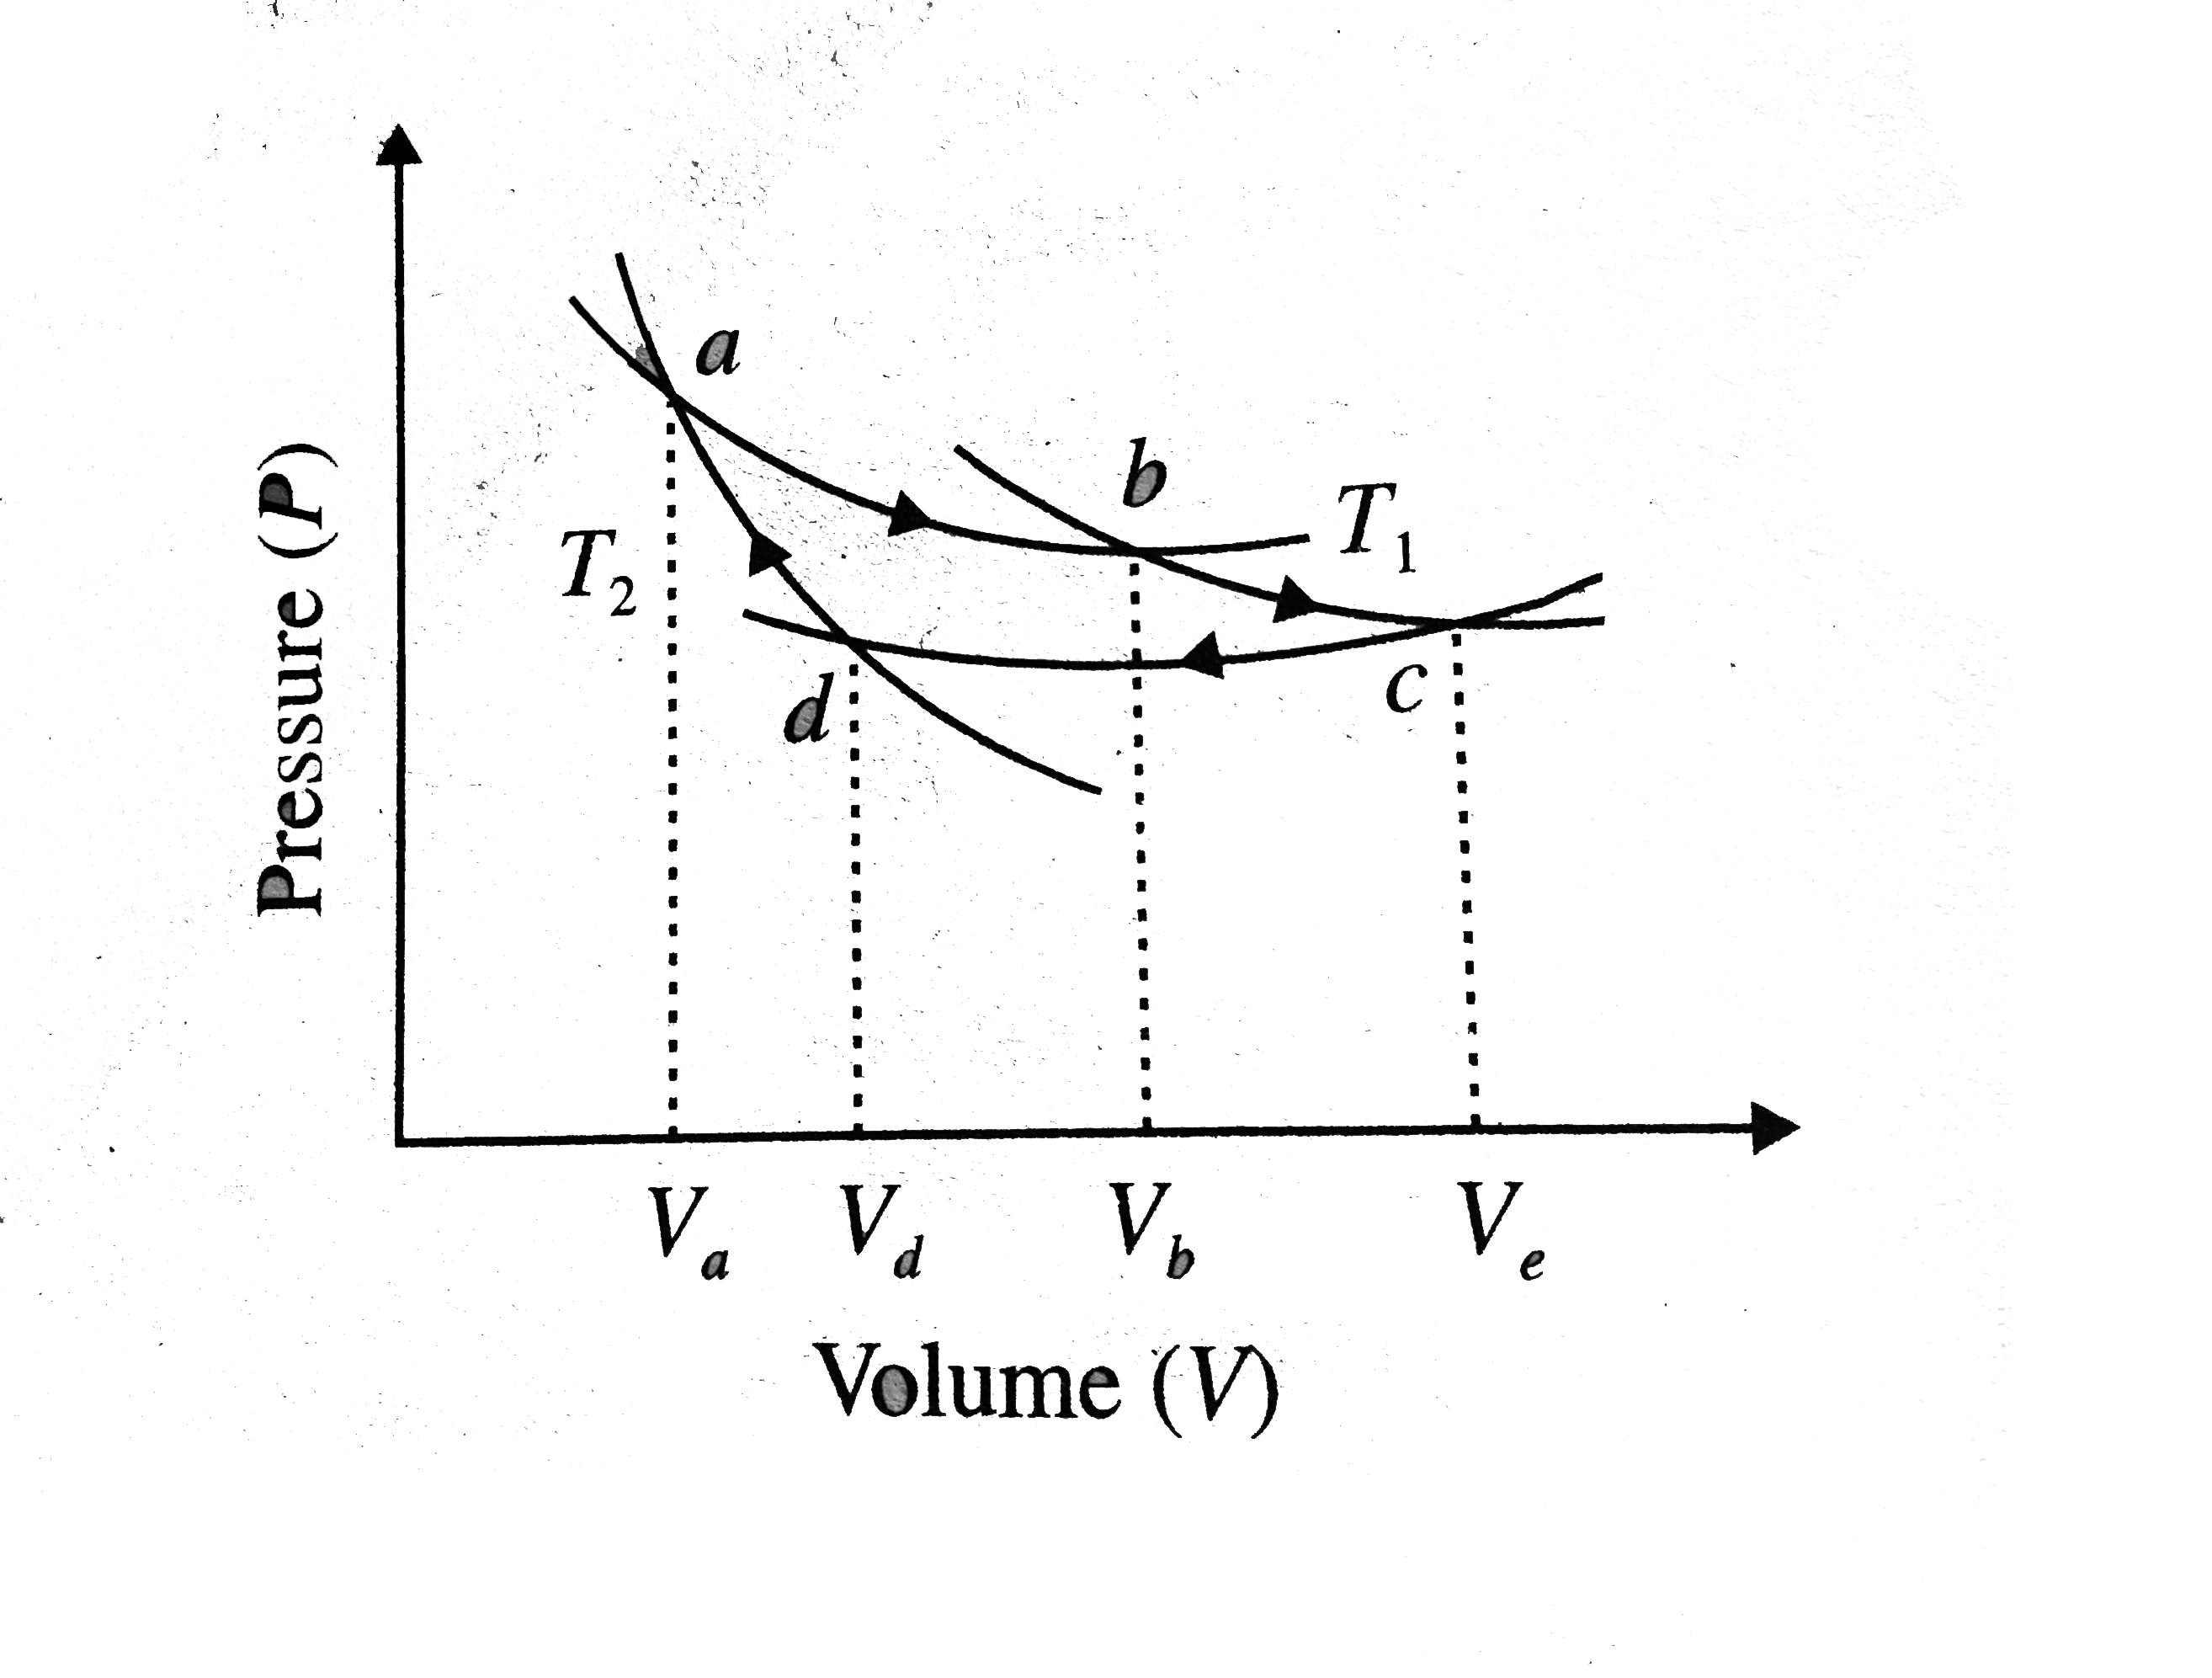
View SolutionFind the work done by gas going through a cyclic process shown in figure?

View SolutionOne mole of an ideal gas is carried through the reversible cyclic process as shown in figure. The max. temperature attained by the gas duing the cycle
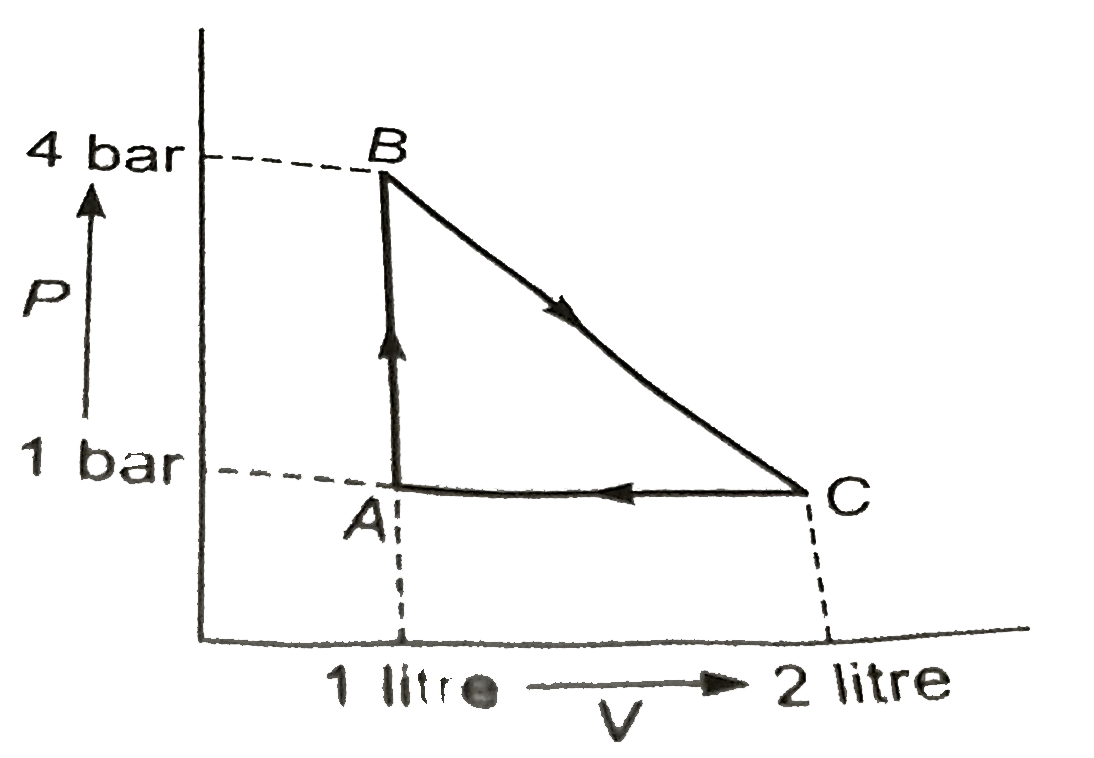
View SolutionOne mole of an ideal monoatomic gas is taken through a cyclic process as shown. Choose the correct option(s).
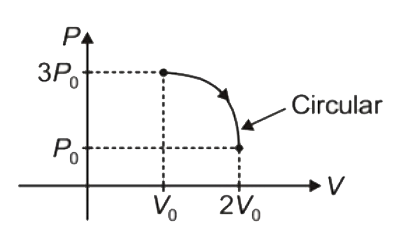
View SolutionOne mole of an ideal diatomic gas is taken through a process whose P−V diagram is shown in the figure. The work done by the gas is
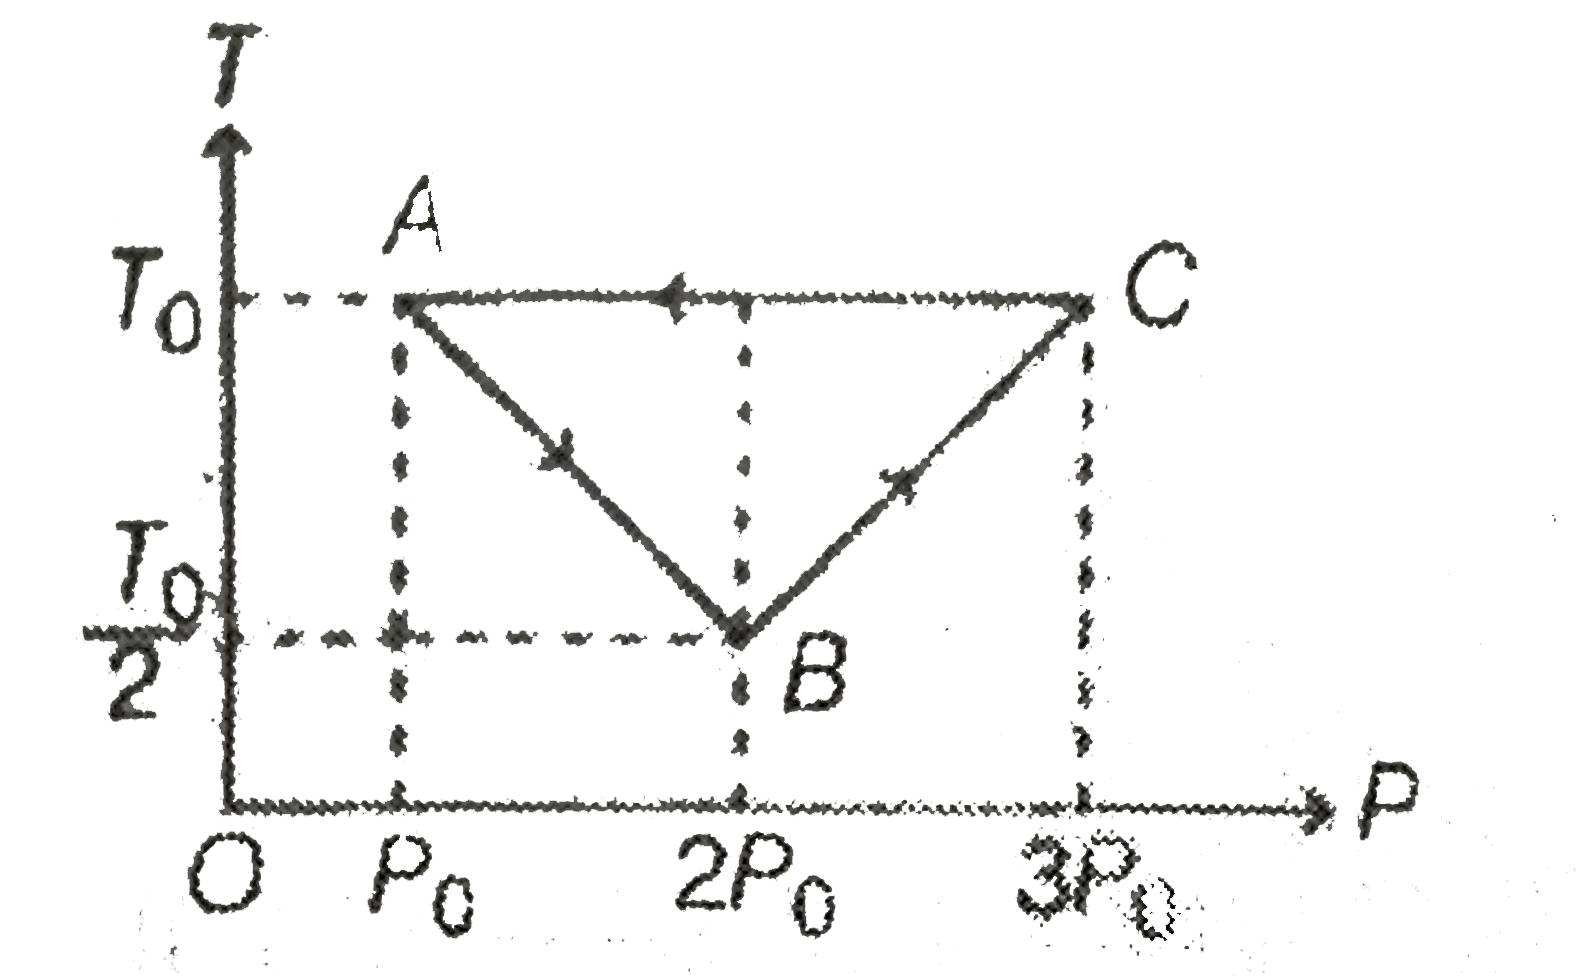
View SolutionA cyclic process ABCD is shown in the V−T diagram. Which of the following curves represent the same process ?
View Solution
