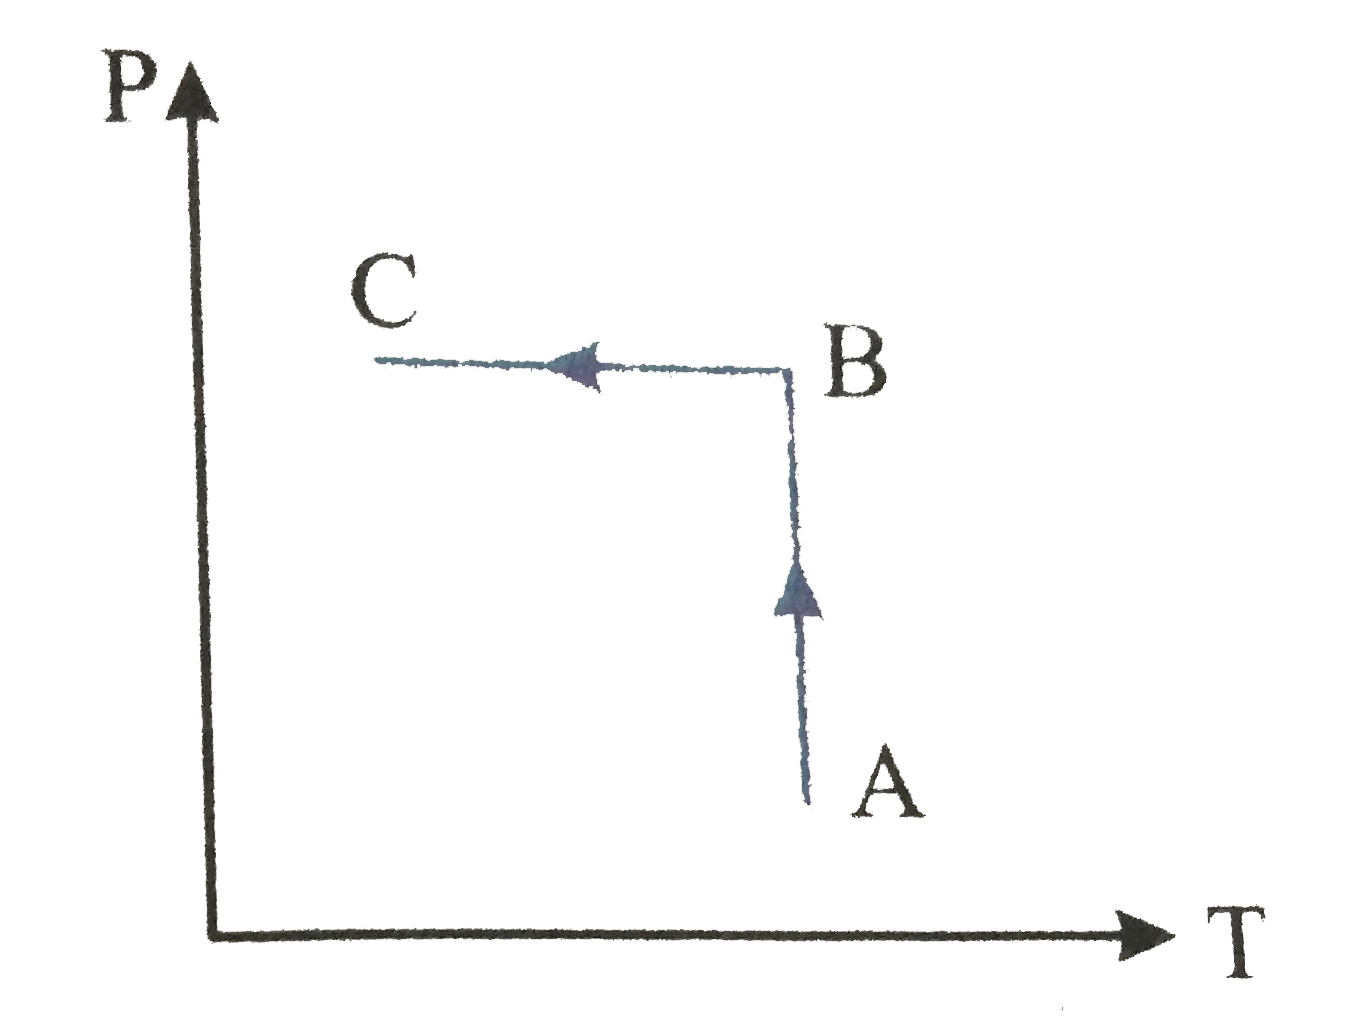
One mole of an ideal monoatomic has is taken through cyclic process ABC as shown in the graph with pressure and temperature as coordinate axes. Process AB is defined as PT = constant. Take universal gas constant to be R. Then:
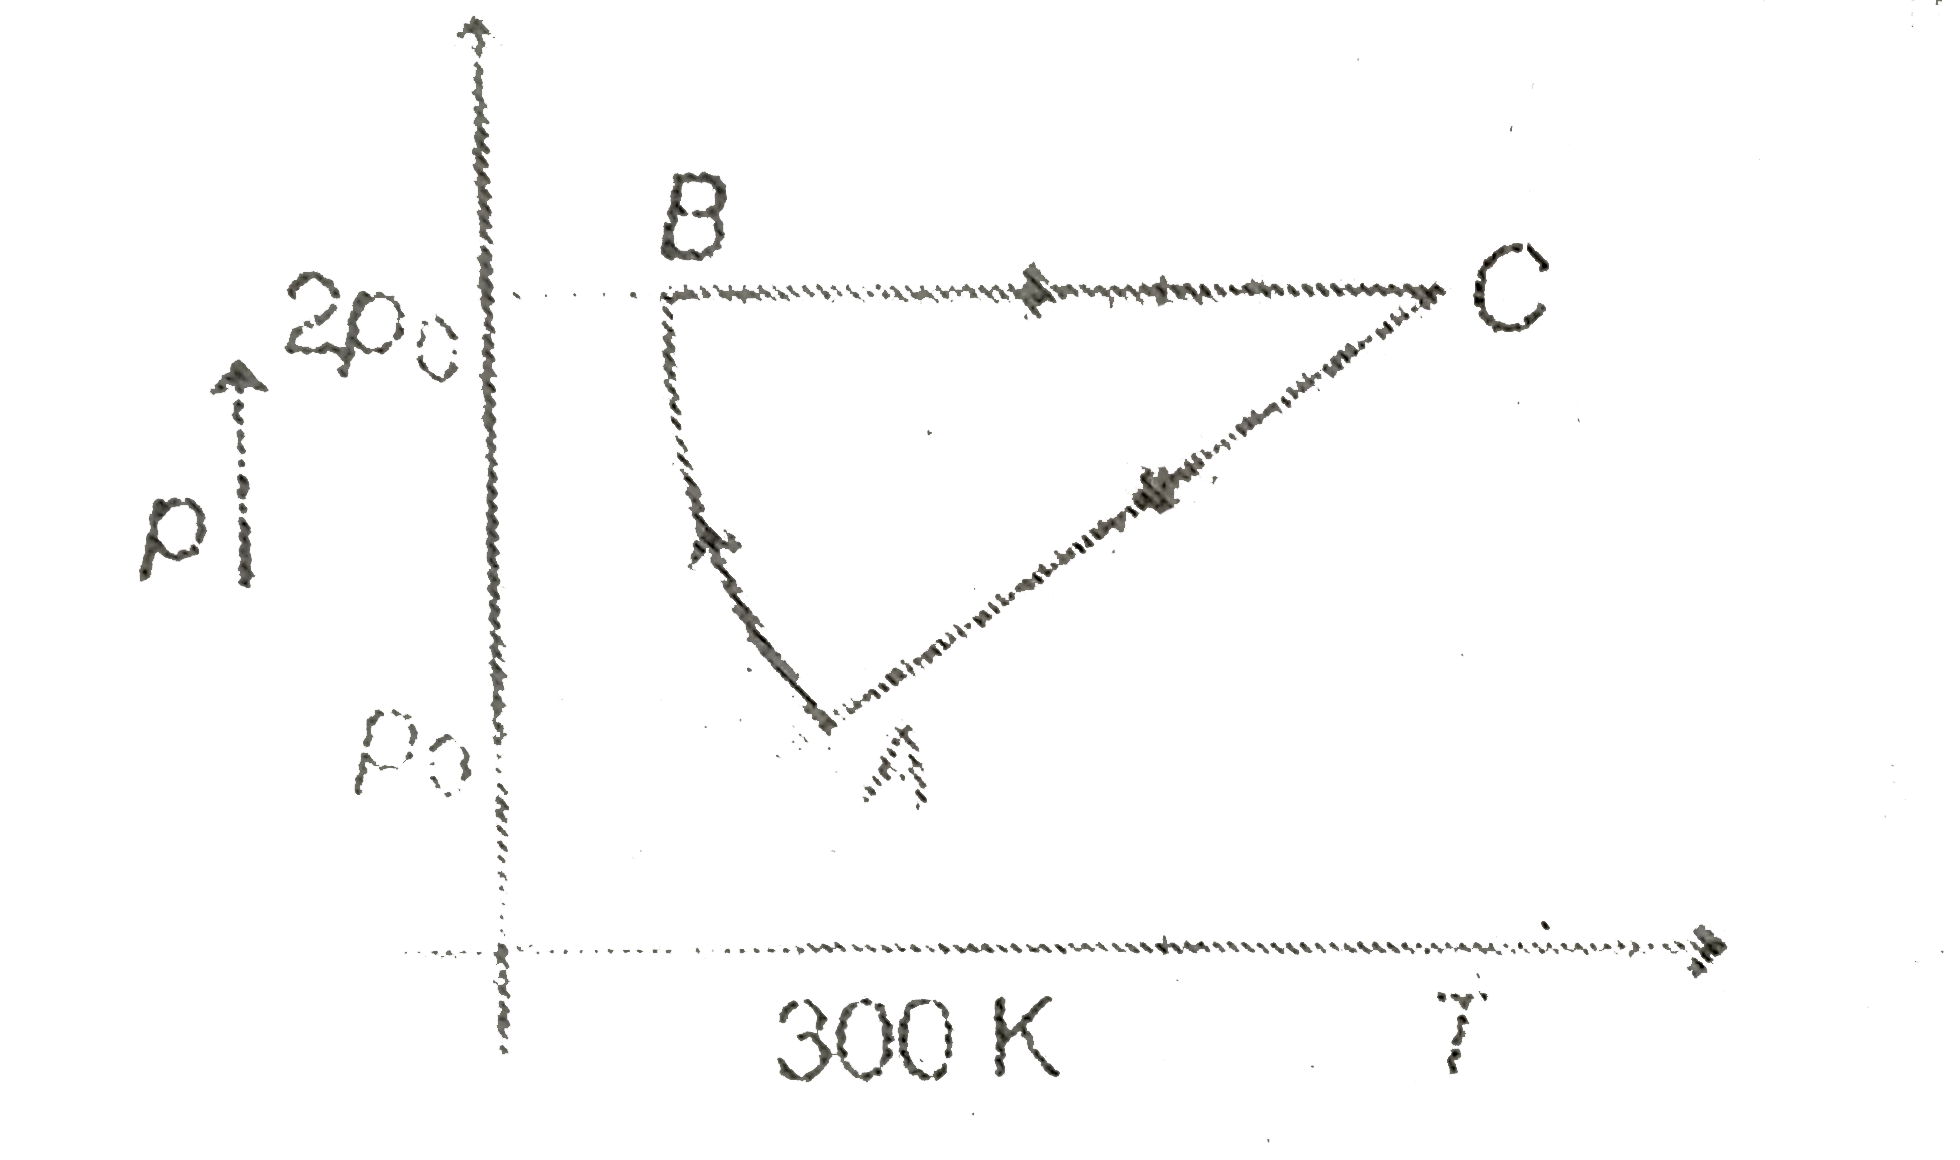
Change in internal energy of gas in the process CA is
−350R
−450R
−550R
−600R
The correct Answer is:B
Step by step video & image solution for One mole of an ideal monoatomic has is taken through cyclic process ABC as shown in the graph with pressure and temperature as coordinate axes. Process AB is defined as PT = constant. Take universal gas constant to be R. Then: Change in internal energy of gas in the process CA is by Physics experts to help you in doubts & scoring excellent marks in Class 11 exams.
Updated on:21/07/2023Topper's Solved these Questions
Similar Questions
One mole of an ideal monoatomic has is taken through cyclic process ABC as shown in the graph with pressure and temperature as coordinate axes. Process AB is defined as PT = constant. Take universal gas constant to be R. Then:
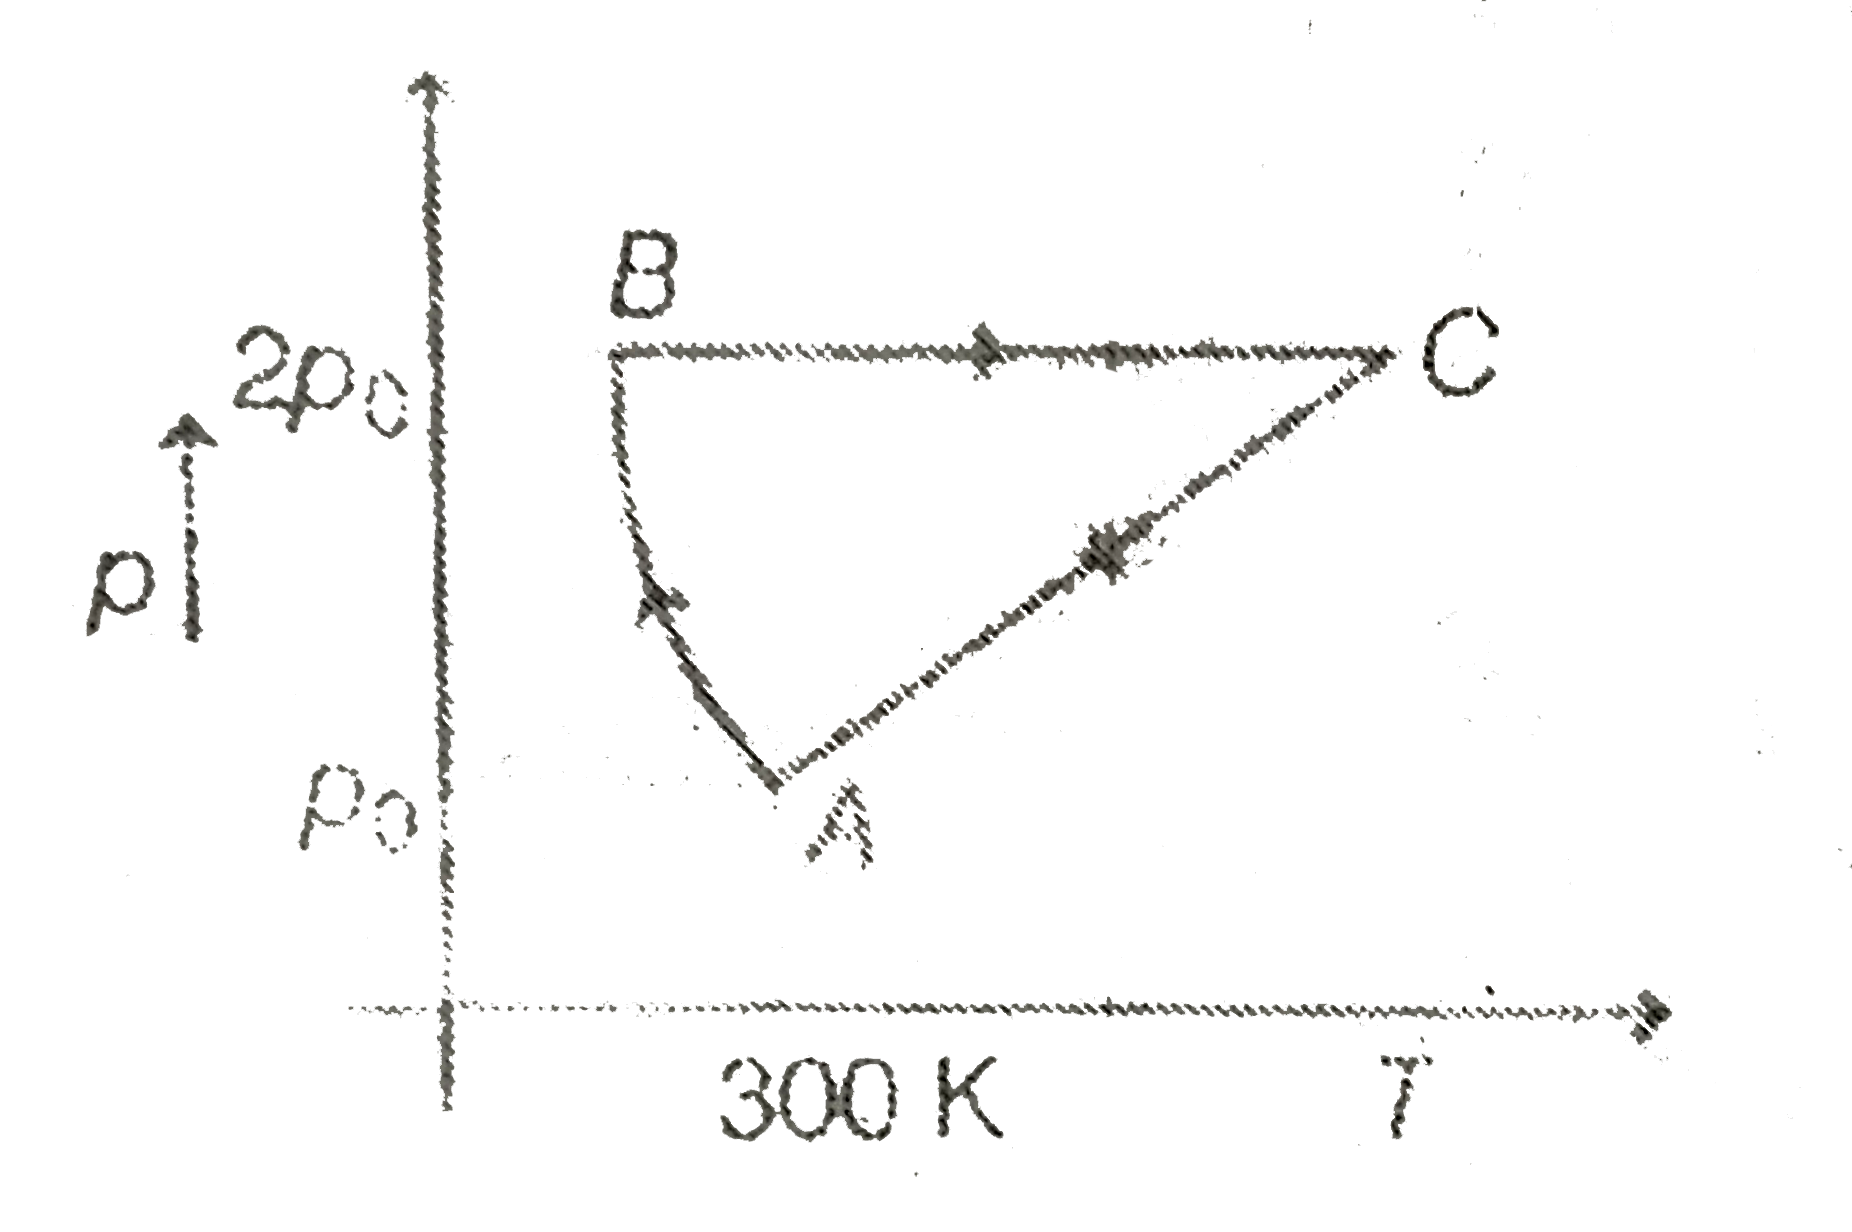
work done on gas in the process AB is
View SolutionOne mole of an ideal monoatomic gas is taken through a cyclic process as shown. Choose the correct option(s).
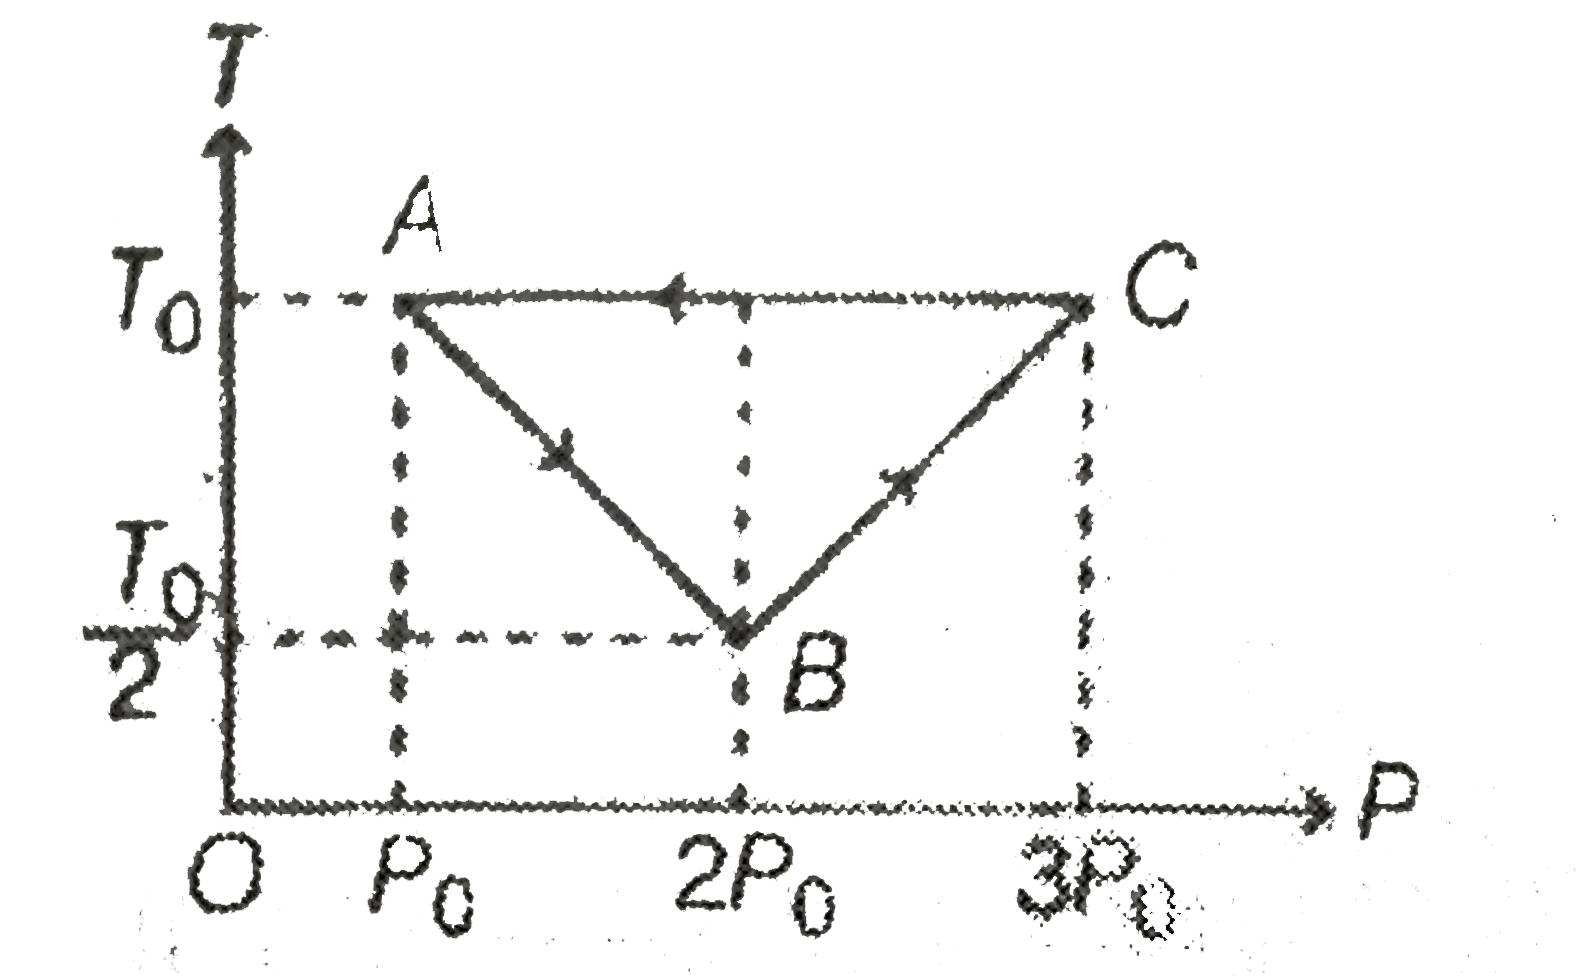
View SolutionOne mole of an ideal mono-atomic gas is taken round cyclic process ABC as shown in figure below. Calculate work done
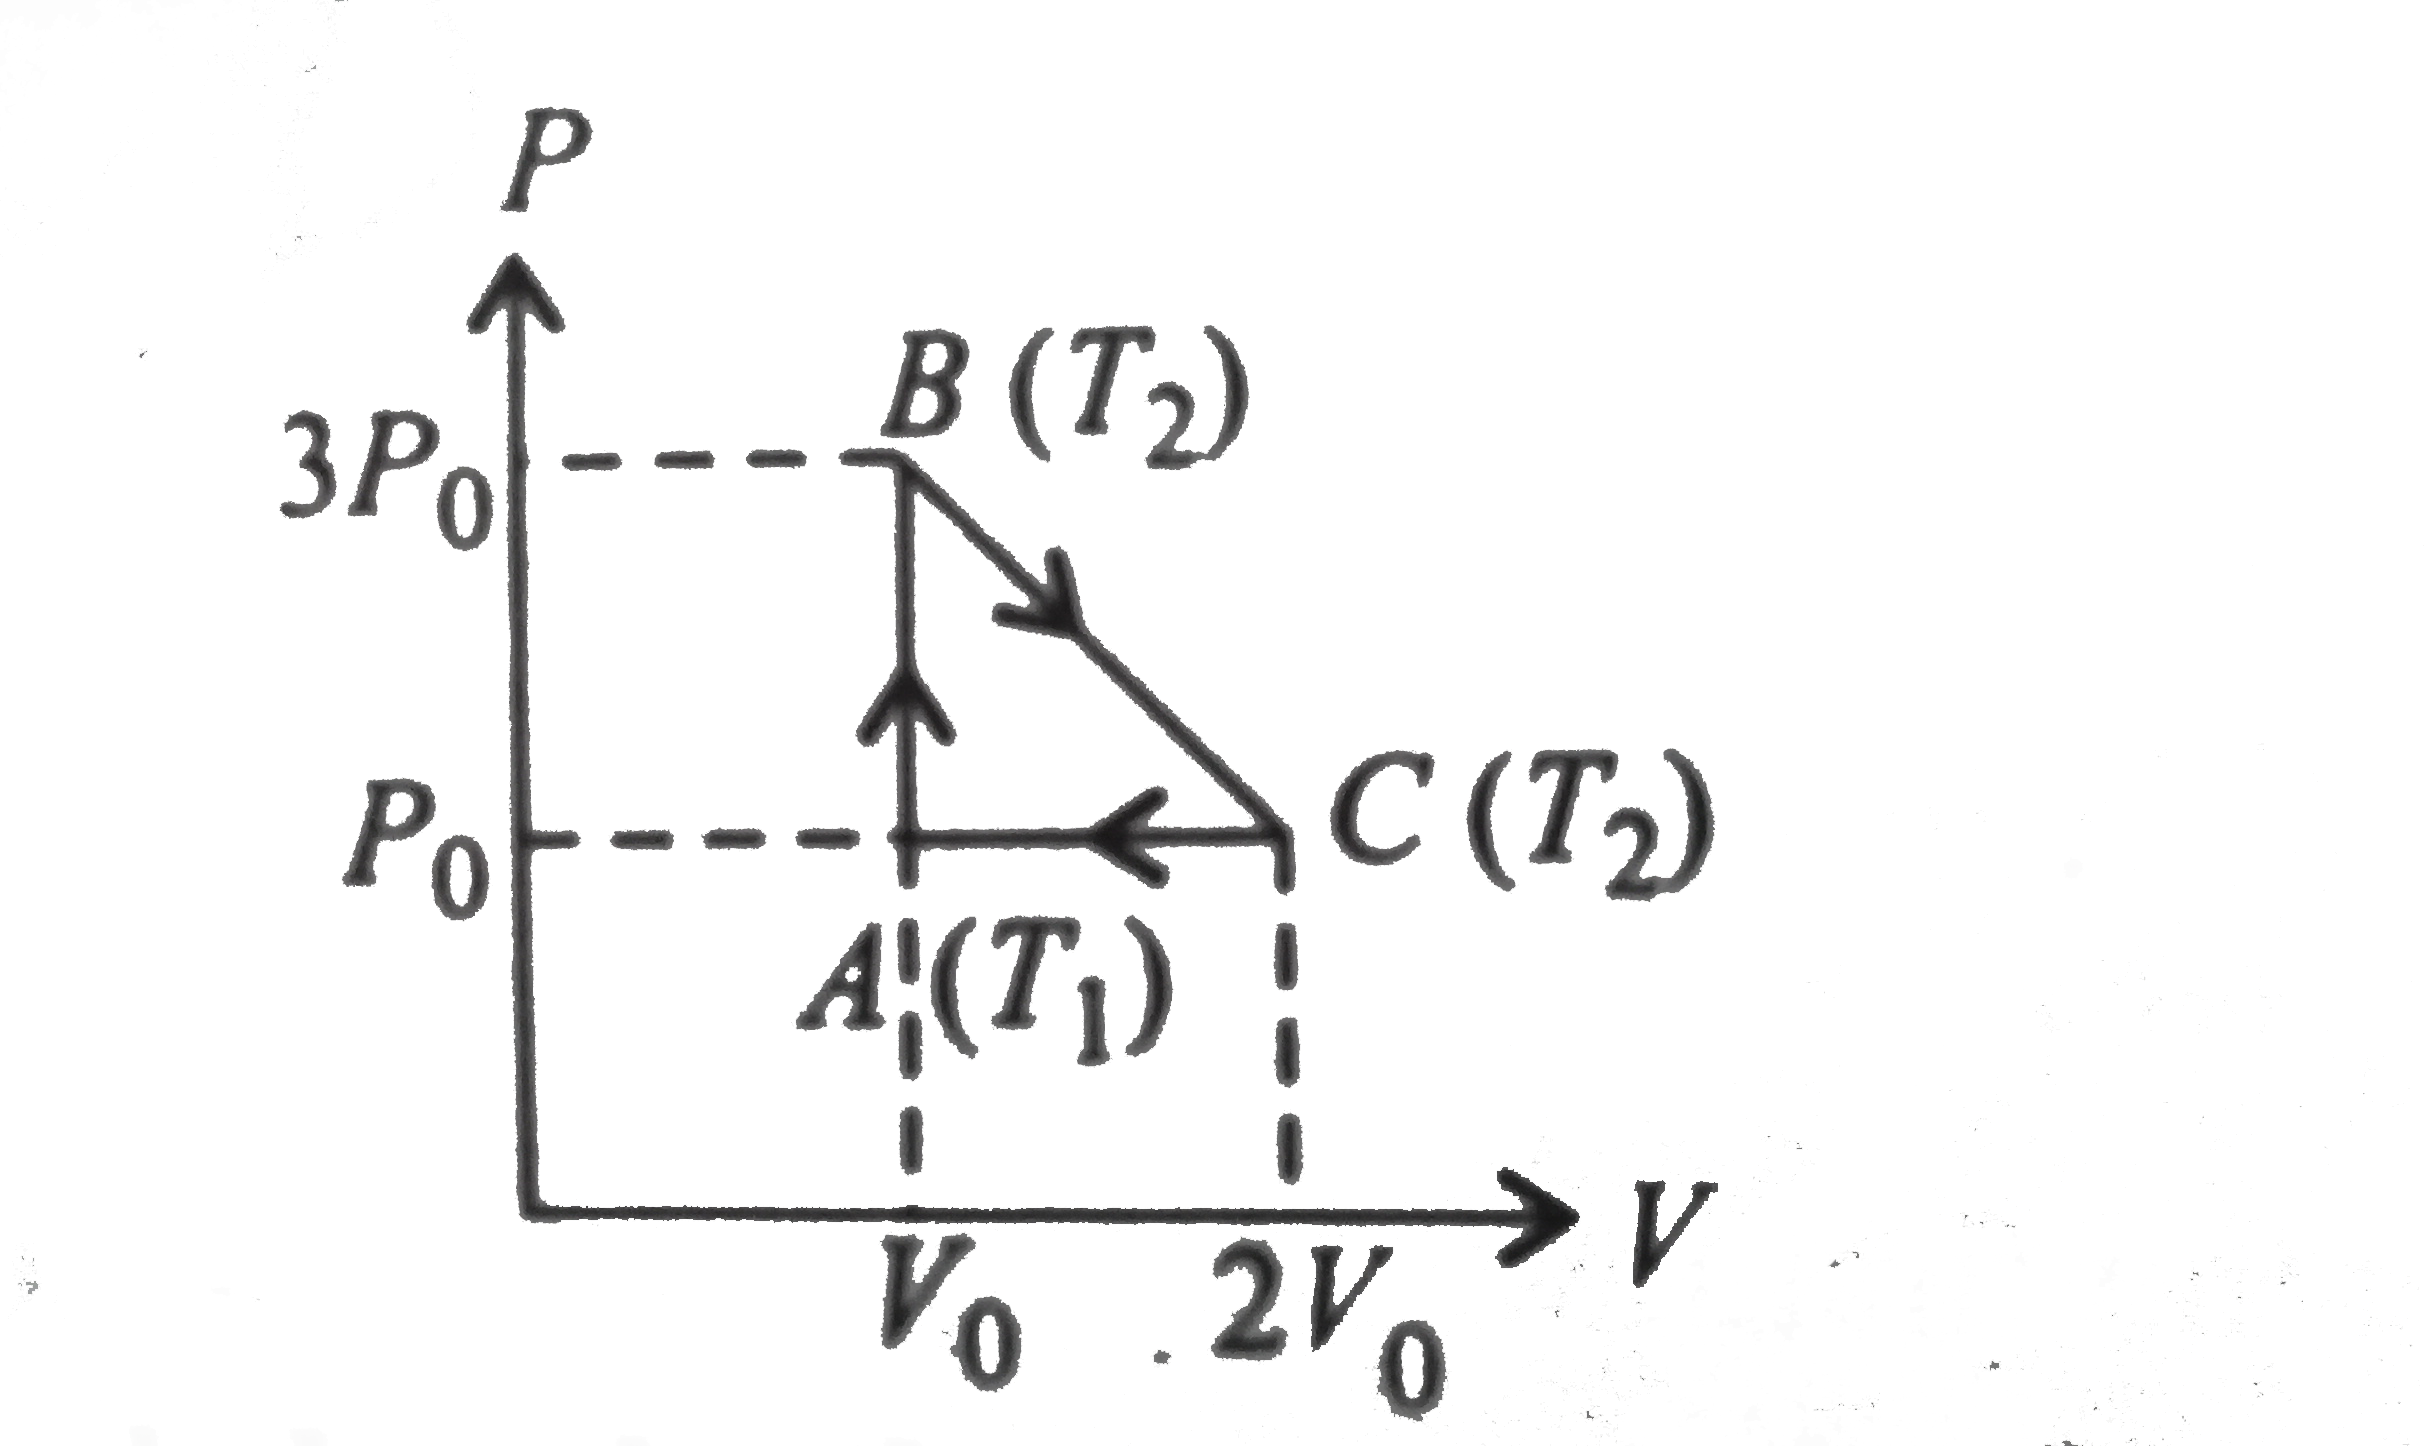
View SolutionOne mole of an ideal mono-atomic gas is taken round cyclic process ABC as shown in figure below. Calculate work done

View SolutionIdeal gas is taken through the process shown in the figure :
View SolutionIdeal gas is taken through the process shown in the figure :

View SolutionOne mole of an ideal mono-atomic gas is taken round cyclic process ABCD as shown in figure below. Calculate work done by the gas.

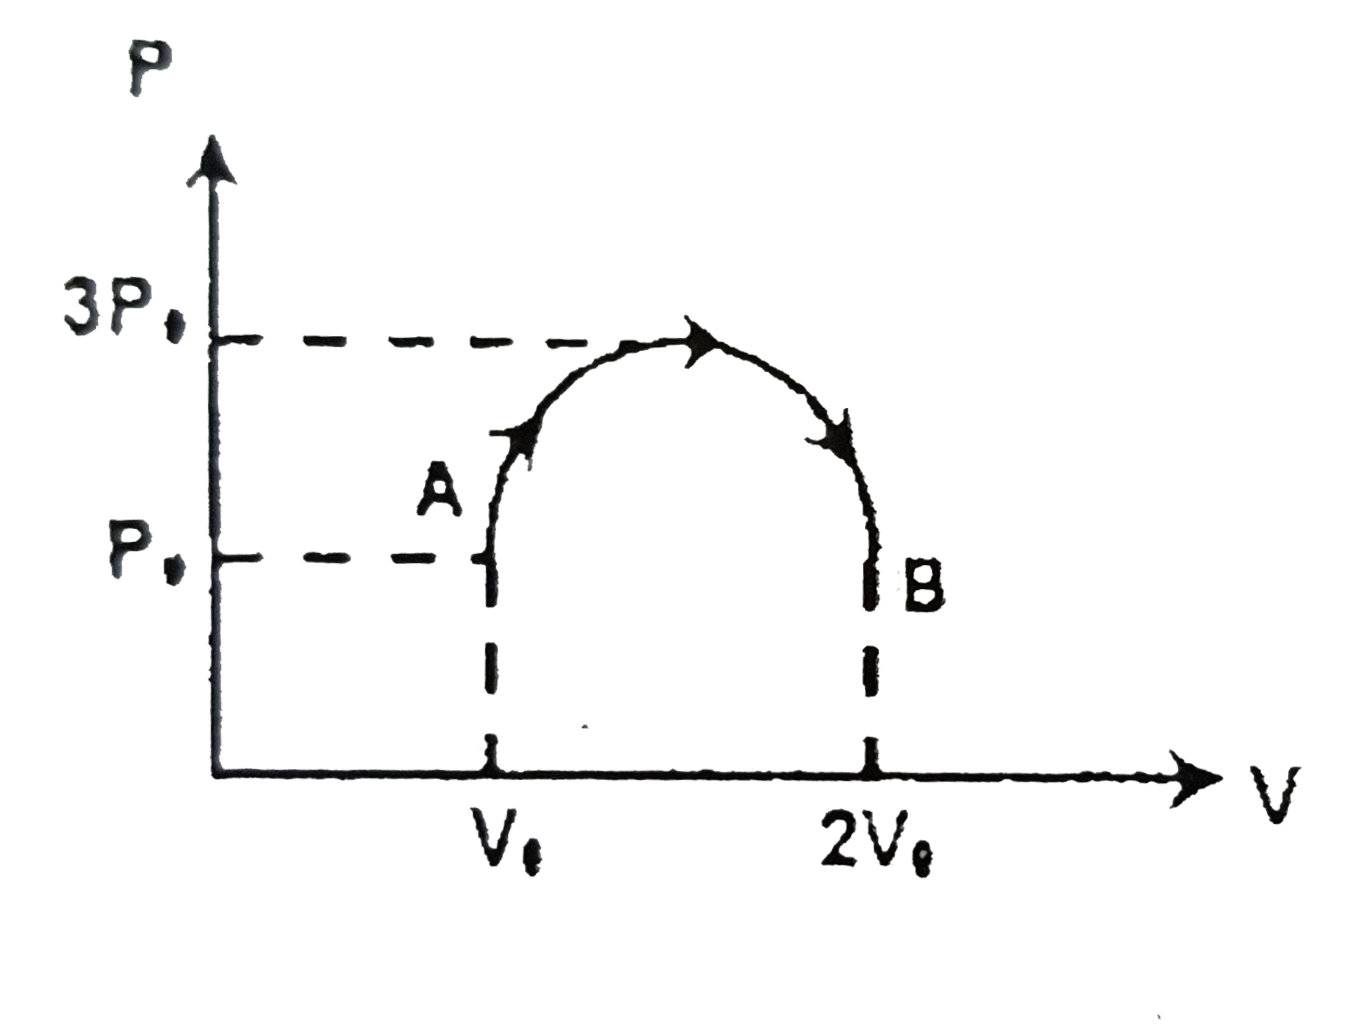
View SolutionOne mole of an ideal monoatomic gas is taken through the thermodynamic process shown in the P−V diagram. The heat supplied to the system is
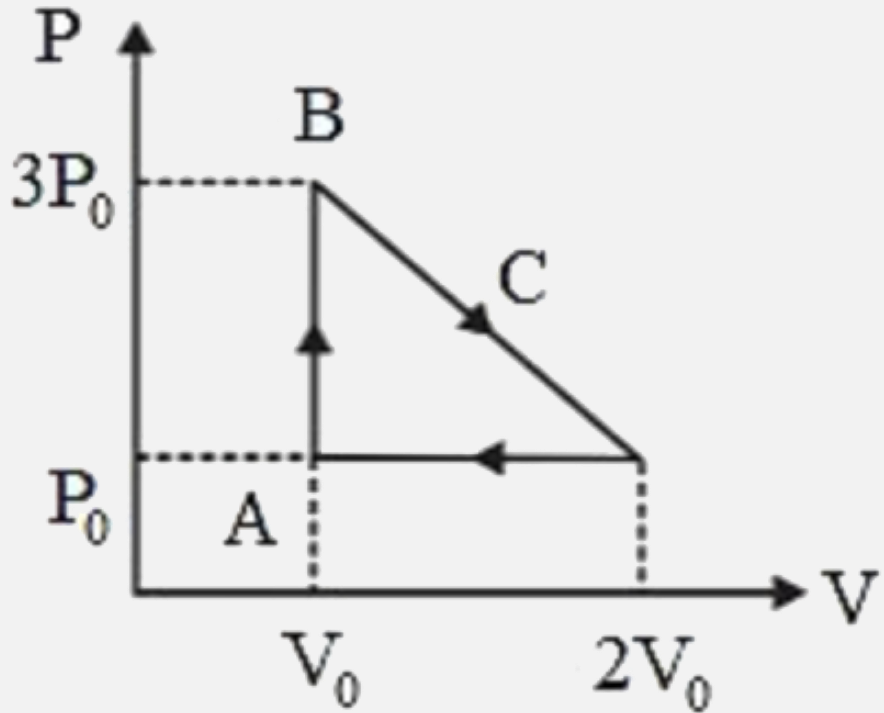
View SolutionOne mole of monoatomic gas is taken round the cyclic process. Heat absorbed by gas in process AB is
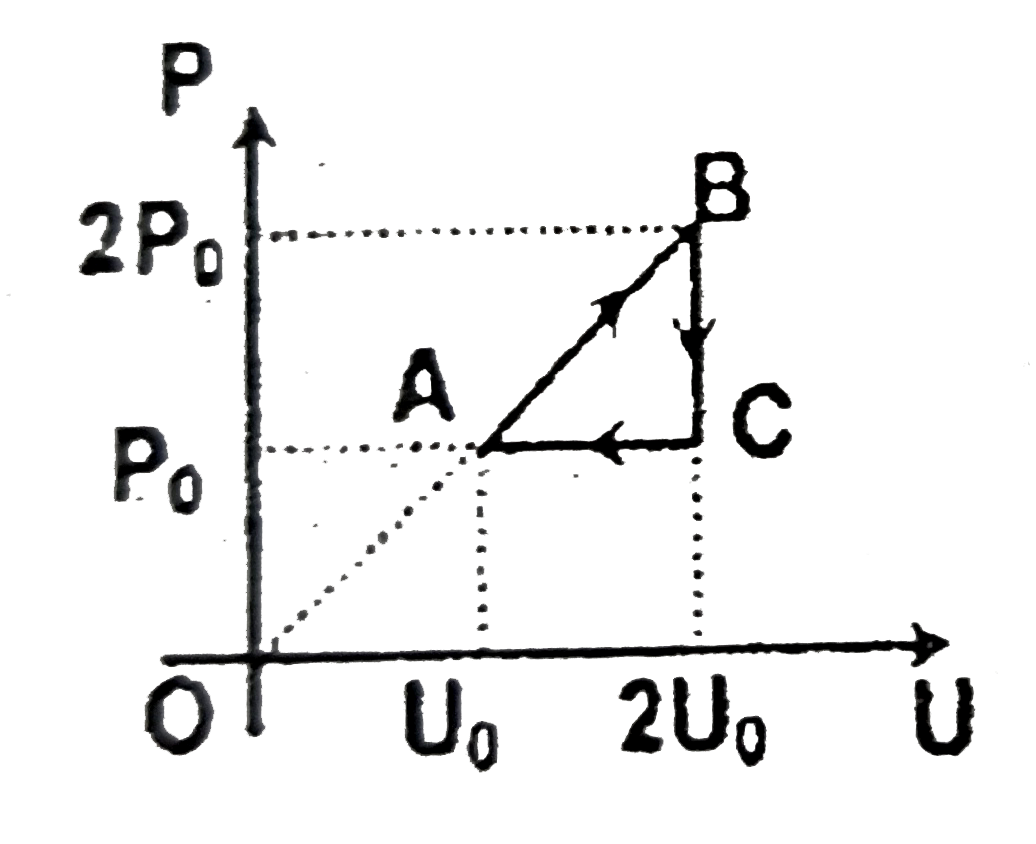
View SolutionAn ideal monatomic gas undergoes a cyclic process ABCA as shown in the figure. Graph of pressure versus volume of the cyclic process ABCA is
View Solution
