The slope of the graph showing the variation of potential difference V on x-axis and current I on y-axis gives the conducts
condutance
conductivity
resistance
resistivity
The correct Answer is:A
Similar Questions
Knowledge Check
The slope of the graph showing the variation of potential difference V on X-axis and current Y-axis gives conductor
AresistanceBresistivityCreciprocal of resistanceDconductivity
Draw a graph of Potential difference (V) versus Current (I) for an ohmic resistor.
View SolutionSketch the graphs, showing the variation of stopping potential Vs with frequency v of the incident radiations for two photosensitive materials A and B having threshold frequencies v0>v'0 respectively.
(i) which of the two metals A or B has higher work function?
(ii) What information do you get from the slope of the graphs?
(iii) What does the value of the intercept of graph A on the potential axis represent?
View SolutionDraw a graph showing the variation of stopping potential with frequency of the incident radiation. What does the slope of the line with frequency axis indicate? What information can be obtained from the values of intercept on the potential axis?
View SolutionPlot a graph which shows the dependence of current I on potential difference V across a resistor R .
View SolutionPlot a graph which shows the dependence of current I on potential difference V across a resistor R .
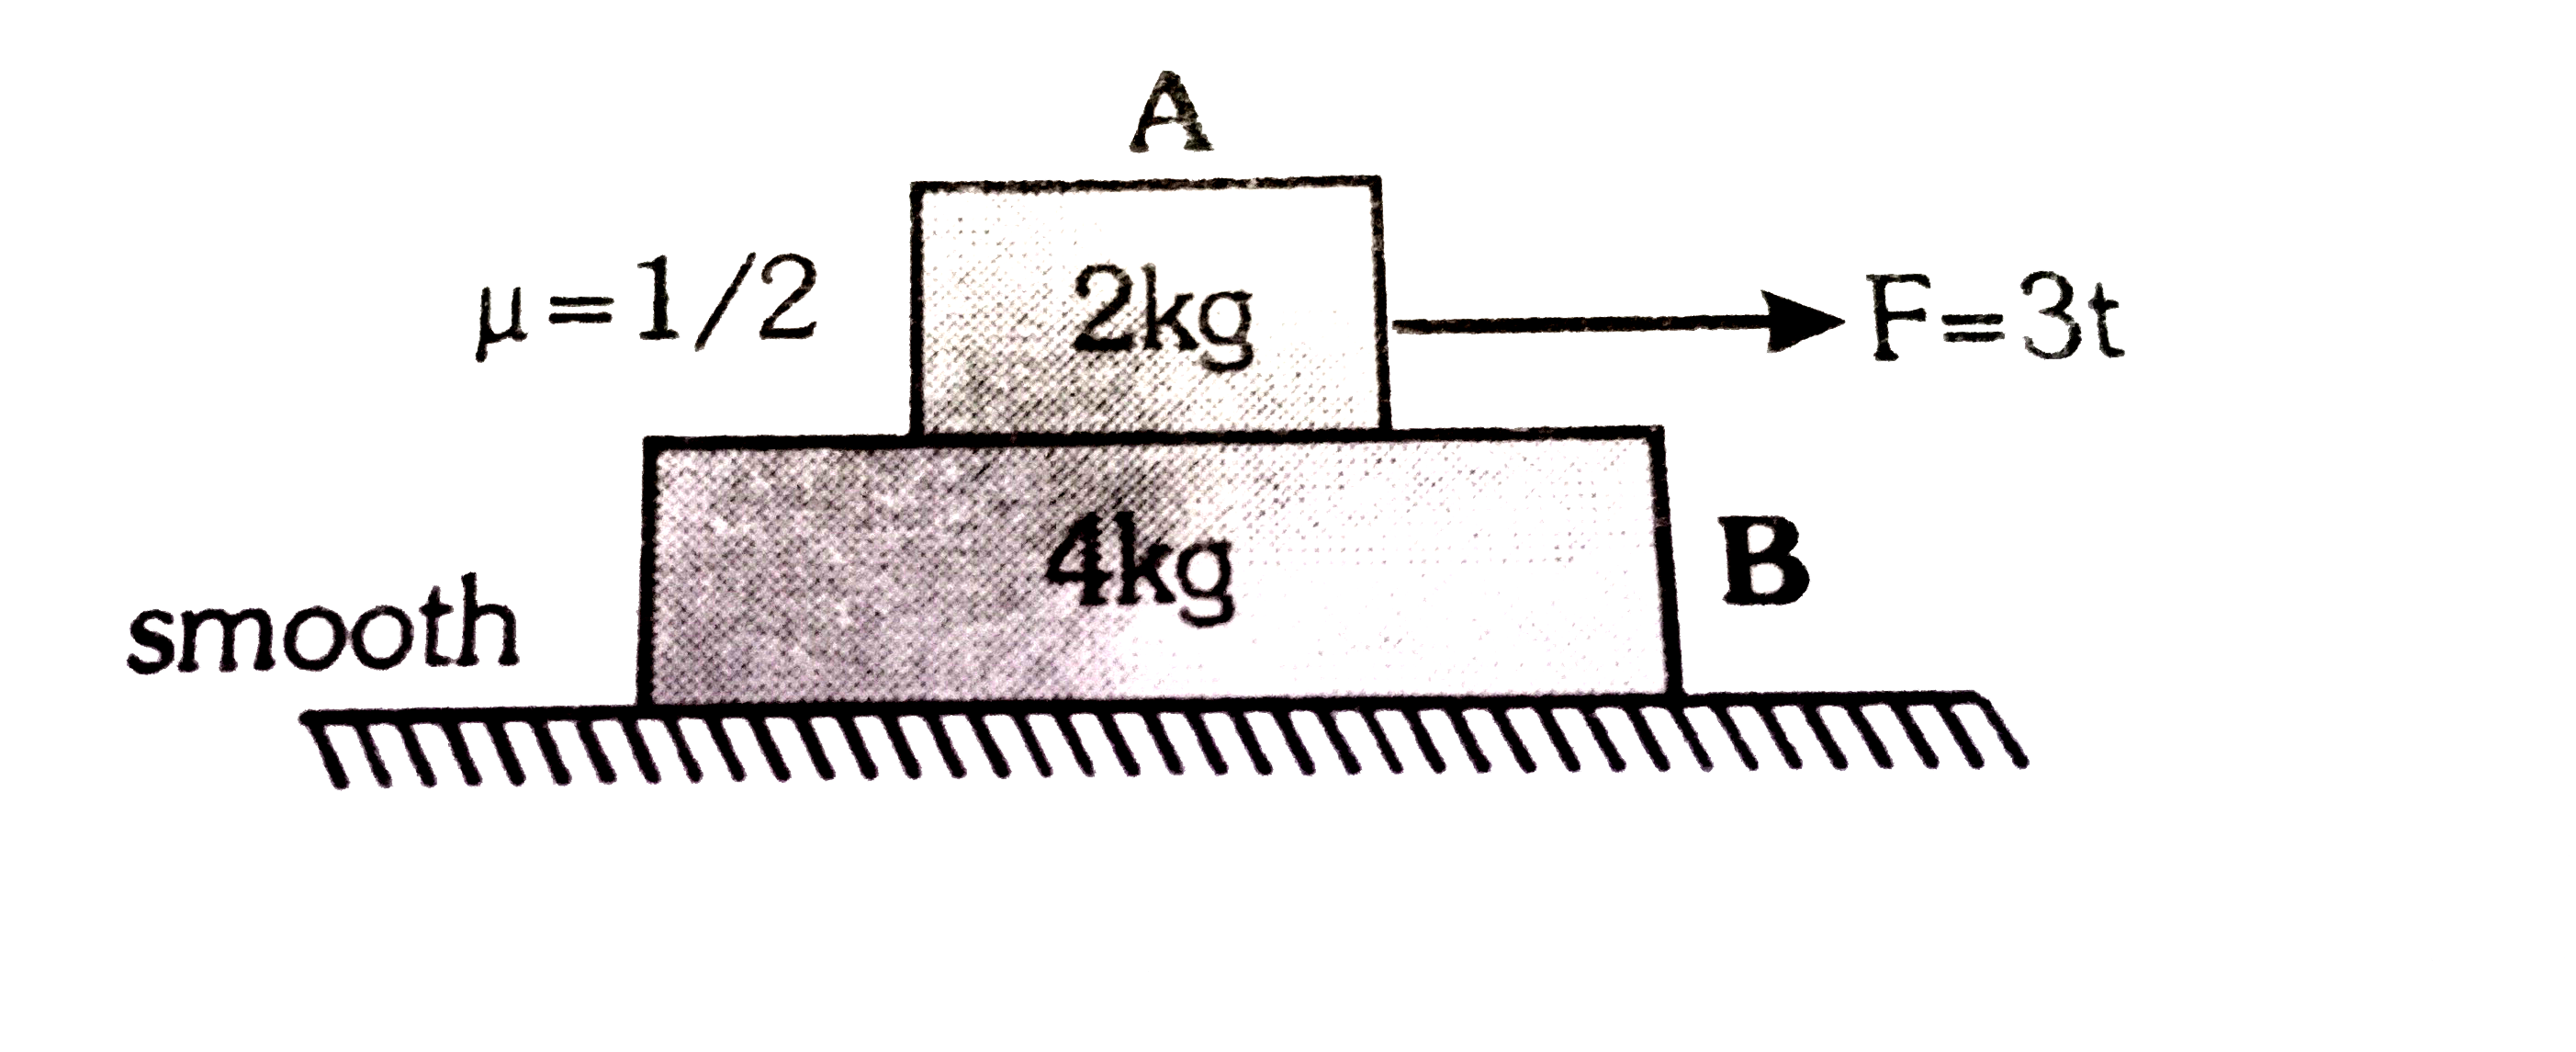
View SolutionFor shown situation draw a graph showing acceleration of A and B on y-axis and time on x-axis (g=10ms−2)

View Solution
