
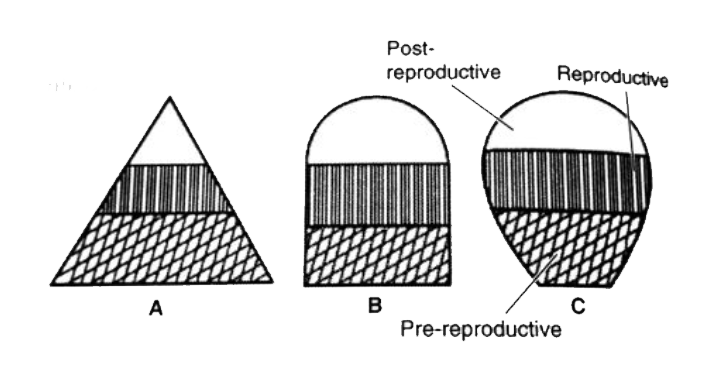
Given above is the bar diagrams showing age structure of three different populations.
Select stable population.
(B) Compare the nature of population growth in A,B, C.
Text Solution
(A) B
(B) 
|
Similar Questions
Knowledge Check
Which of the given age pyramid reflects a stable human population ?
A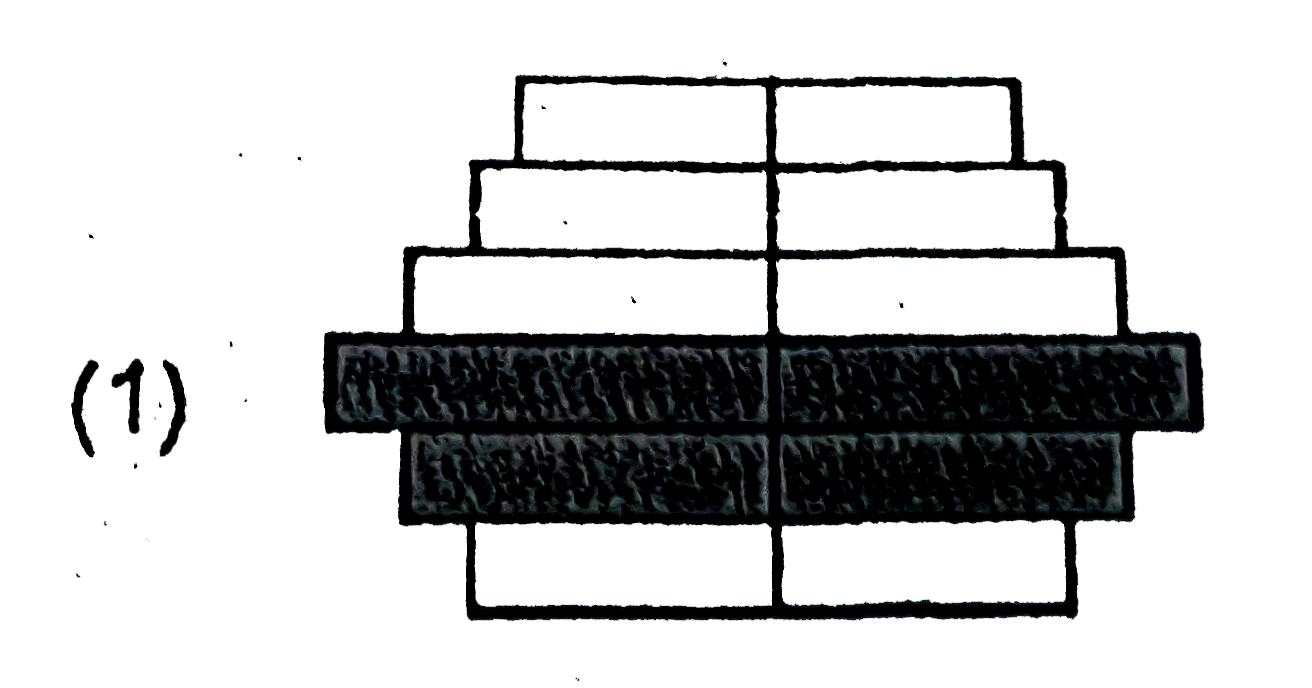 B
B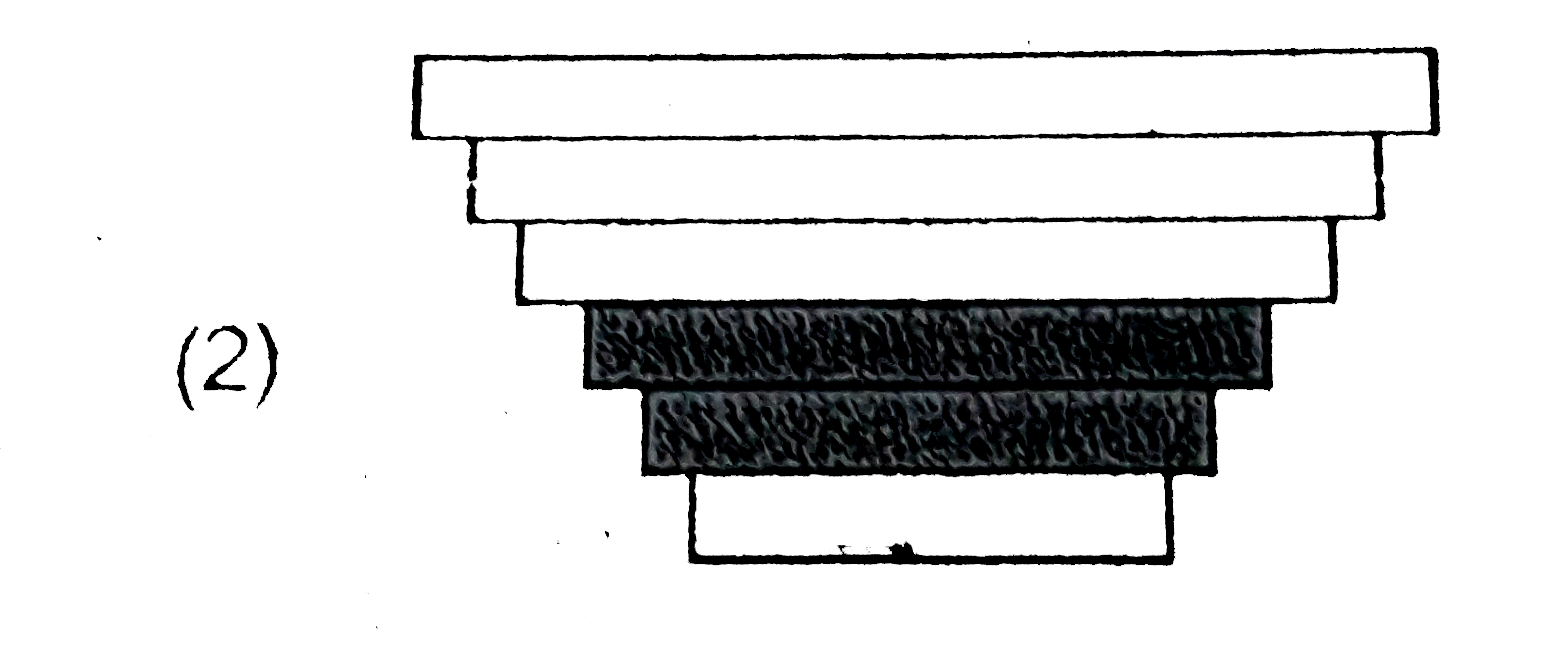 C
C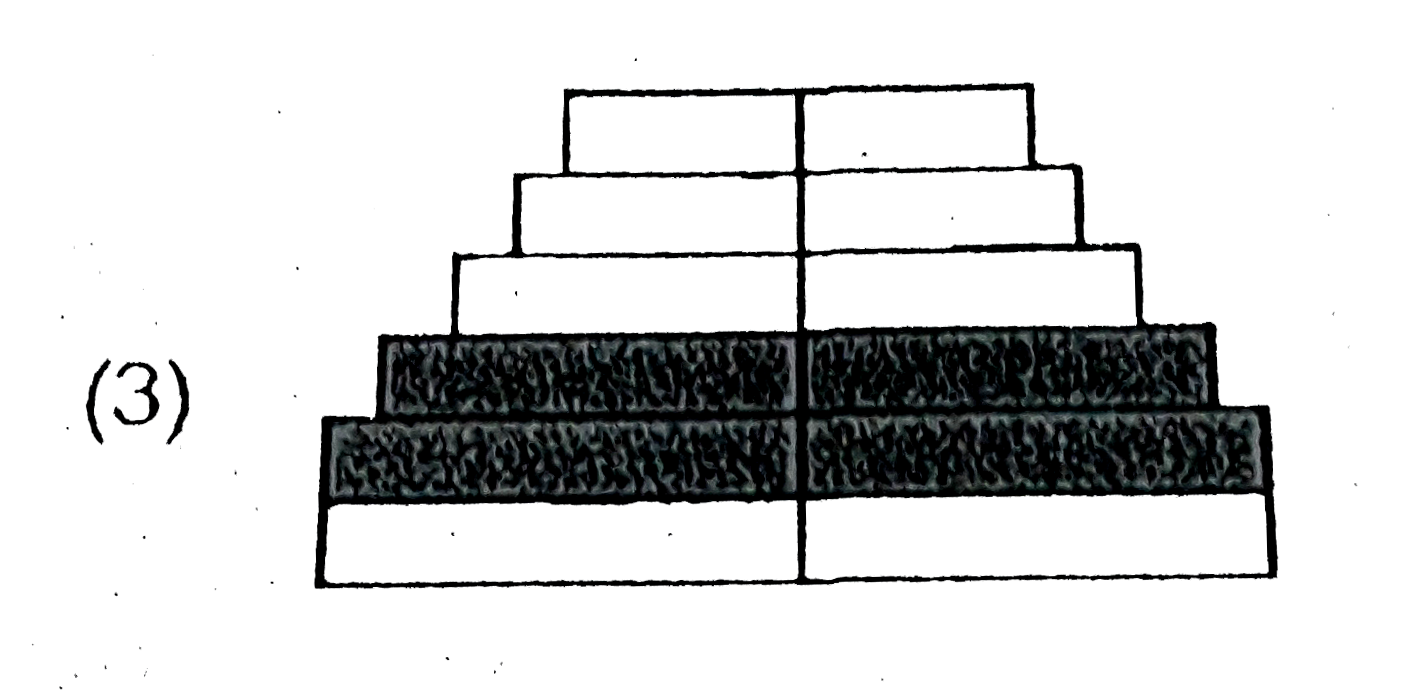 D
D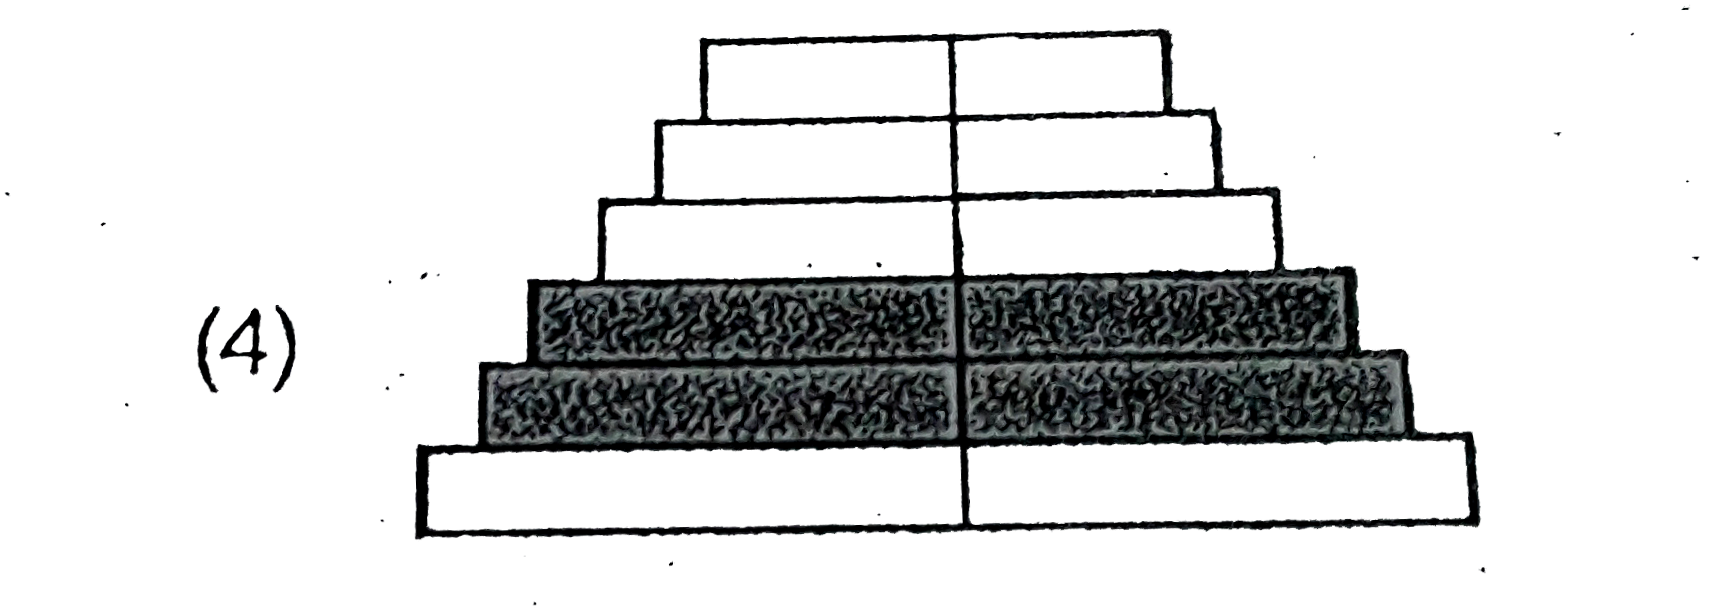
The following diagrams are the age pyramids of different populations.

Select the correct statements regarding the above:AA-It is a pyramid-shaped age pyramid indicating decreased population growth.BB-It is an inverted bell-shaped pyramid indicating stable population.CC-It is urn-shaped pyramid indicating increased population growth.DAll statements are incorrect.The age structures of a population influences population growth because
AYounger females have more offsprings than do older femalesBDifferent age groups have different reproductive capabilitiesCThe more individuals that are immature, the slower the population will growDA shorter generation time results in slower population growth
The following diagrams are the age pyramids of different populations. Comment on the status of these poulations.

View SolutionThe following diagrams are the age pyramids of different populations. Comment on the status of these poulations.

View SolutionThe age structures of a population influences population growth because
View SolutionThe age structures of a population influences population growth because
View SolutionThe following diagrams are the age pyramids of different populations.
Select the CORRECT statement regarding the above.
View Solution
