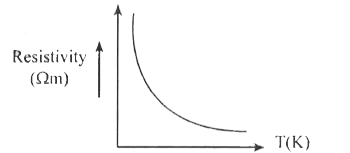
Draw a plot showing the variation of resistivity of a (i) conductor and (ii) semiconductor, with the increse in temperature. Solution in Kannada
Topper's Solved these Questions
- BOOK - SUNSTAR PUBLICATIONCHAPTER - ANNUAL EXAM QUESTION PAPER MARCH-2020EXERCISE - Part-B8videos
ANNUAL EXAM QUESTION PAPER MARCH-2020
- BOOK - SUNSTAR PUBLICATIONCHAPTER - ANNUAL EXAM QUESTION PAPER MARCH-2020EXERCISE - Part-C8videos
ANNUAL EXAM QUESTION PAPER MARCH-2020
- BOOK - SUNSTAR PUBLICATIONCHAPTER - ANNUAL EXAM QUESTION PAPER MARCH -2015EXERCISE - PART-A37videos
ANNUAL EXAM QUESTION PAPER MARCH -2015
- BOOK - SUNSTAR PUBLICATIONCHAPTER - II PUC PHYSICS (P.U. BOARD LATEST MODEL QUESTIONS PAPER -2)EXERCISE - PART-D11videos
II PUC PHYSICS (P.U. BOARD LATEST MODEL QUESTIONS PAPER -2)
Similar Questions
State Coulomb.s law
01:09View SolutionDerive a relation between electric field and potential
01:07View SolutionDefine S.I unit of charge .
04:45View SolutionState Gauss theorem in electrostatics. Derive the expression for electric field at a point due to an infinitely long straight charged conductor.
04:50View SolutionShow on a graph, the variation of resistivity with temperature for a typical semiconductor.
04:13View SolutionShow on graph, the variation of resistivity with temperature for a typical semiconductor. What is the order of resistivity of an conductor, semiconductor, Insulator ?
View SolutionShow variation of resistivity of (i) conductor (i.e. copper) (ii) semiconductor (sI) with temperature is a graph. Give reason.
View SolutionExplain the variation of resistivity of conductor and semiconductor with change in termperature.
02:28View SolutionDefine the terms resistivity and conductivity and state their S. I. units. Draw a graph showing the variation of resistivity with temperature for a typical semiconductor.
03:10View SolutionShow on a graph the variation of resistivity with temperature for a typical semiconductor
View SolutionShow, on a plot, variation of resistivity of (i) a conductor, and (i) a typical semiconductor as a function of temperature.
Using the expression for the resistivity in terms of number density and relaxation time between the collisions, explain how resistivity in thc casce of a conductor increases while it decrcases in a semiconductor, with the rise of temperature.04:41View SolutionDraw a plot showing the variation of resistivity of a (i) conductor and (ii) semiconductor, with the increse in temperature.
02:20View SolutionShow on a graph, the variation of resistivity with temperature for a typical semiconductor.
02:02View SolutionDraw the graph showing the variation of resistivity with temperature for silicon.
01:12View SolutionExplain the variation of resistance of a semiconductor with temperature Also draw the graph showing the variation of resistivity of silicon with temperature
02:49View SolutionDraw a graph showing the variation of resistivity with temperature for a semiconductor.
View Solution


