The graph for photoelectric effect, which is a straight line will be betweenSolution in Kannada
Intensity of radiation and photoelectric current
Potential of anode and photoelectric current
Threshold frequency and velocity of photoelectrons
Intensity of radiations and stopping potential.
Step by step video & image solution for The graph for photoelectric effect, which is a straight line will be between by Physics experts to help you in doubts & scoring excellent marks in Class 12 exams.
Updated on:21/07/2023Similar Questions
In case of photoelectric effect, the graph of kinetic energy of photoelectron with respect to the frequency of incident radiation will be a straight line. The slope of this straight line depends on
View SolutionWhich is the graph with respect to photoelectric effect?
View SolutionIn photoelectric the slope of the straight line graph between stopping potential and frequency of incident radiation gives the ratio of Plancks constant to
View SolutionIn photoelectric effect the slope of stop of stopping potential versus frequency of incident light for a given surface will be
View SolutionThe graph between stopping potential and intensity of light in photoelectric effect is
View Solution
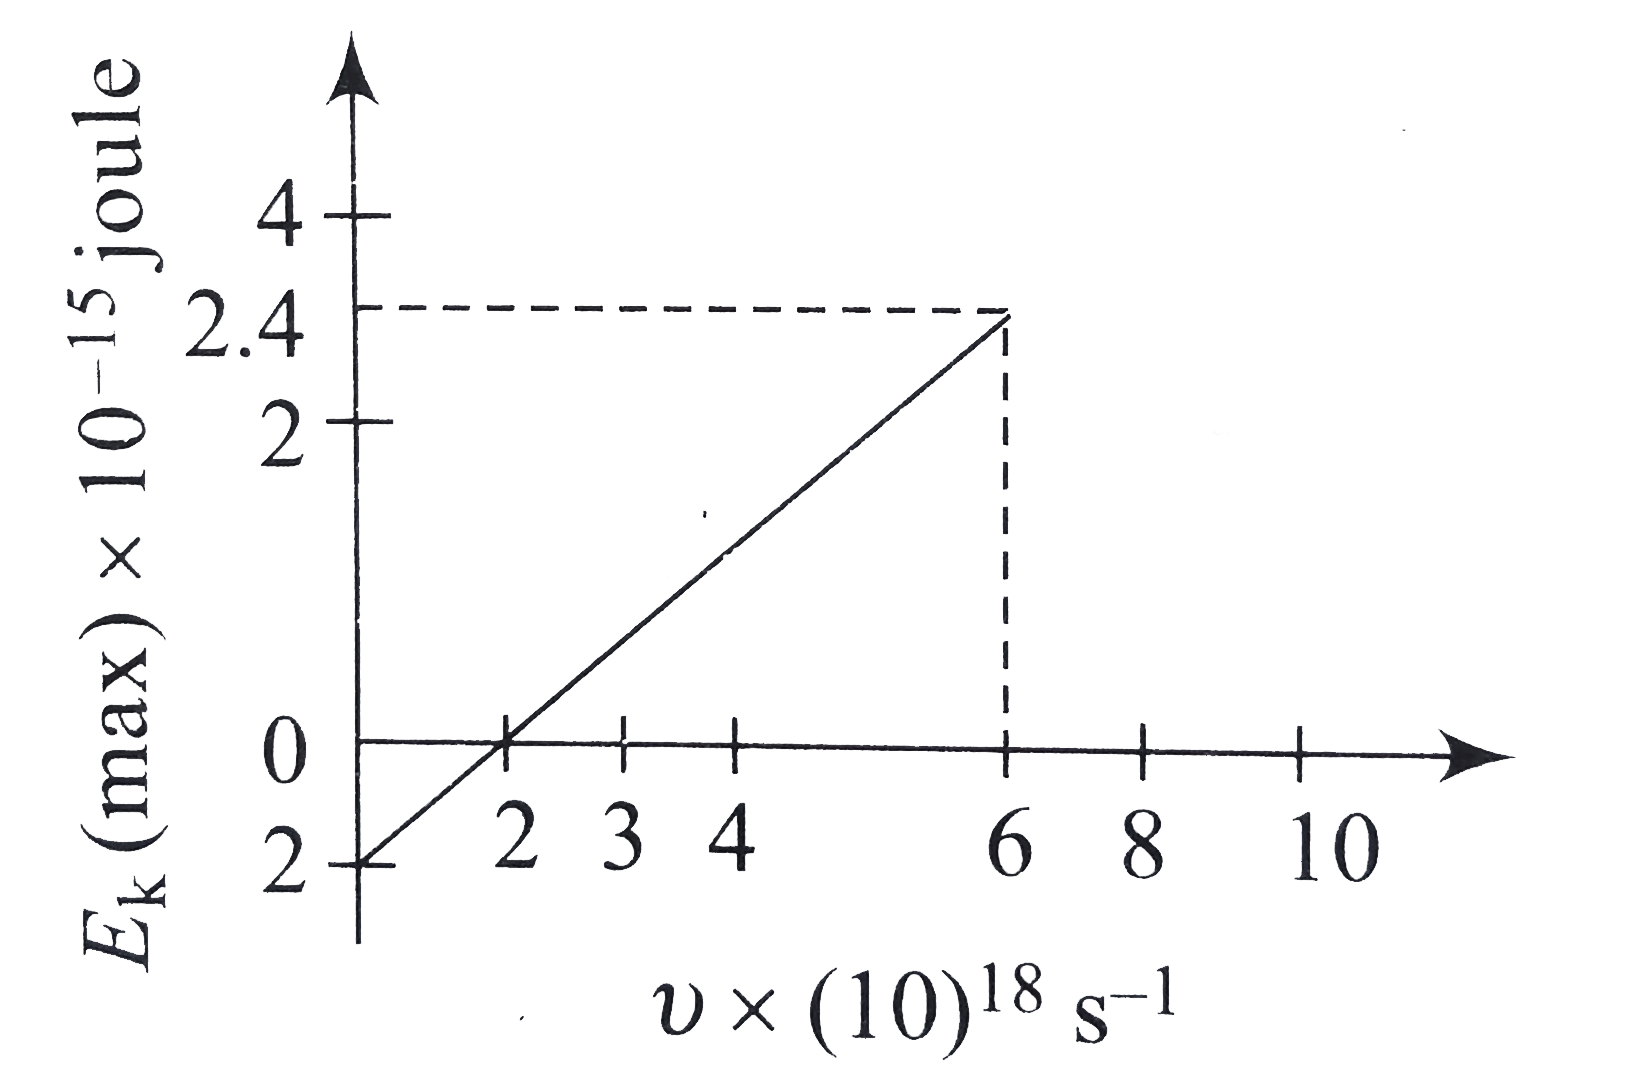
In the experiment on photoelectric effect, the graph between EK(max) and v is found to be a straight line as sshoen in fig. The threshold frequency and Planck's constant according to this graph are
View SolutionWhich is the graph with respect to photoelectric effect?
View Solution
