The following pie-chart shows the number of students who failed in different subjects in an examination. Examine the chart and answer the following questions. The total number of students who have failed is 500.
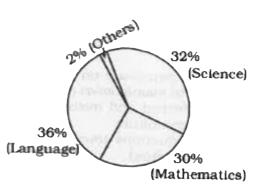
The central angle of the sector for the students who have failed in mathematics is :
30∘
100∘
105.2∘
108∘
The correct Answer is:D
Step by step video & image solution for The following pie-chart shows the number of students who failed in different subjects in an examination. Examine the chart and answer the following questions. The total number of students who have failed is 500. The central angle of the sector for the students who have failed in mathematics is : by Maths experts to help you in doubts & scoring excellent marks in Class 14 exams.
Topper's Solved these Questions
- BOOK - KIRAN PUBLICATIONCHAPTER - STATISTICS AND DATA INTERPRETATIONEXERCISE - TYPE-VIII8videos
STATISTICS AND DATA INTERPRETATION
- BOOK - KIRAN PUBLICATIONCHAPTER - STATISTICS AND DATA INTERPRETATIONEXERCISE - TYPE-VI86videos
STATISTICS AND DATA INTERPRETATION
- BOOK - KIRAN PUBLICATIONCHAPTER - SIMPLIFICATIONEXERCISE - TEST YOURSELF25videos
SIMPLIFICATION
- BOOK - KIRAN PUBLICATIONCHAPTER - TIME AND DISTANCEEXERCISE - Type -XI74videos
TIME AND DISTANCE
Similar Questions
The following pie-chart shows the number of students who failed in different subjects in an examination. Examine the chart and answer the following questions. The total number of students who have failed is 500.
The number of students failed in science is less than the number of students failed in all other subjects by :View SolutionDirection :- The following pie-chart shows the number of students who failed in different subjects in an examination. Examine the chart and answer the following questions. The total number of students who have failed is 500.
The number of students failed in Science is less than the number of student failed in all other subects byView Solution
Knowledge Check
- Question 1 - Select One
The following pie-chart shows the study-time of different subjects of a student in a day. Study the pie-chart and answer the following questions
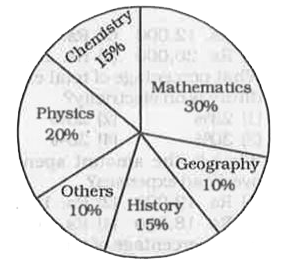
If the student studied 10 hours in a day, then he / she studied mathematics forA3 hoursB103 hoursC13 hoursD310 hours - Question 2 - Select One
Study the Pie chart carefully and answer the questions.
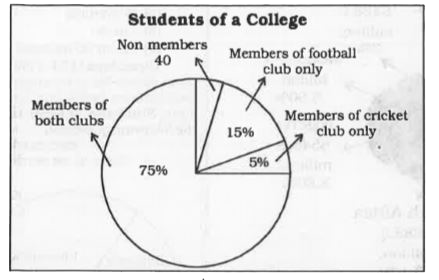
The number of students who are members of both the club is :A500B650C550D600 - Question 3 - Select One
Study the Pie chart carefully and answer the questions.
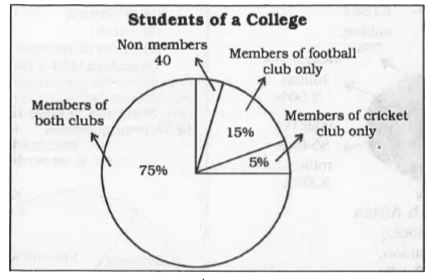
Number of students who are members of cricket club only :A35B40C42D41
The following piechart shows the number of students who failed in different subjects in an examination. Examine the chart and answer the questions 5 to the total number of students who have failed is 500.

Number of students who failed in Mathema tics is less than the students who did not qualify in language is -View SolutionThe following piechart shows the number of students who failed in different subjects in an examination. Examine the chart and answer the questions 5 to the total number of students who have failed is 500.

Total number of students who did not qualify in Mathematics or Language or Science, isView SolutionFind the error in the given sentence I am sorry for the students who failed in the examination .
View SolutionFollowing pie chart shows the degree wise distribution of the students of a school using different transport while going to school. Read the chart answer the questions carefully.
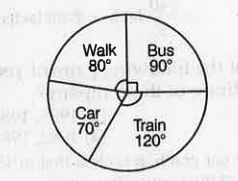
Total number of students = 2160
The number of students who come to school by car, isView SolutionThe following pie chart shows the performance in an examination in a particular year for 360 students.The total number of students who have passed in 2nd and 3rd division is
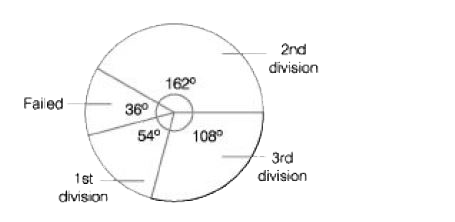 View Solution

