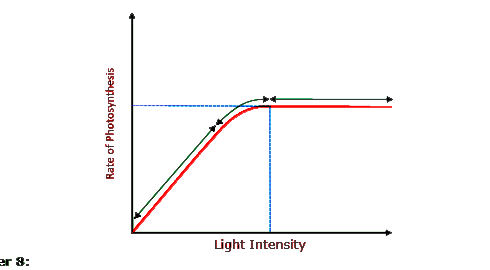
Figure shows the effect of light on the rate of photosynthesis. Based on the graph, answer the following questions:
(a) At which points (A, B or C) in the curve is light a limiting factor?
(b) What could be the limiting factor/s in region A?
(c) What do C and D represent on the.curve?

(a) B
(b) Carbon dioxide concentration and quantity of water may be limiting factor in regions A.
(c) C represents that rate of photosynthesis remains the same, even by increasing light intensity because some other factor like CO2 has become limiting. D is the light saturation point i.e., light intensity when the maximum amount of photosynthesis is achieved.
Topper's Solved these Questions
- PHOTOSYNTHESIS IN HIGHER PLANTS Book:ICSEChapter:PHOTOSYNTHESIS IN HIGHER PLANTS Exercise:REVIEW QUESTIONS (QUESTION BASED ON EXPERIMENTS)
Explore 7 Videos
- PHOTOSYNTHESIS IN HIGHER PLANTS Book:ICSEChapter:PHOTOSYNTHESIS IN HIGHER PLANTS Exercise:REVIEW QUESTIONS (LONG ANSWER TYPE QUESTIONS)
Explore 11 Videos
- PHOTOMORPHOGENESIS IN PLANTSBook:ICSEChapter:PHOTOMORPHOGENESIS IN PLANTSExercise:REVIEW QUESTIONS (LONG ANSWER TYPE QUESTIONS)
Explore 6 Videos
- PLANT GROWTH AND DEVELOPMENTBook:ICSEChapter:PLANT GROWTH AND DEVELOPMENTExercise:NCERT EXERCISES WITH ANSWERS (DIFFERENTIATE BETWEEN)
Explore 11 Videos
Similar Questions
Figure 13.10 shows the effect of light on the rate of photosynthesis. Based on the graph, answer the following questions:
(a) At which point/s (A, B or C) in the curve is light a limiting factor?
(b) What could be the limiting factor/s in region A?
(c) What do C and D represent on the curve?
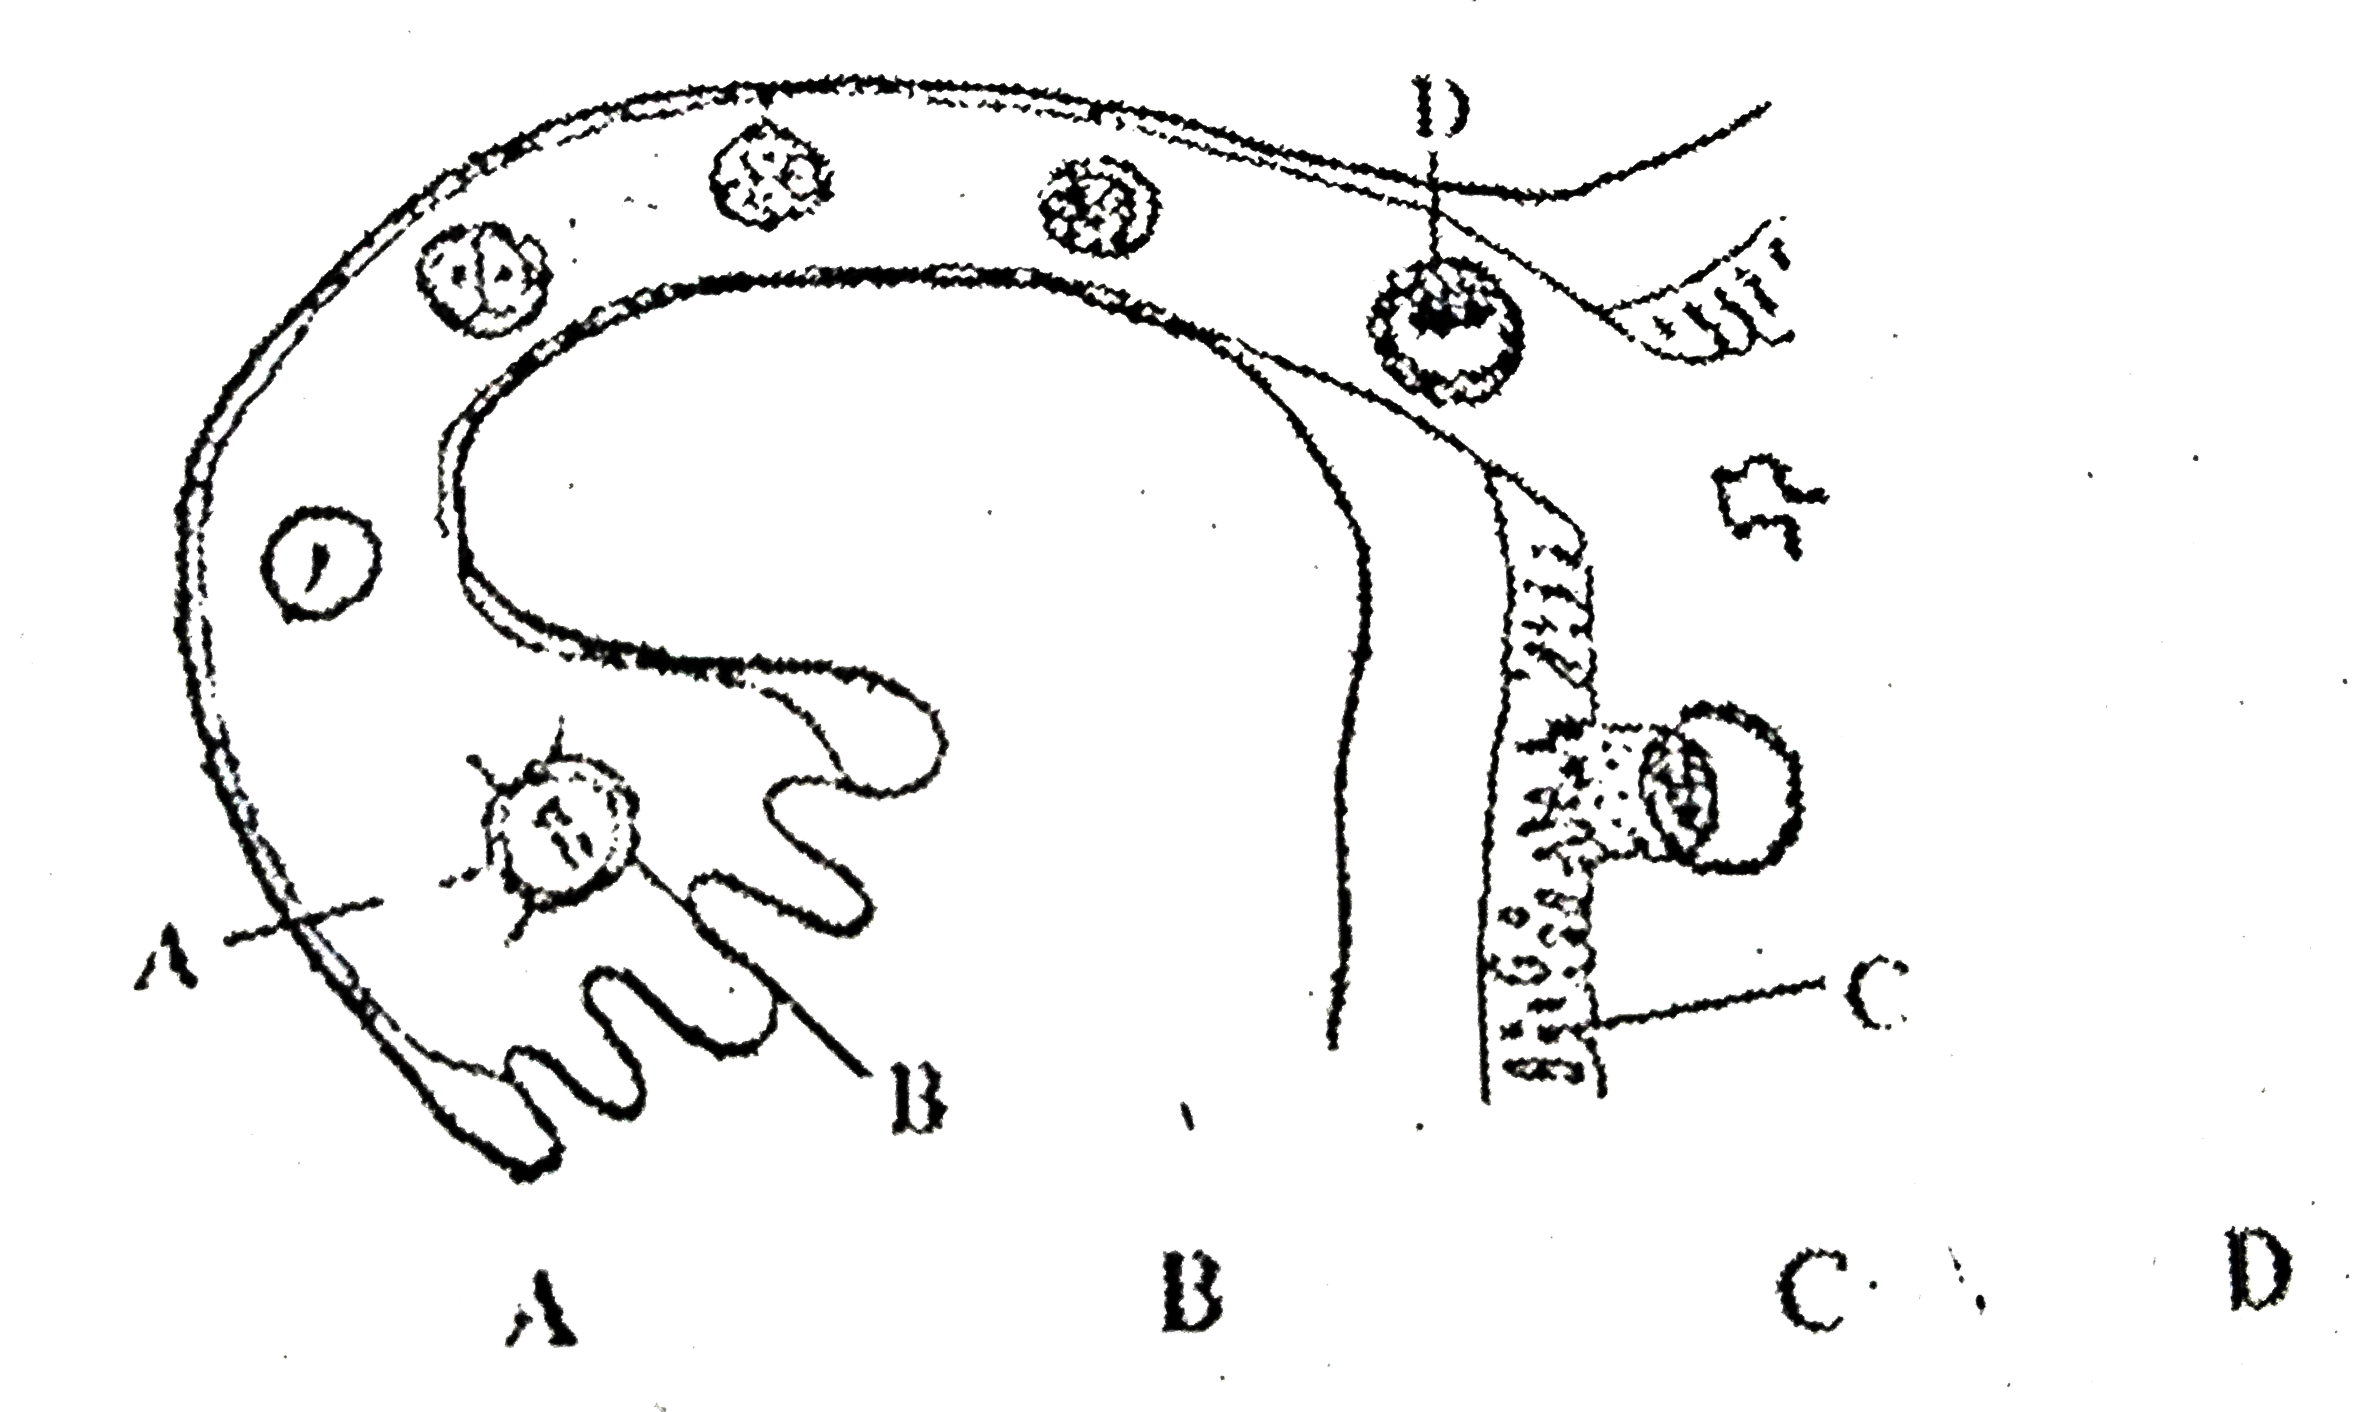
View SolutionWhat do A, B ,C and D represent ?

View SolutionWhat do A, B, C and D represent?
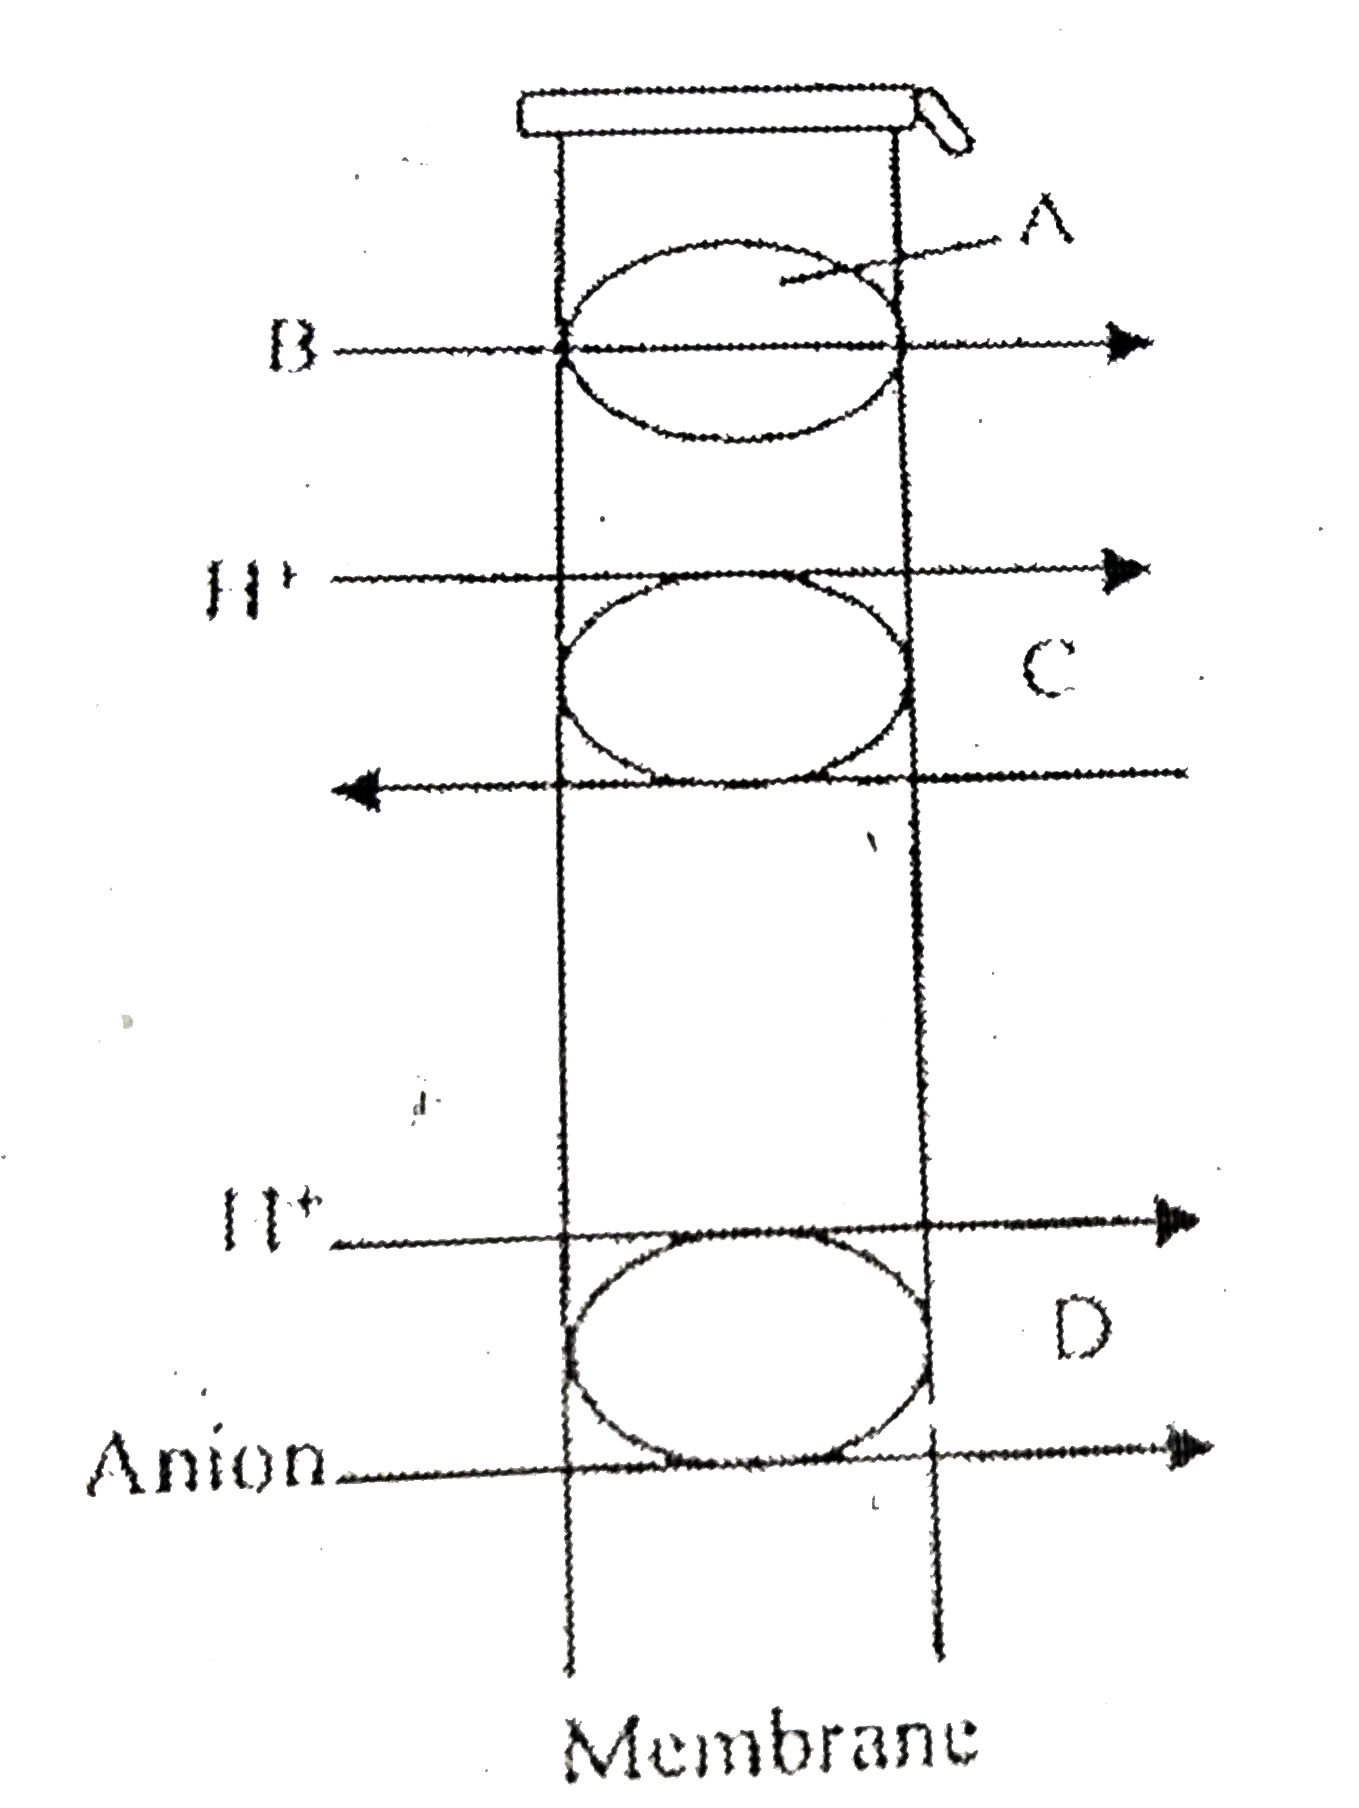
View SolutionWhat do A, B, C, and D represent in the following figure.
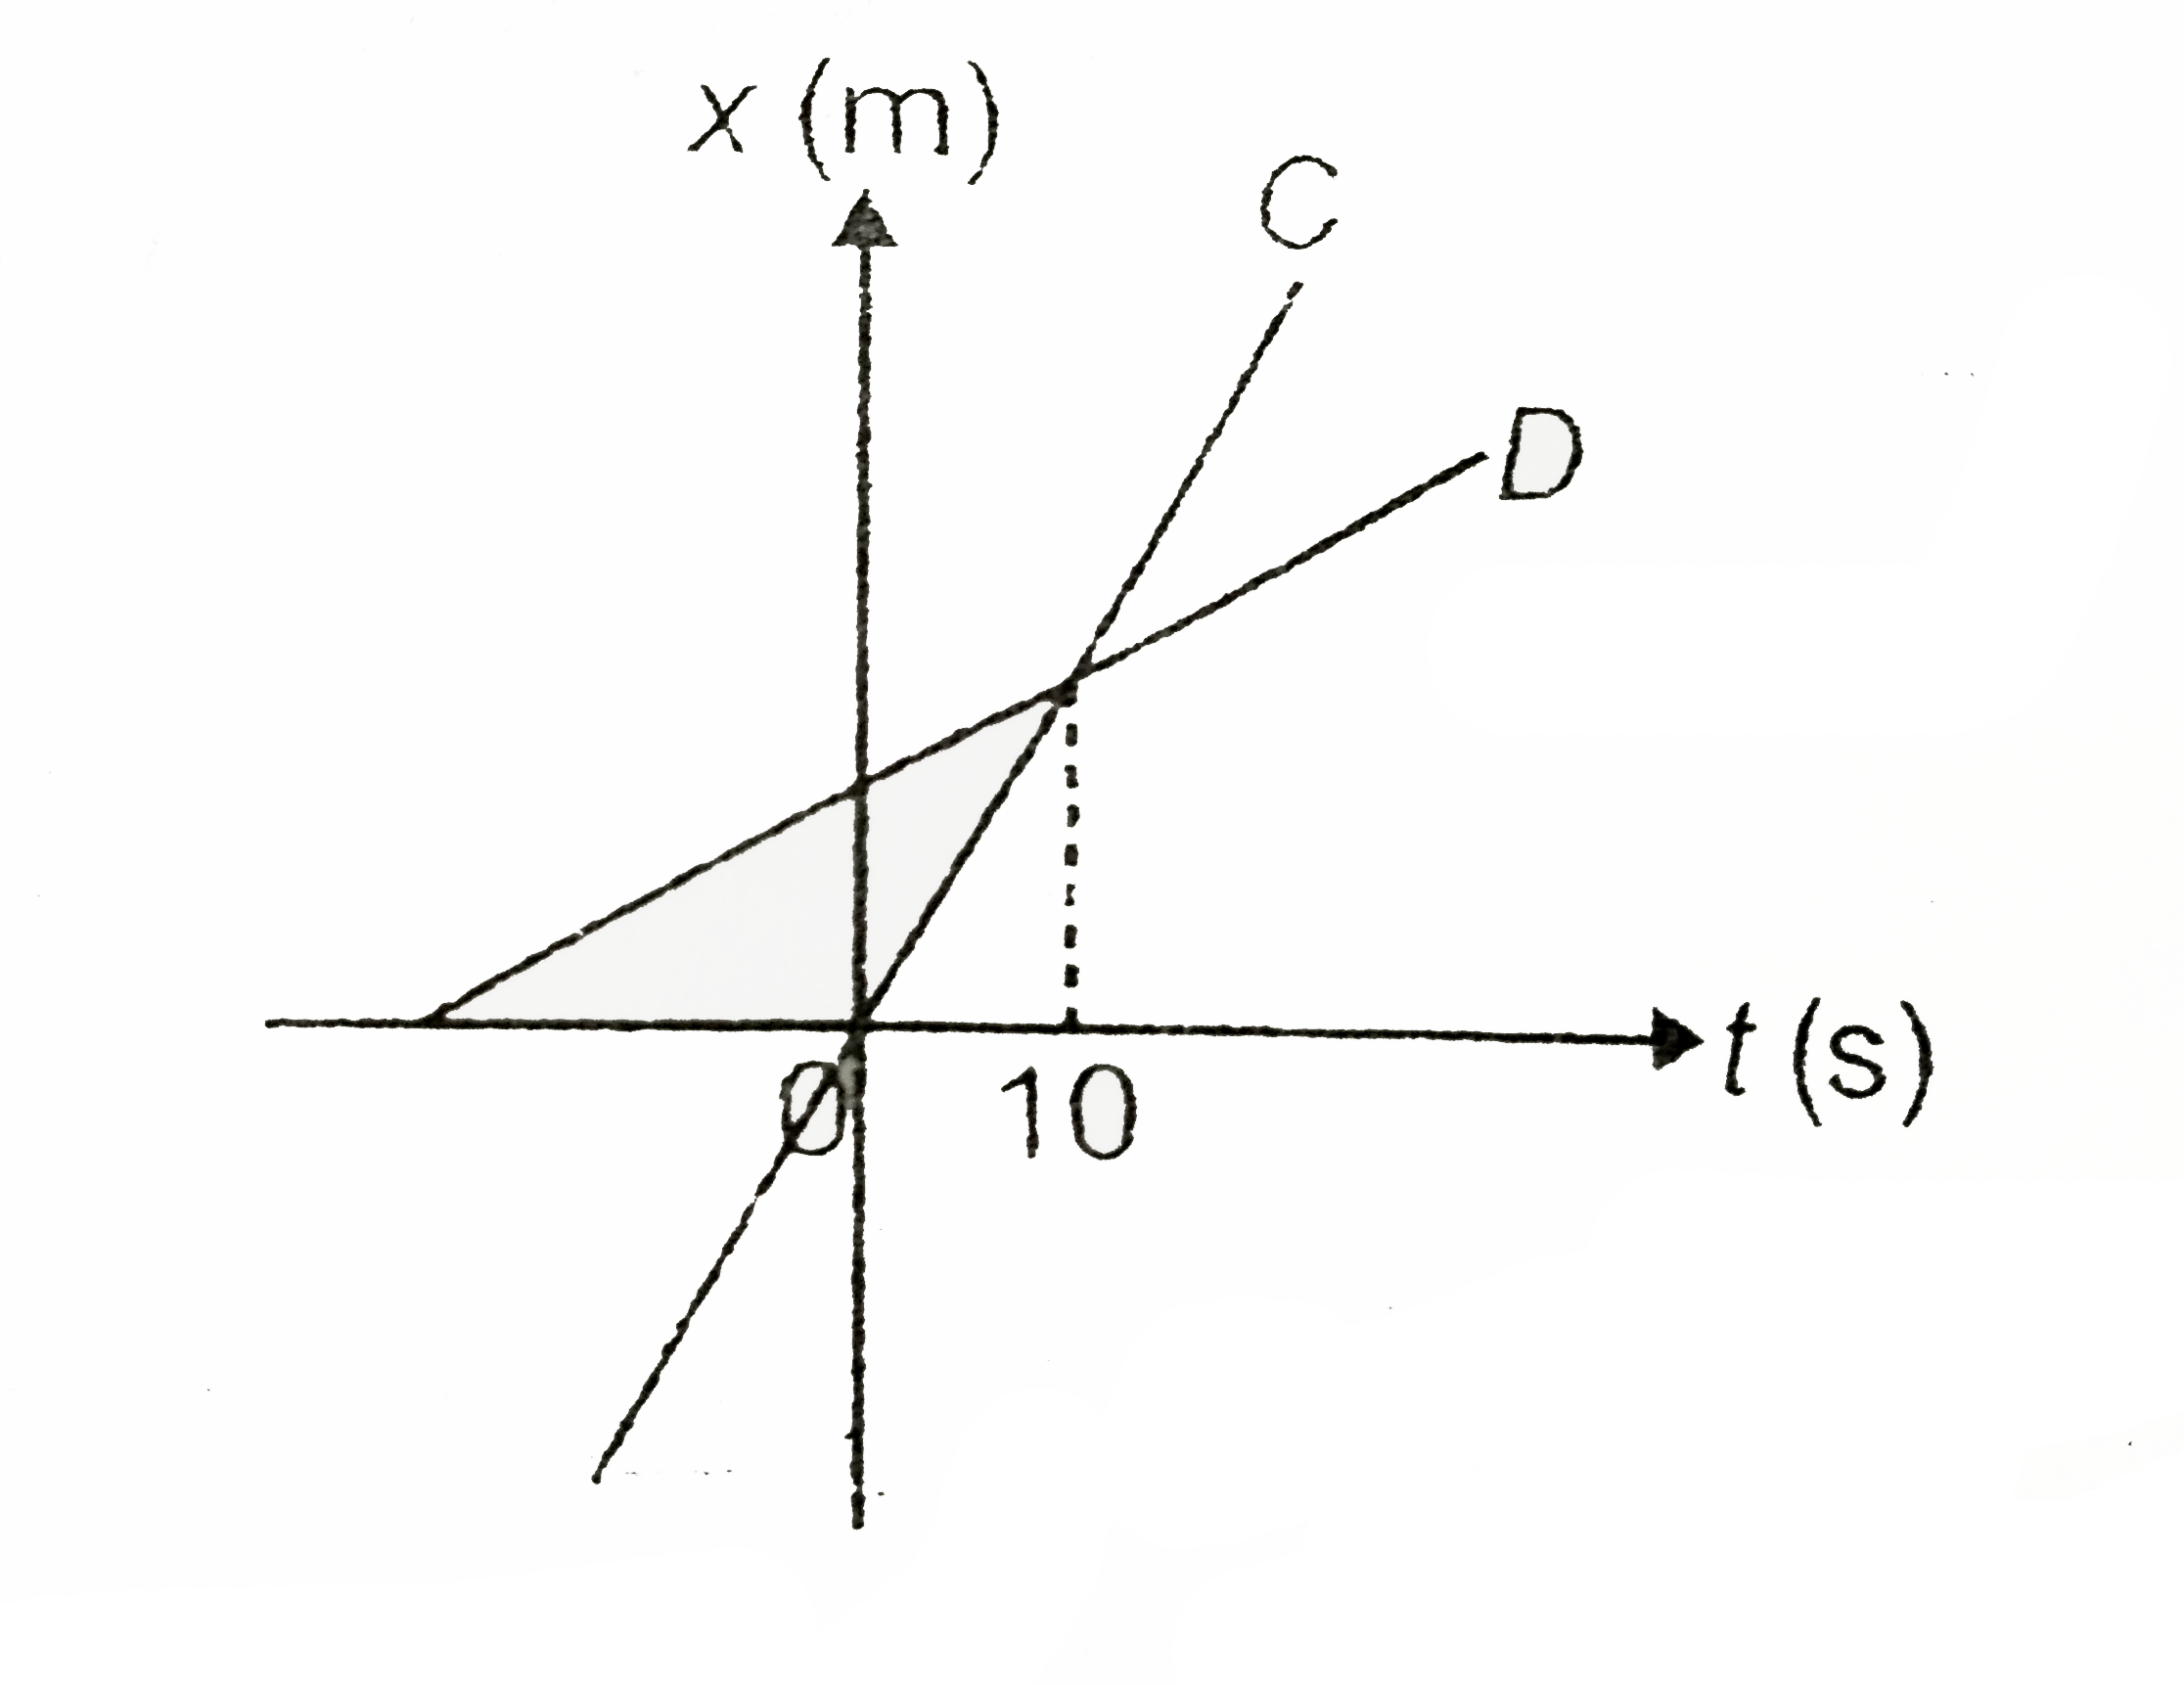
View SolutionThe figure shows position time graph of two riders C and D. Based on the information represented by the graph, answer the following questions.
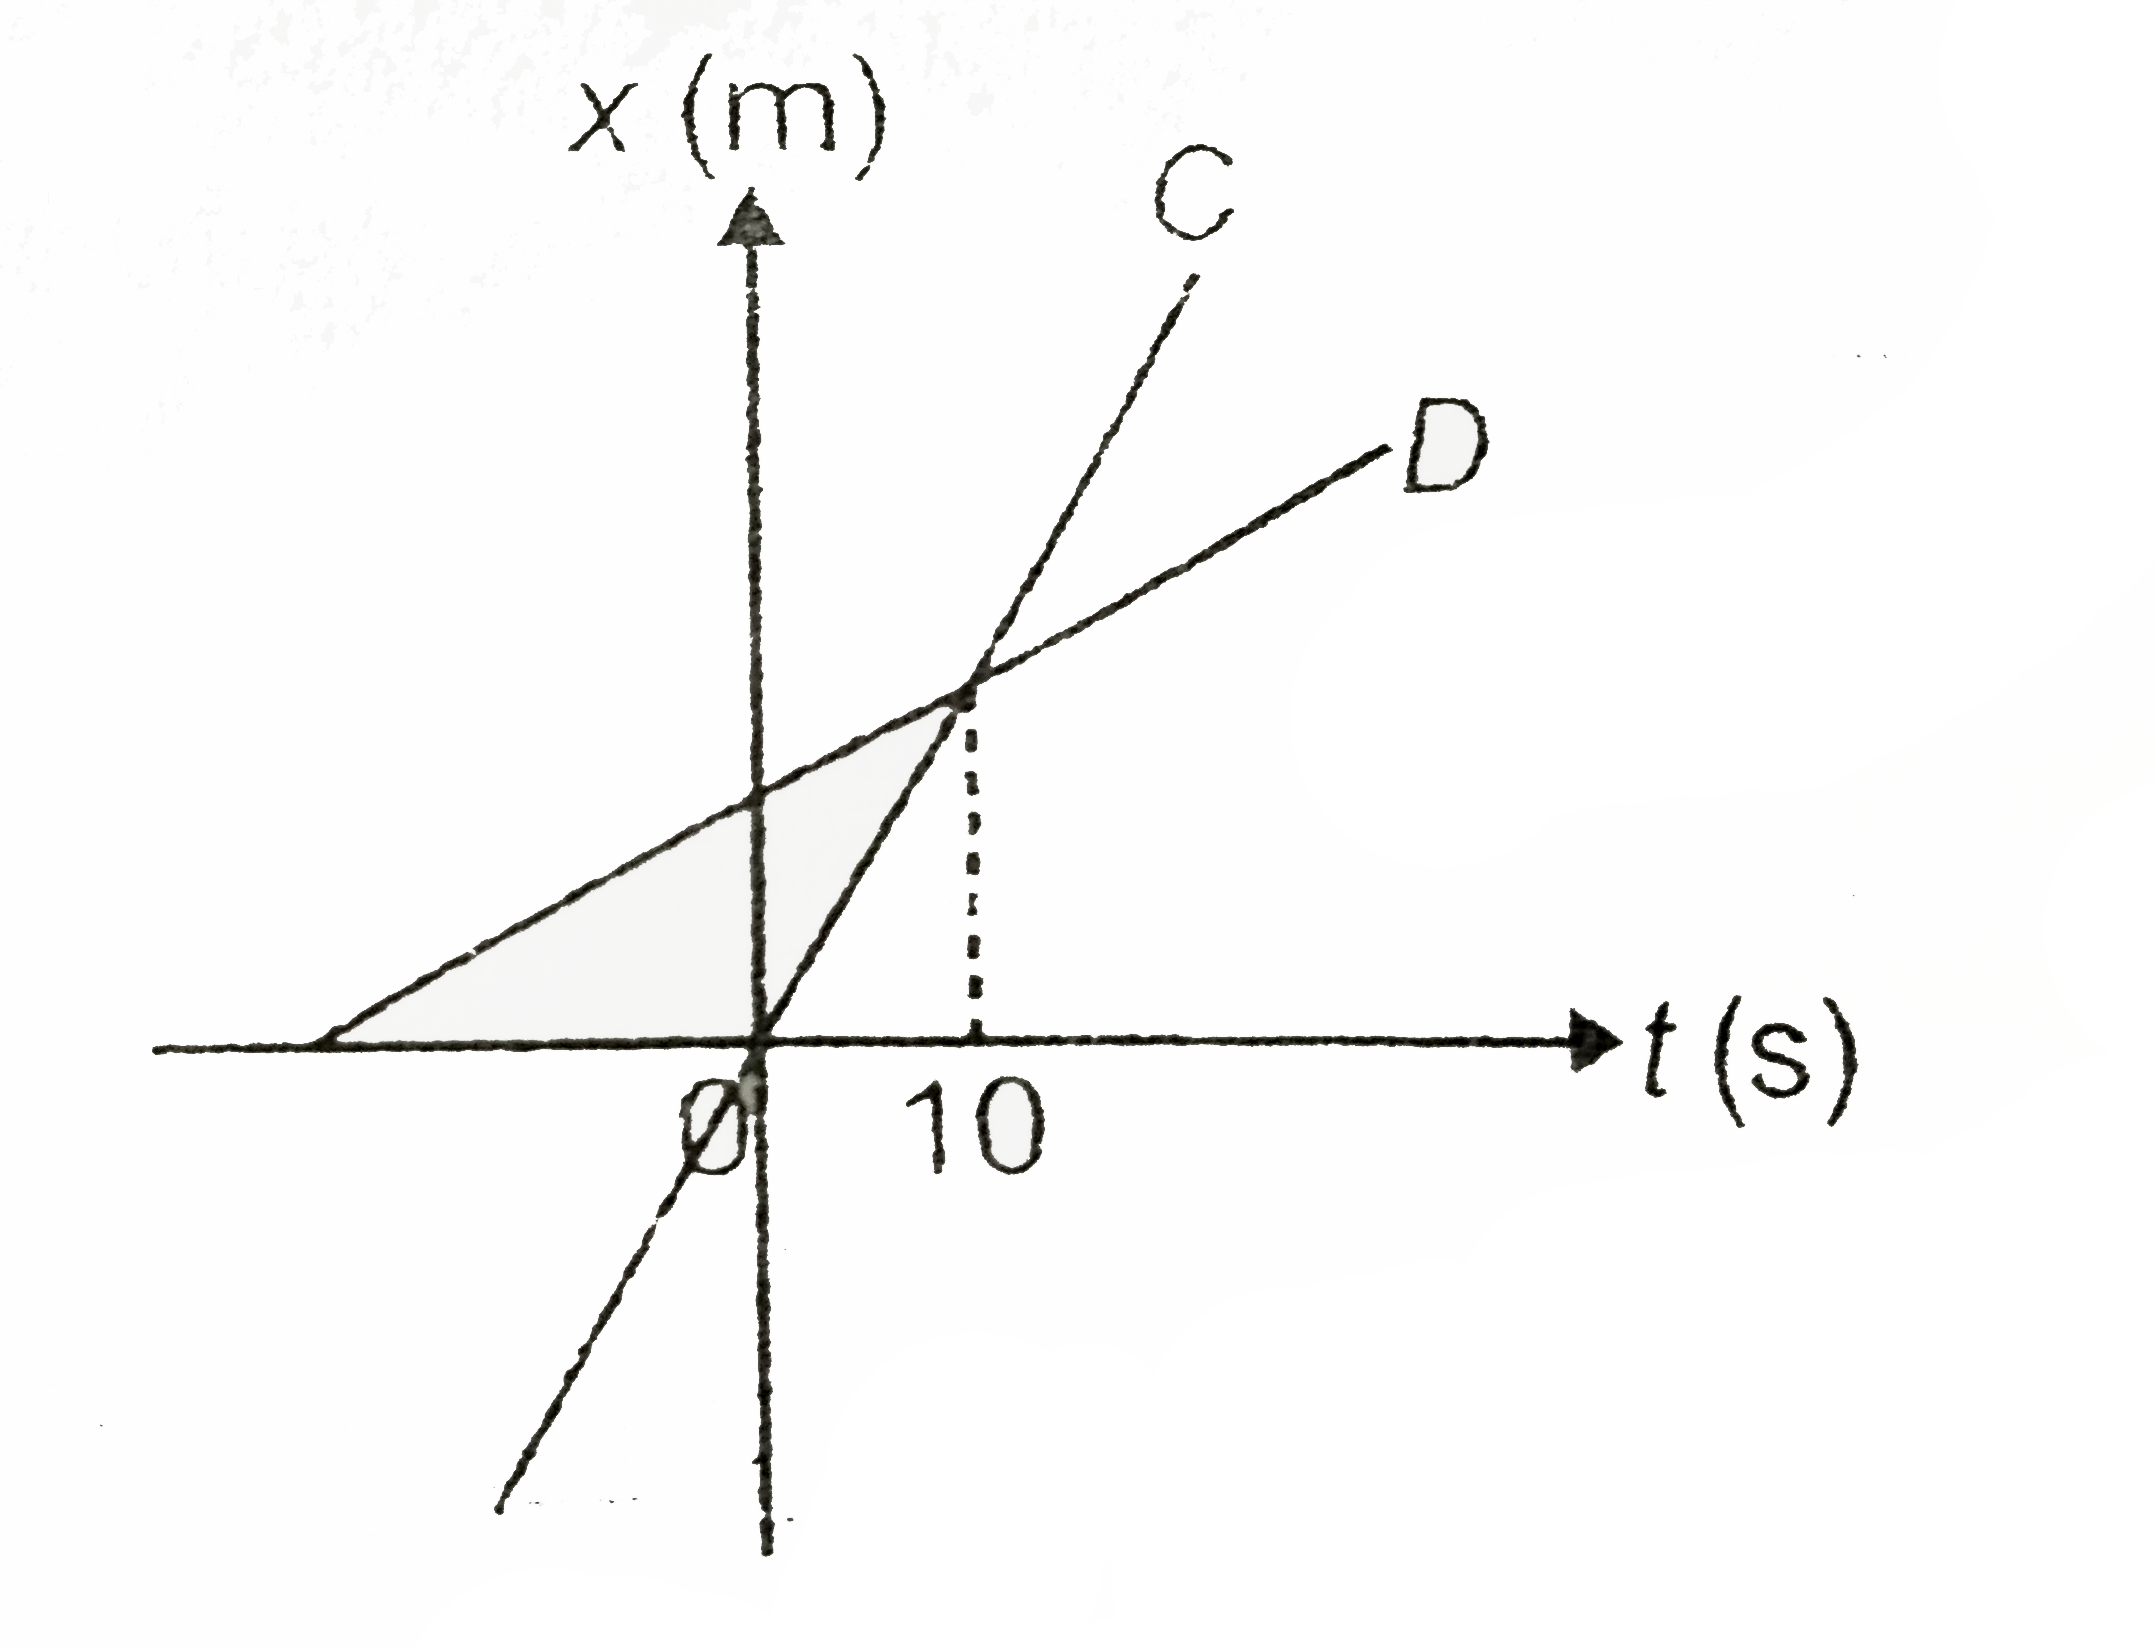
At t = 0 s
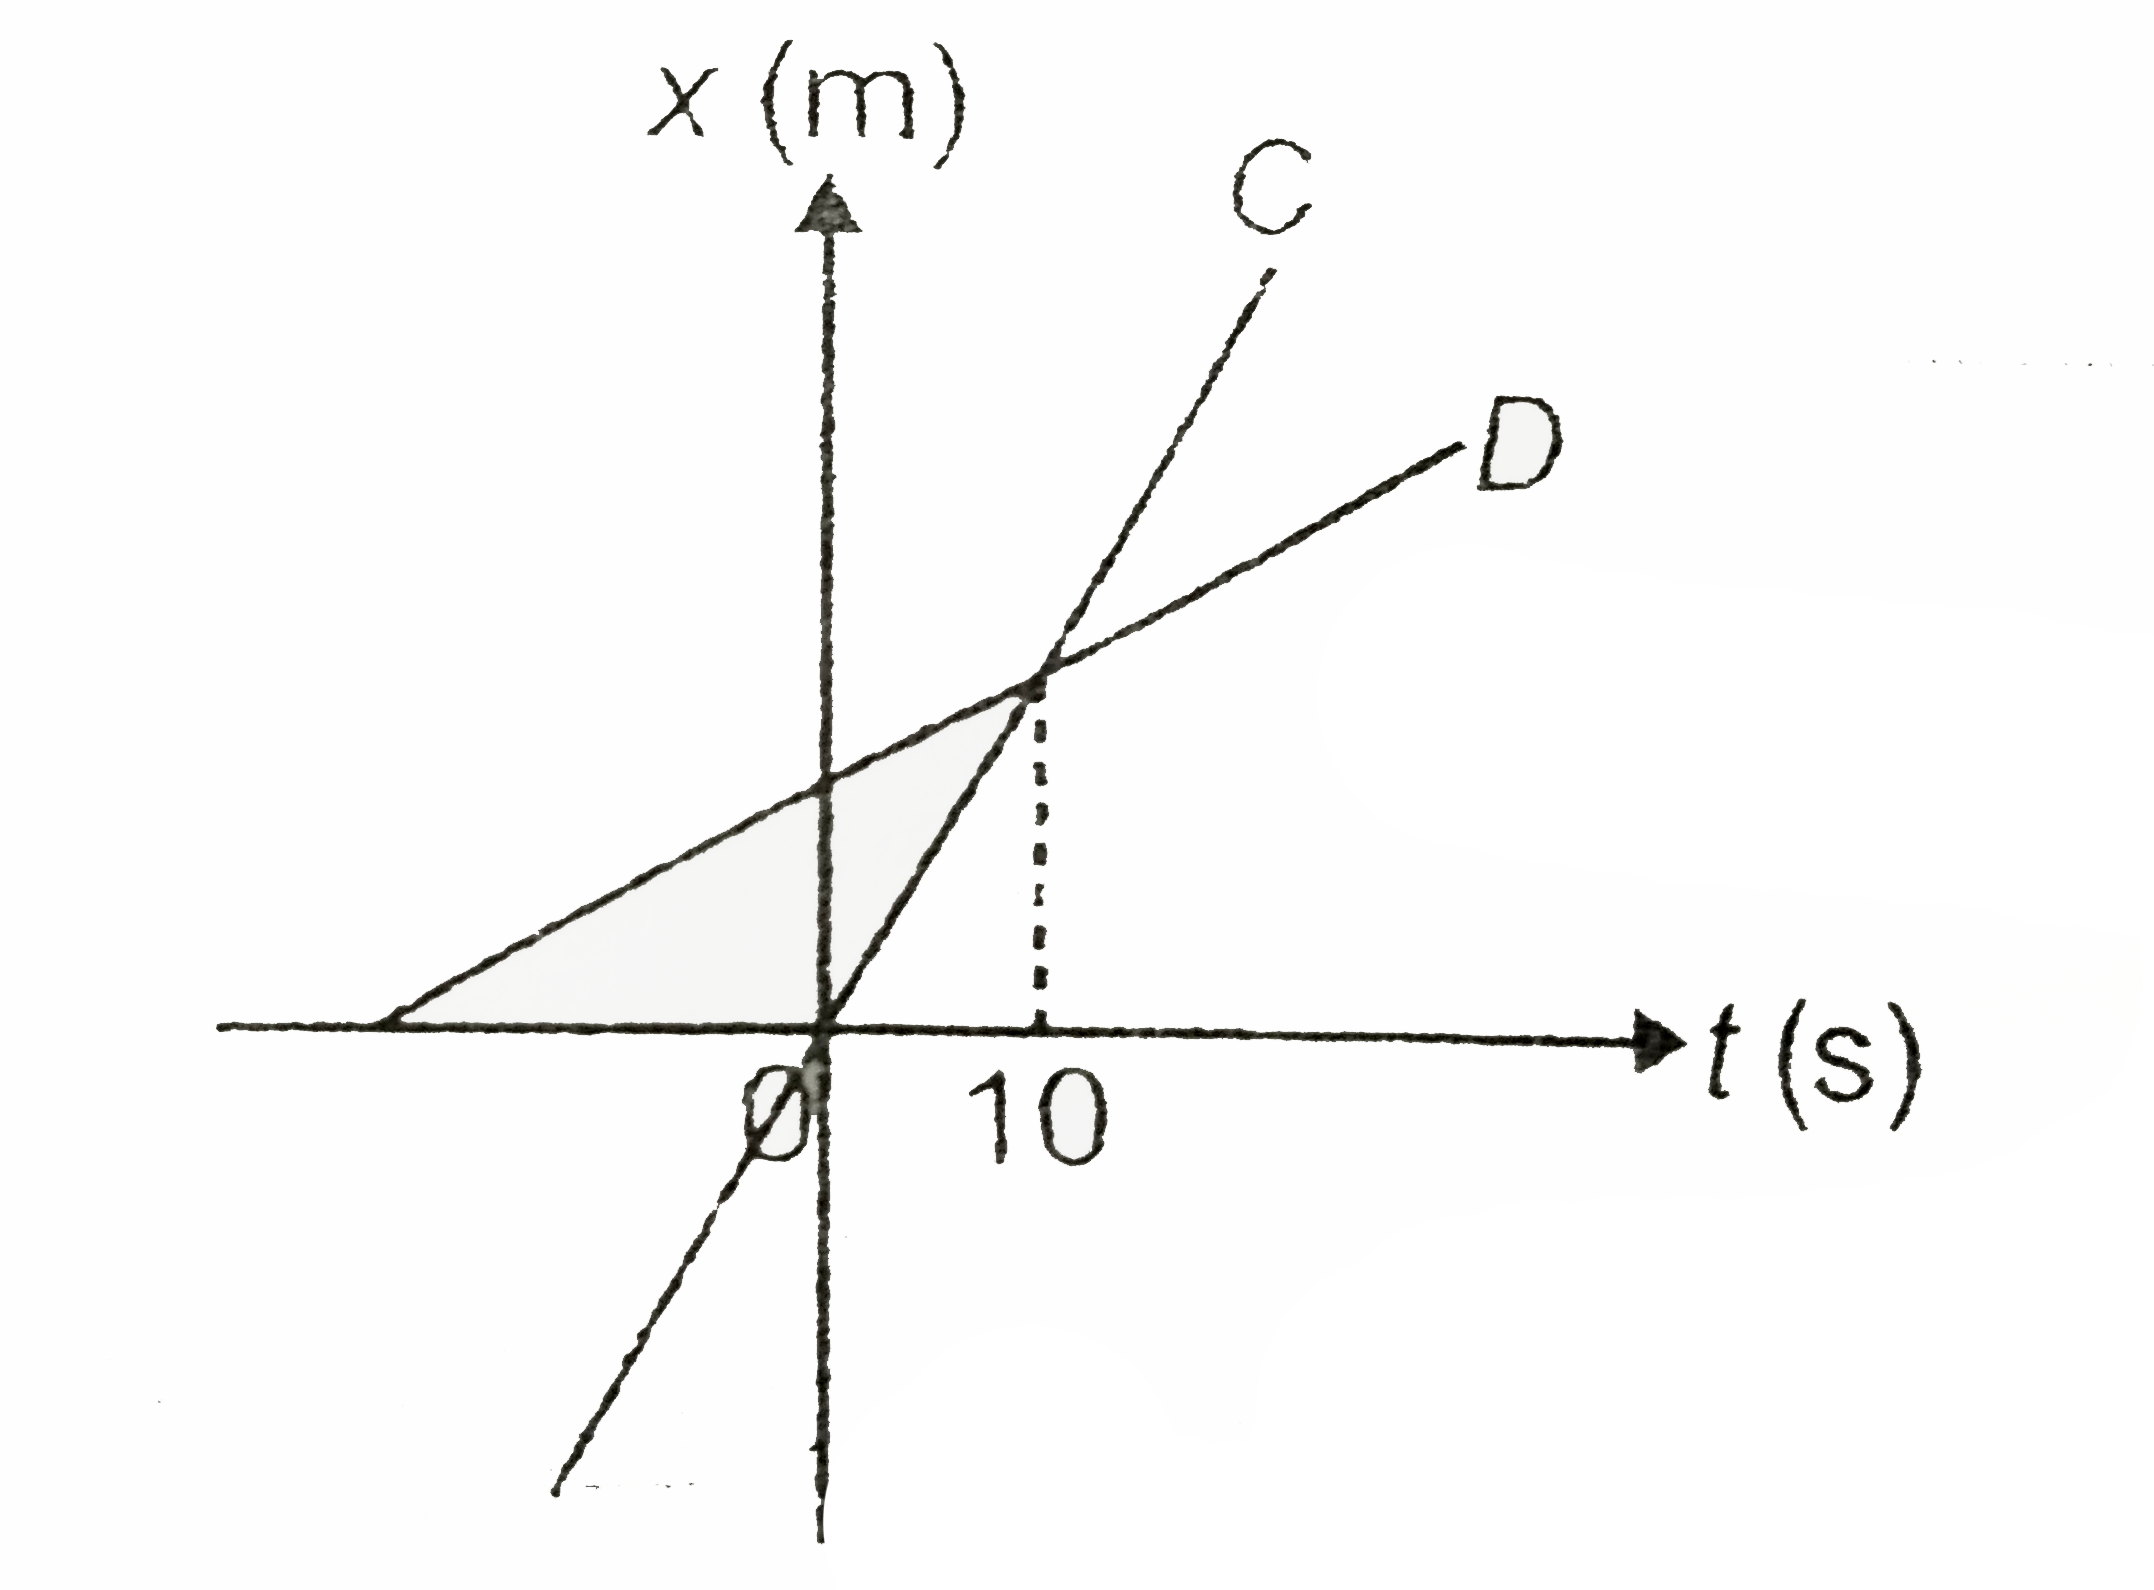
View SolutionThe figure shows position time graph of two riders C and D. Based on the information represented by the graph, answer the following questions.
At t = 10 s
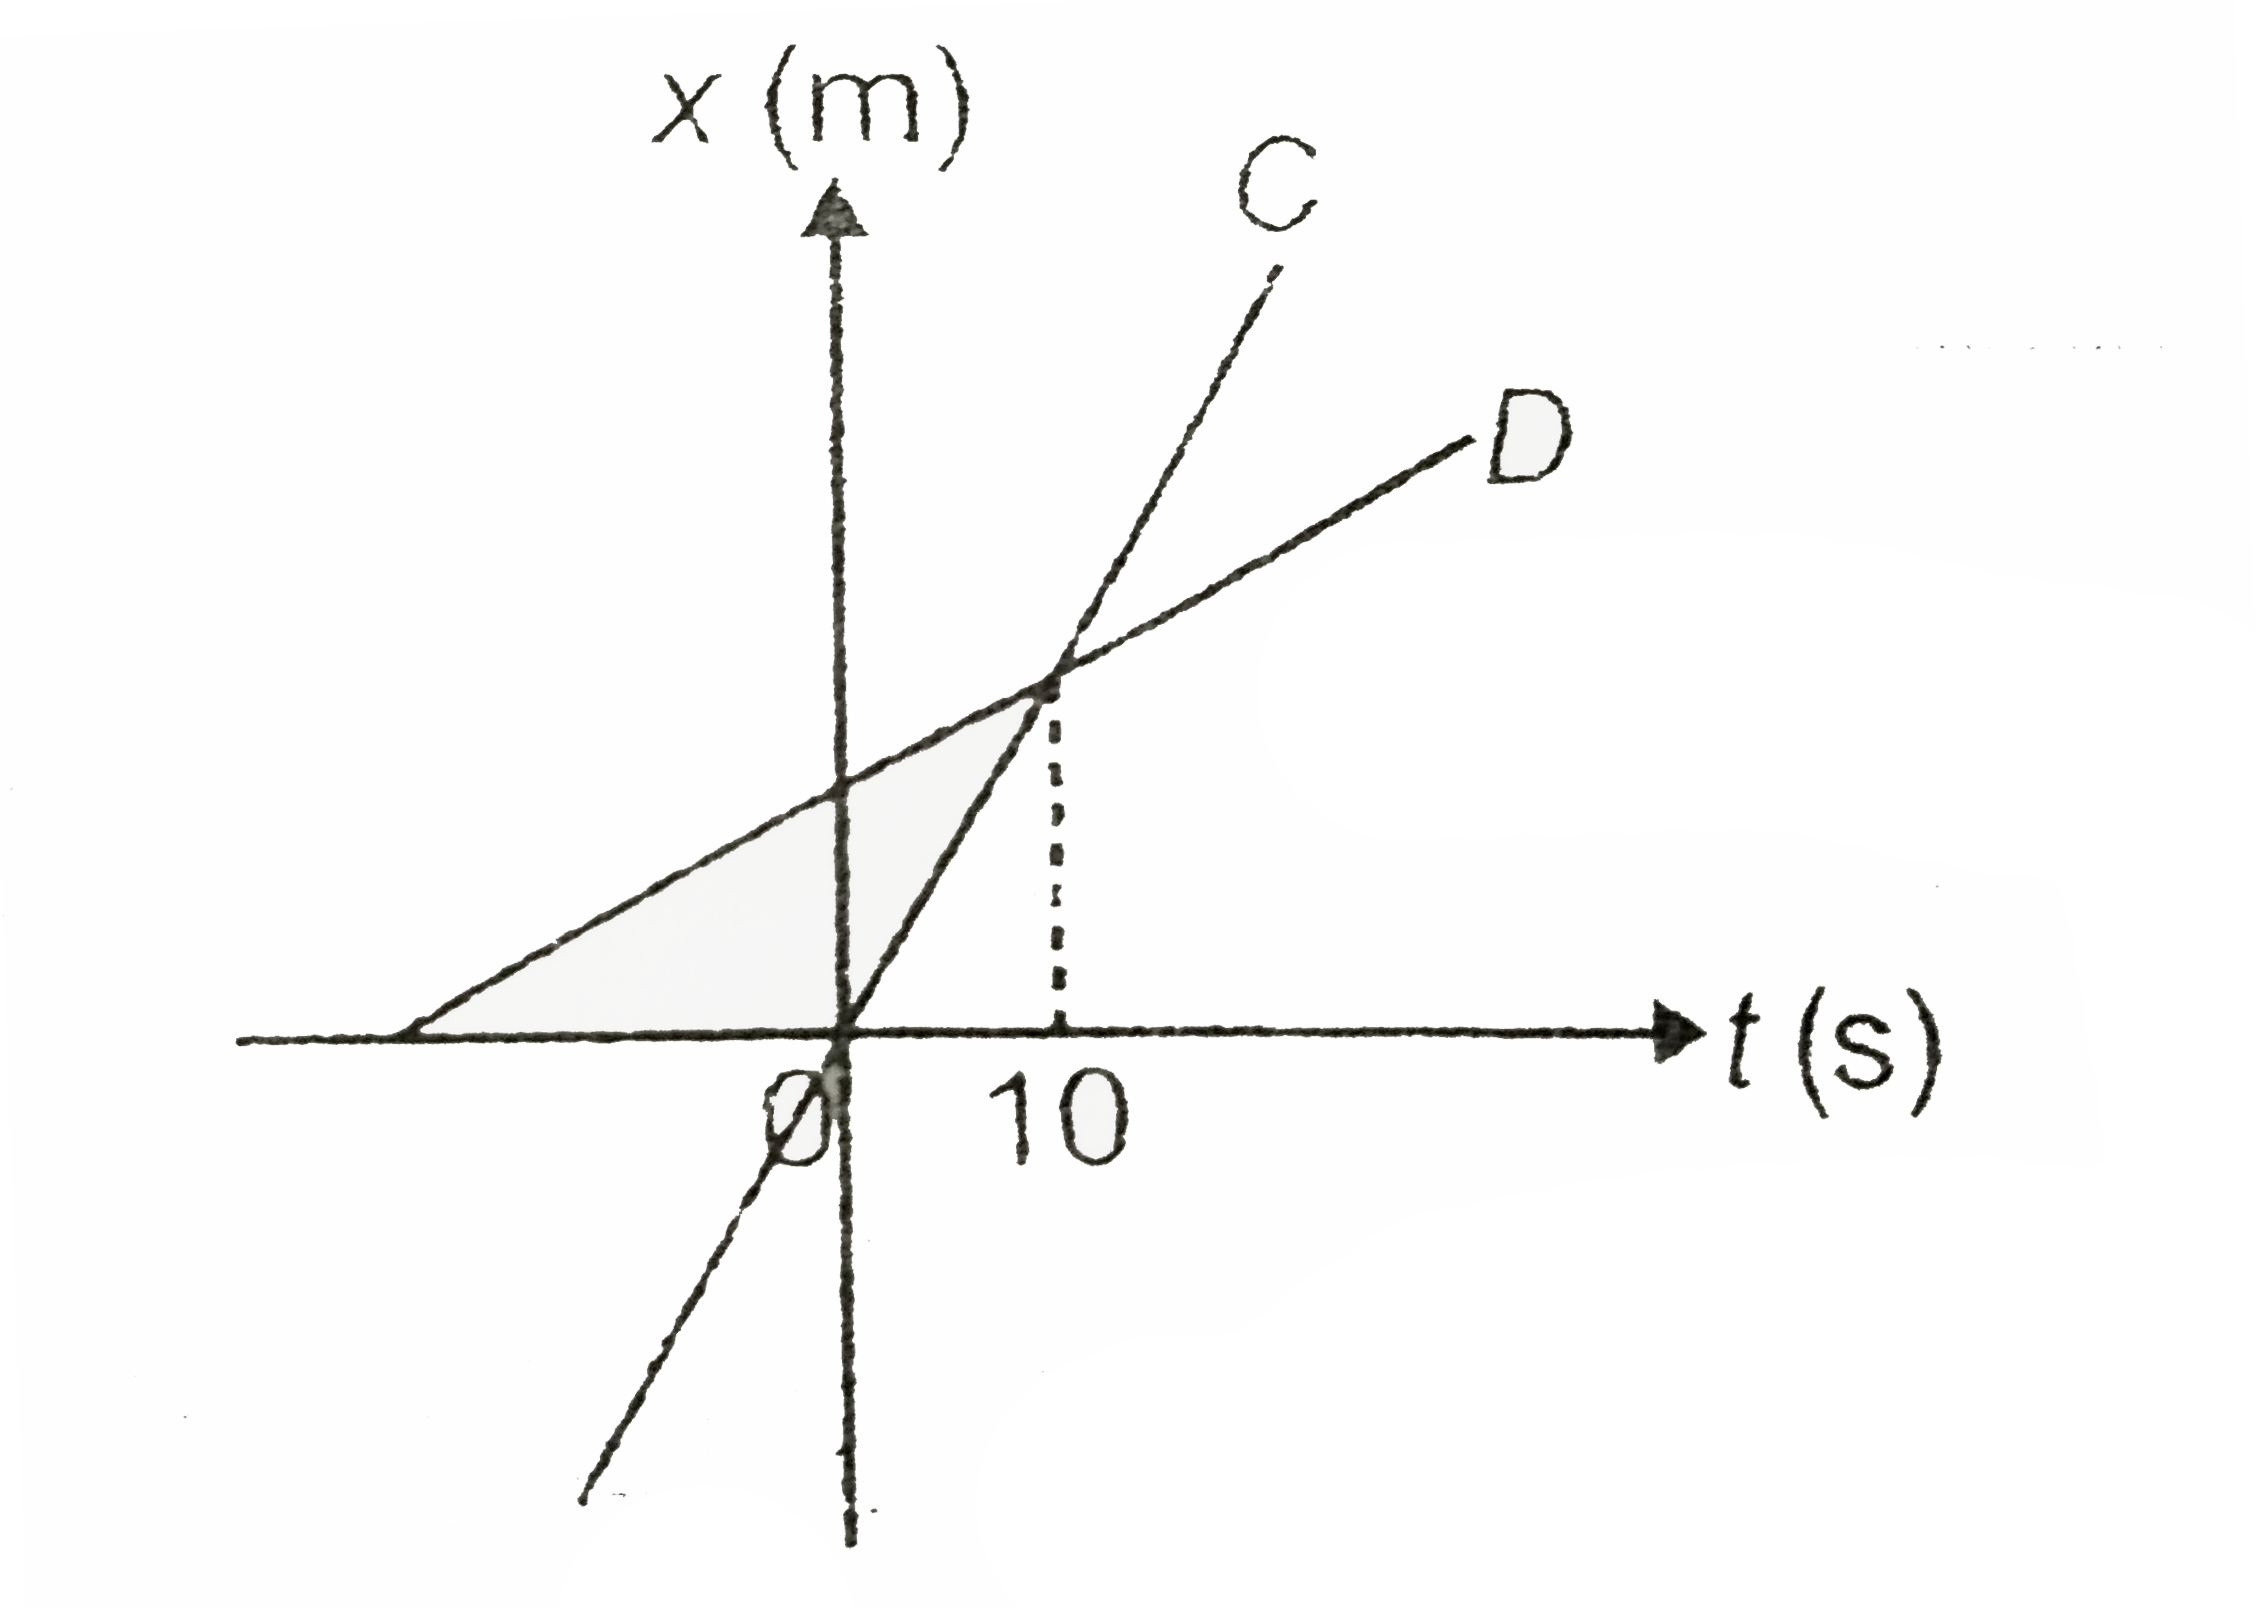
View SolutionThe figure shows position time graph of two riders C and D. Based on the information represented by the graph, answer the following questions.
At t = 0 s
View SolutionThe figure shows position time graph of two riders C and D. Based on the information represented by the graph, answer the following questions.
At t = 0 s
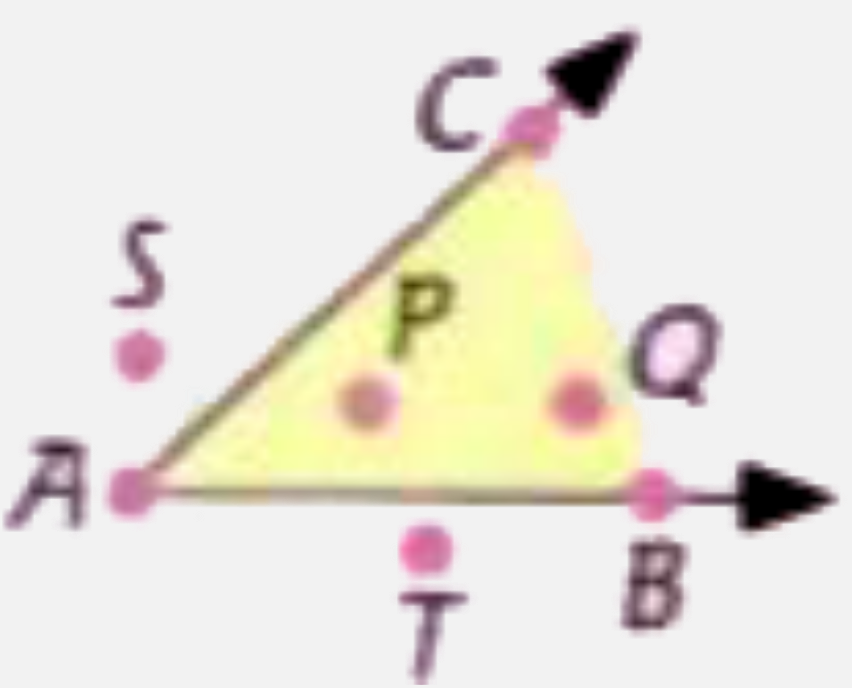
View SolutionAnswer the following based on Fig. C .
(a) Which points lie in the interior of the angle ?
(b ) Which points lie in the exterior of the angle
View SolutionObserve the cell drawn and answer the following questions:
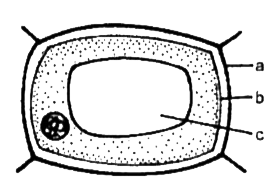
Label parts a, b, and c. If this cell is kept in a concentrated sugar solution., what will happen, to parts 'b' and 'c'?
View Solution