The figure shows position time graph of two riders C and D. Based on the information represented by the graph, answer the following questions.
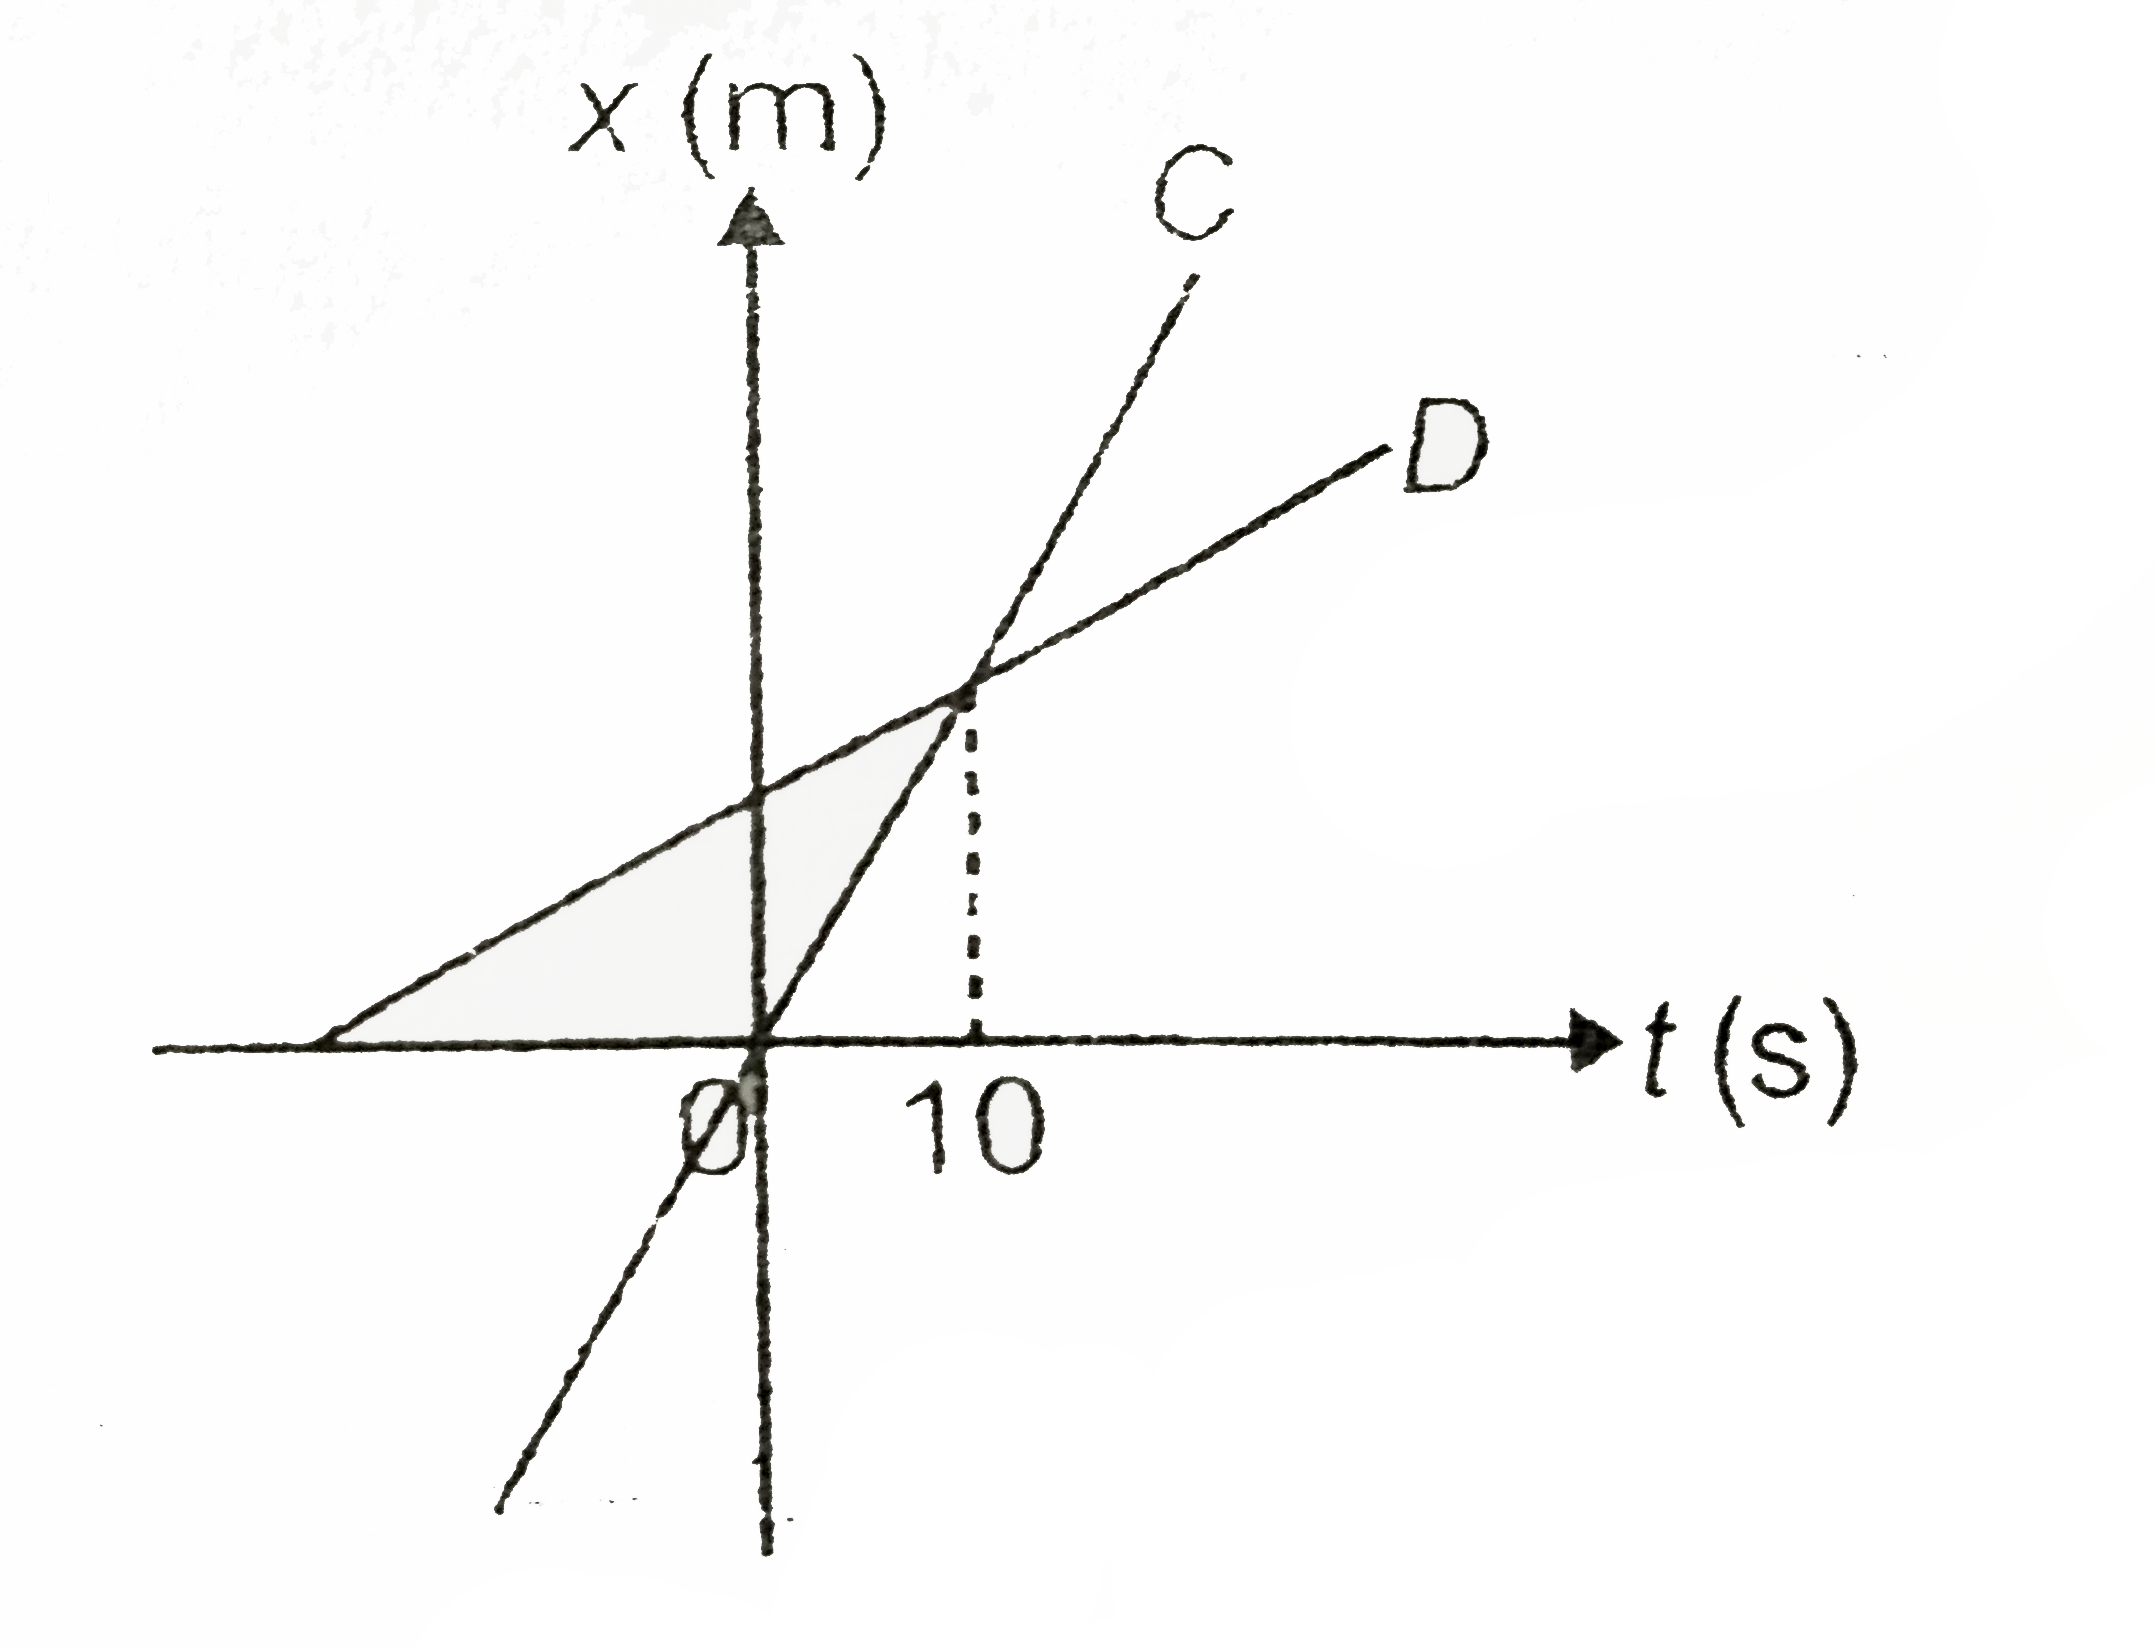
At t = 0 s
C has a greater velocity than D
D has greater velocity than C
C and D have the same velocity
C is accelerating
The correct Answer is:A
Step by step video & image solution for The figure shows position time graph of two riders C and D. Based on the information represented by the graph, answer the following questions. At t = 0 s by Physics experts to help you in doubts & scoring excellent marks in Class 12 exams.
Topper's Solved these Questions
- BOOK - AAKASH INSTITUTE ENGLISHCHAPTER - MOTION IN STRAIGHT LINEEXERCISE - Assignment (SECTION - E)8videos
MOTION IN STRAIGHT LINE
- BOOK - AAKASH INSTITUTE ENGLISHCHAPTER - MOTION IN STRAIGHT LINEEXERCISE - Assignment (SECTION - F)2videos
MOTION IN STRAIGHT LINE
- BOOK - AAKASH INSTITUTE ENGLISHCHAPTER - MOTION IN STRAIGHT LINEEXERCISE - Assignment (SECTION - C)7videos
MOTION IN STRAIGHT LINE
- BOOK - AAKASH INSTITUTE ENGLISHCHAPTER - MOTION IN A STRAIGHT LINEEXERCISE - ASSIGNMENT (SECTION - D)15videos
MOTION IN A STRAIGHT LINE
- BOOK - AAKASH INSTITUTE ENGLISHCHAPTER - MOVING CHARGE AND MAGNESIUMEXERCISE - SECTION D16videos
MOVING CHARGE AND MAGNESIUM
Similar Questions
The figure shows position time graph of two riders C and D. Based on the information represented by the graph, answer the following questions.
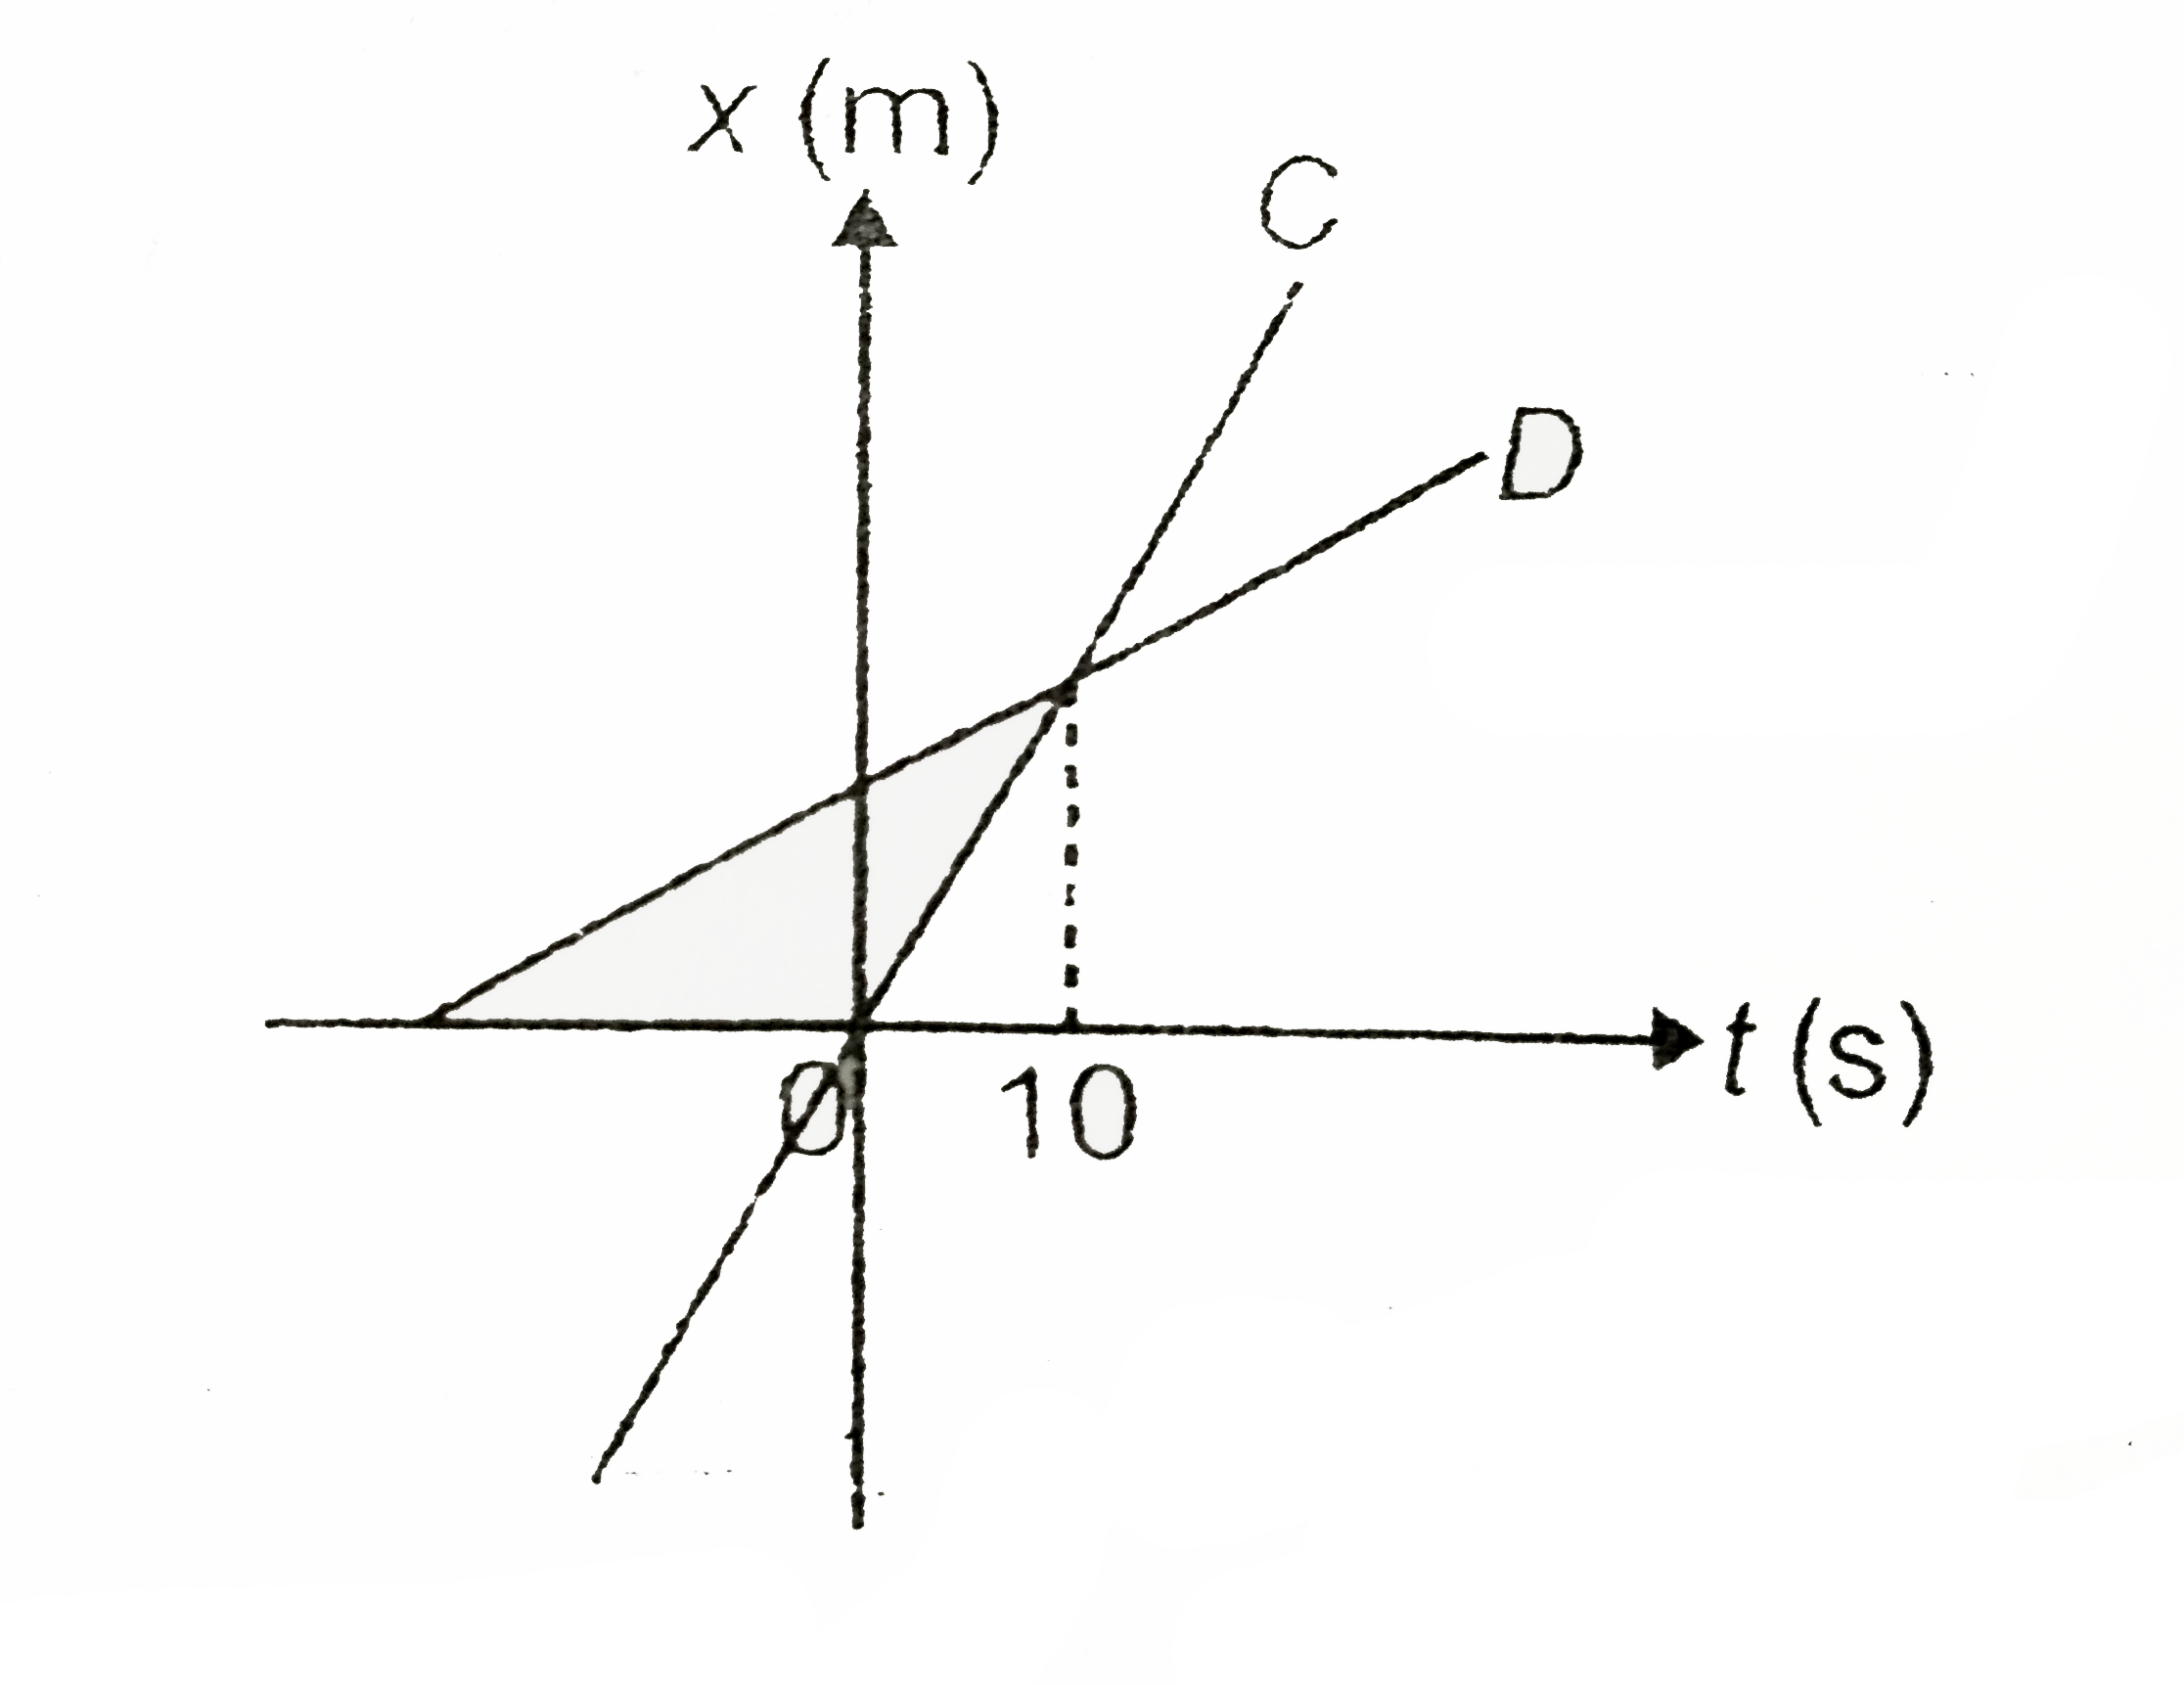
At t = 10 sView SolutionFigure shows the position -time graph of an object in SHM. The correct equation representing this motion is
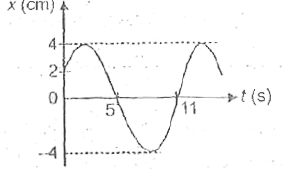 View Solution
The figure shows the position time graph of a particle of mass 40 kg. What is the force acting on the particle of 0<t<4 s
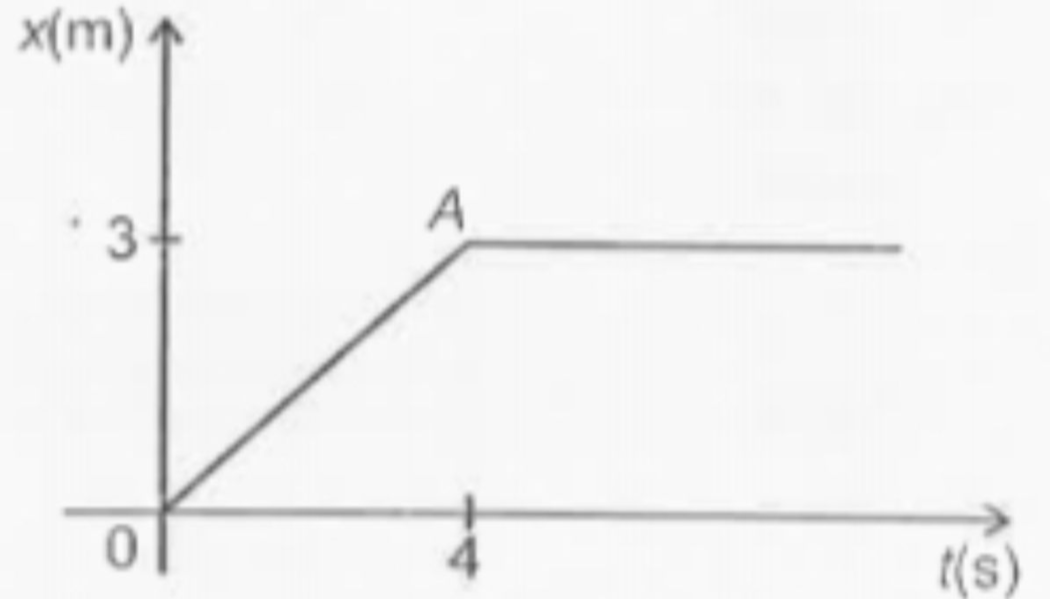 View Solution
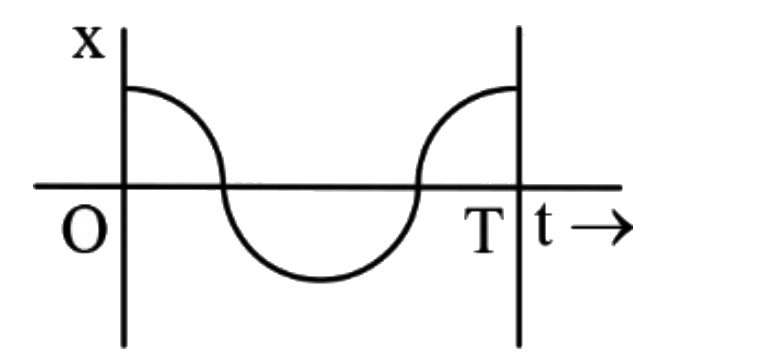
A body is performing simple harmonic motion of amplitude A and time period T. The figure shown position-time graph of the body . At any time t, acceleration of the body is f, then which of the following graphs is/are appropriate?
 View Solution
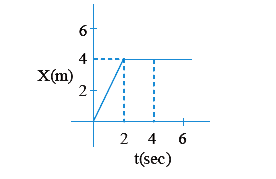
In the figure, the position time graph of a particle of mass 0.1 kg is shown. The impulse at t=2 second is :
 View Solution
In the graph shown, the PE of earth-satellite system is shown by a solid line as a function of distance r (the separation between earth's centre and satellite). The total energy of the two objects which may or may not be bounded to the earth are shown in the figure by dotted lines.
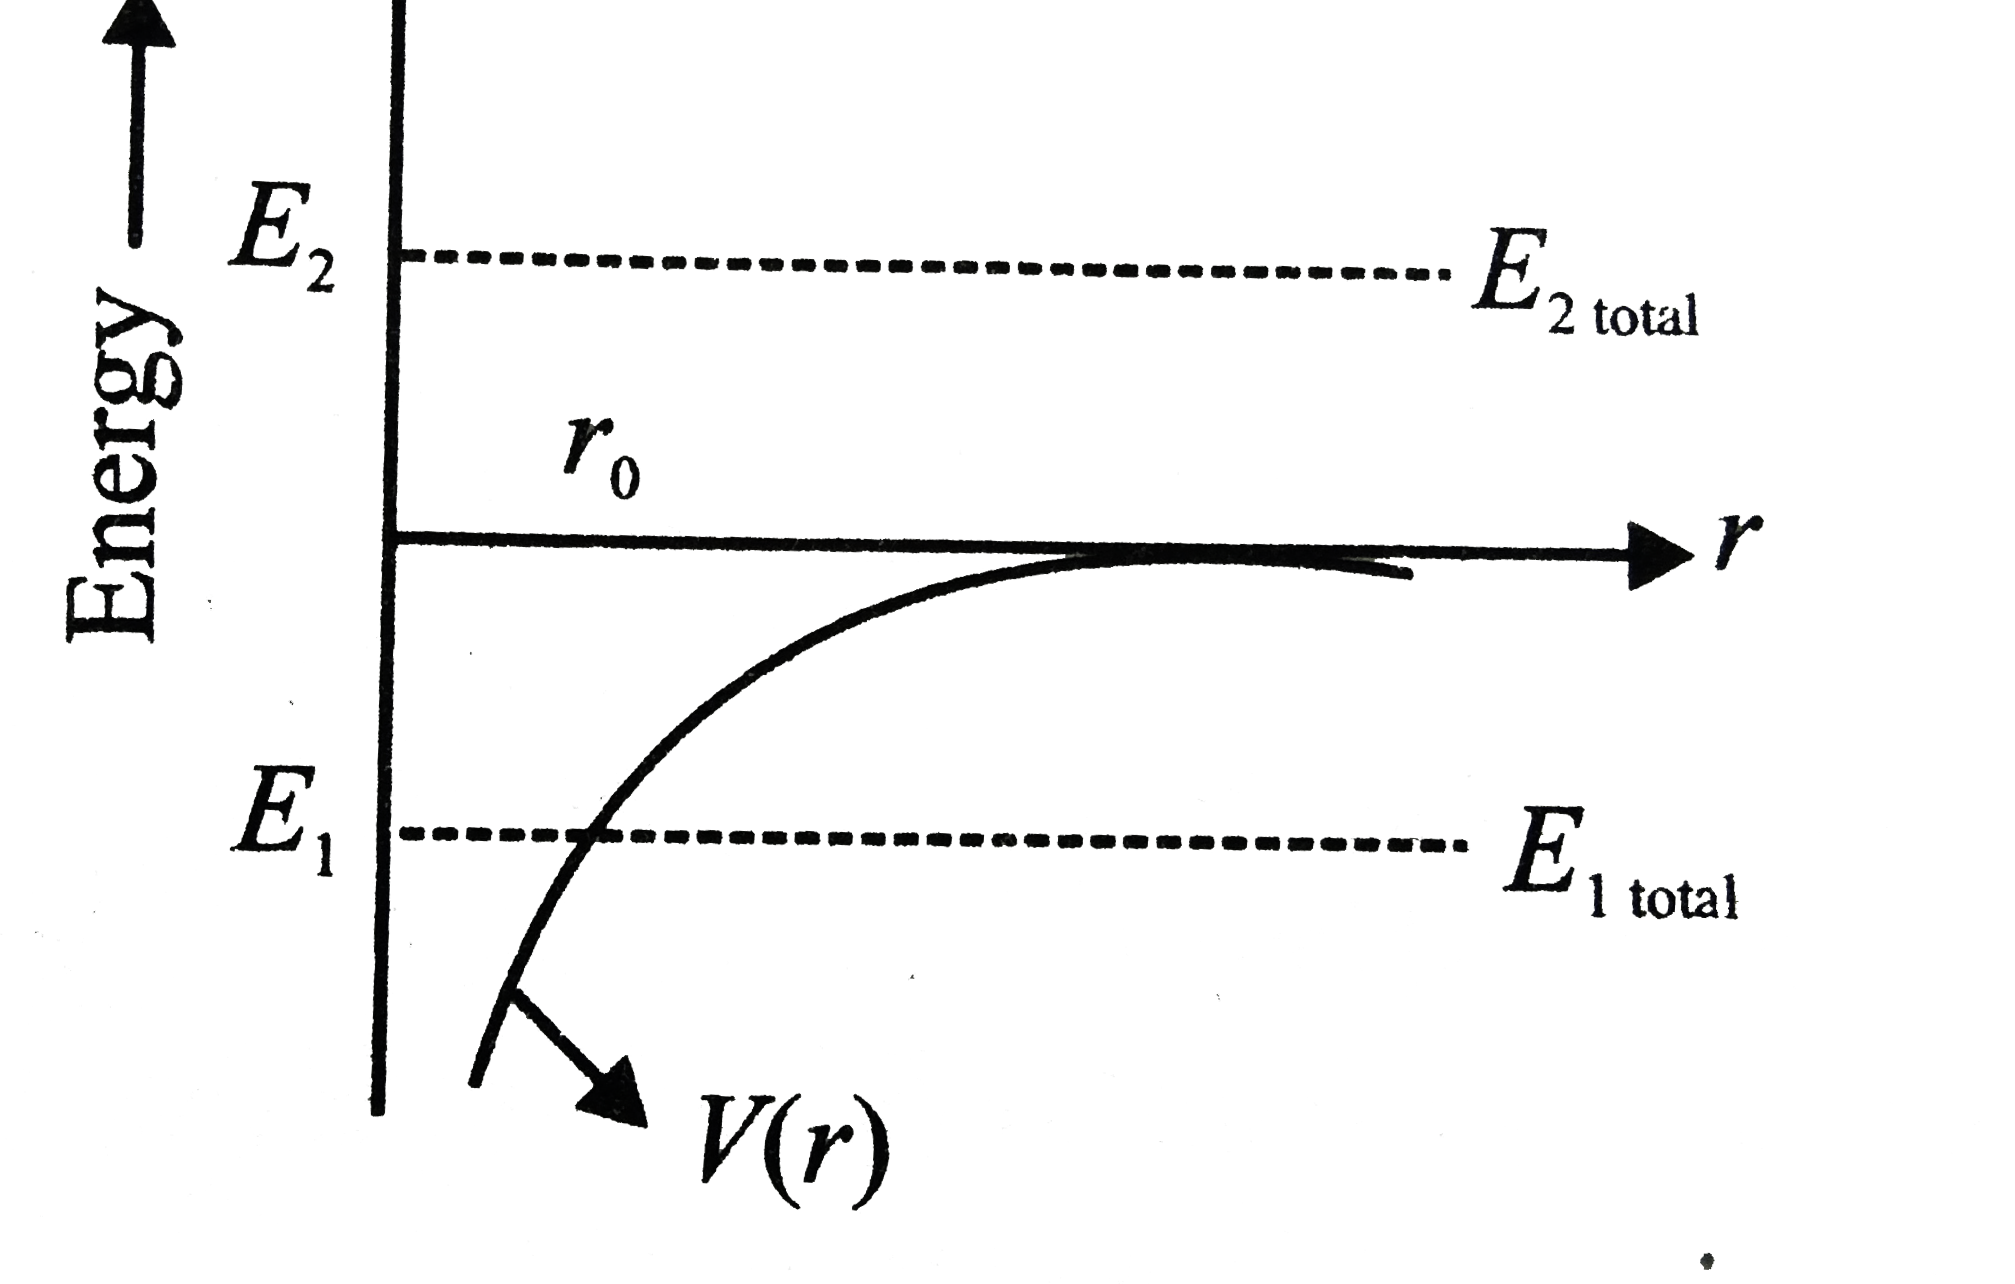
Based on the above information, answer the following questions.
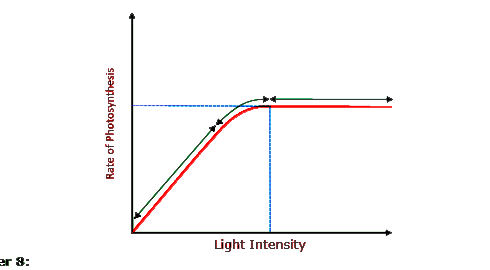
Mark the correct statement(s).View SolutionFigure 13.10 shows the effect of light on the rate of photosynthesis. Based on the graph, answer the following questions:
(a) At which point/s (A, B or C) in the curve is light a limiting factor?
(b) What could be the limiting factor/s in region A?
(c) What do C and D represent on the curve?
 View Solution
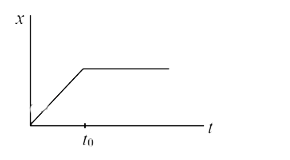
Figure shows the position-time graph of a particle moving on the X--axis. Which of these option correctly describes the particle 's motion?
 View Solution
Read the given bar graph and answer the question that follow :
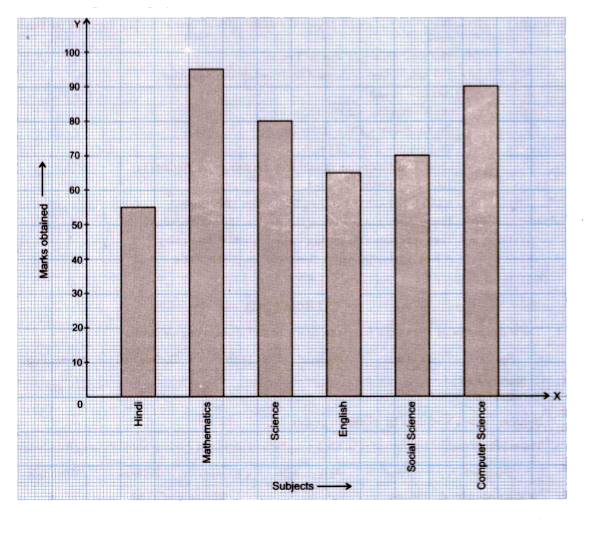
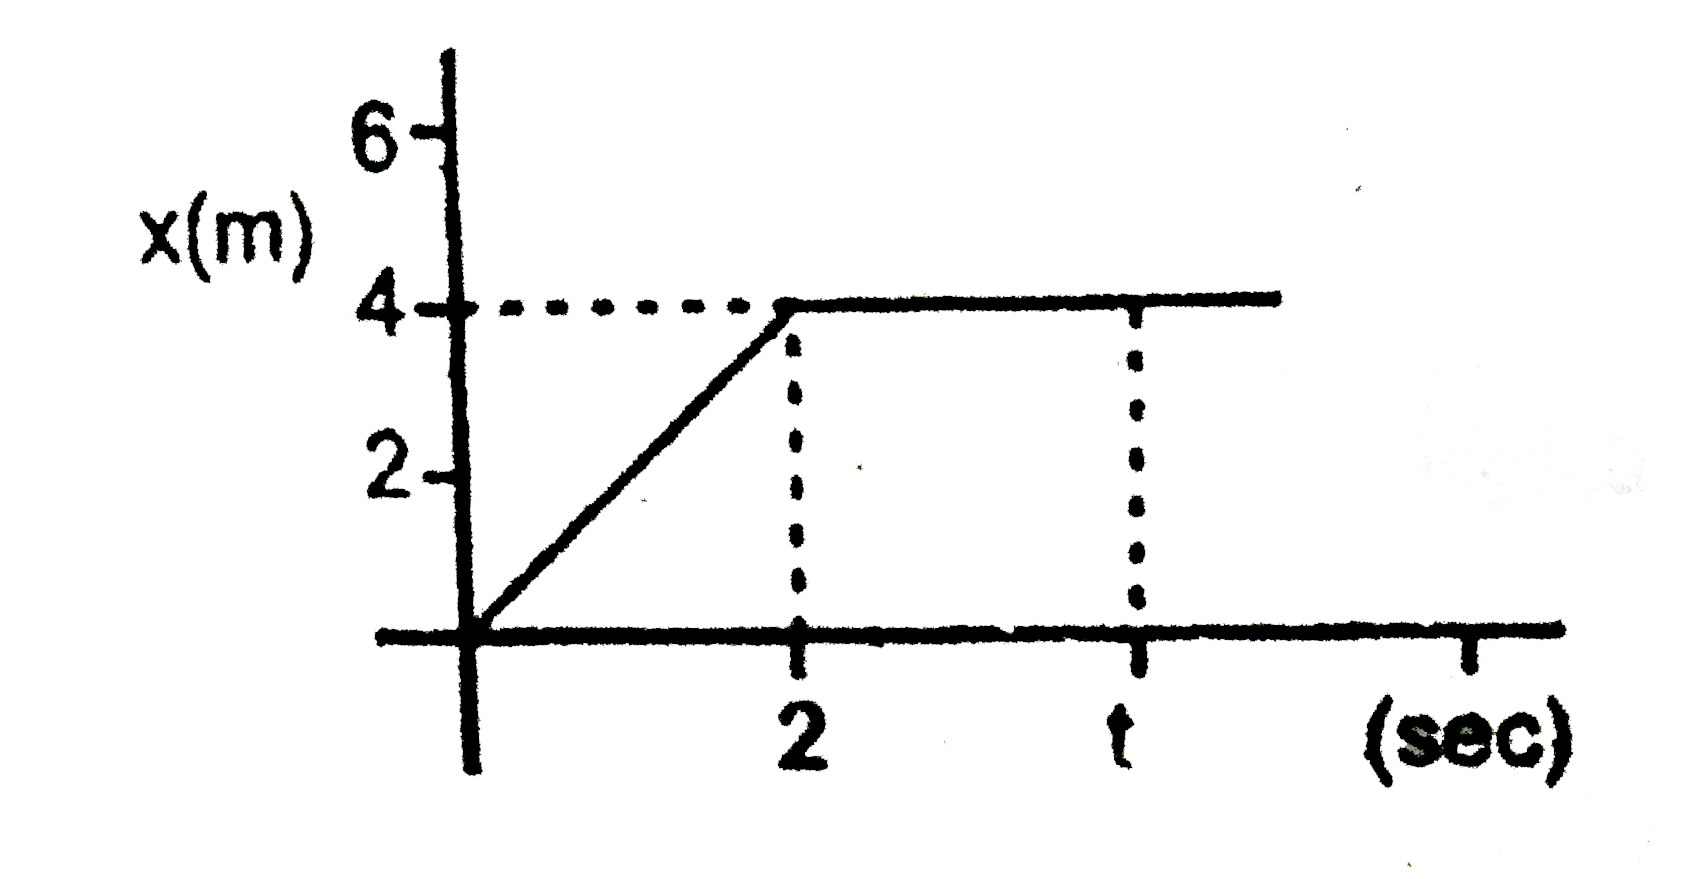
What information is represented by the bar graph?View SolutionIn the figure given below, the position time graph of a particle of mass 0.1kg is shown. The impulse at t=2 sec is
 View Solution

