The figure shows position time graph of two riders C and D. Based on the information represented by the graph, answer the following questions.
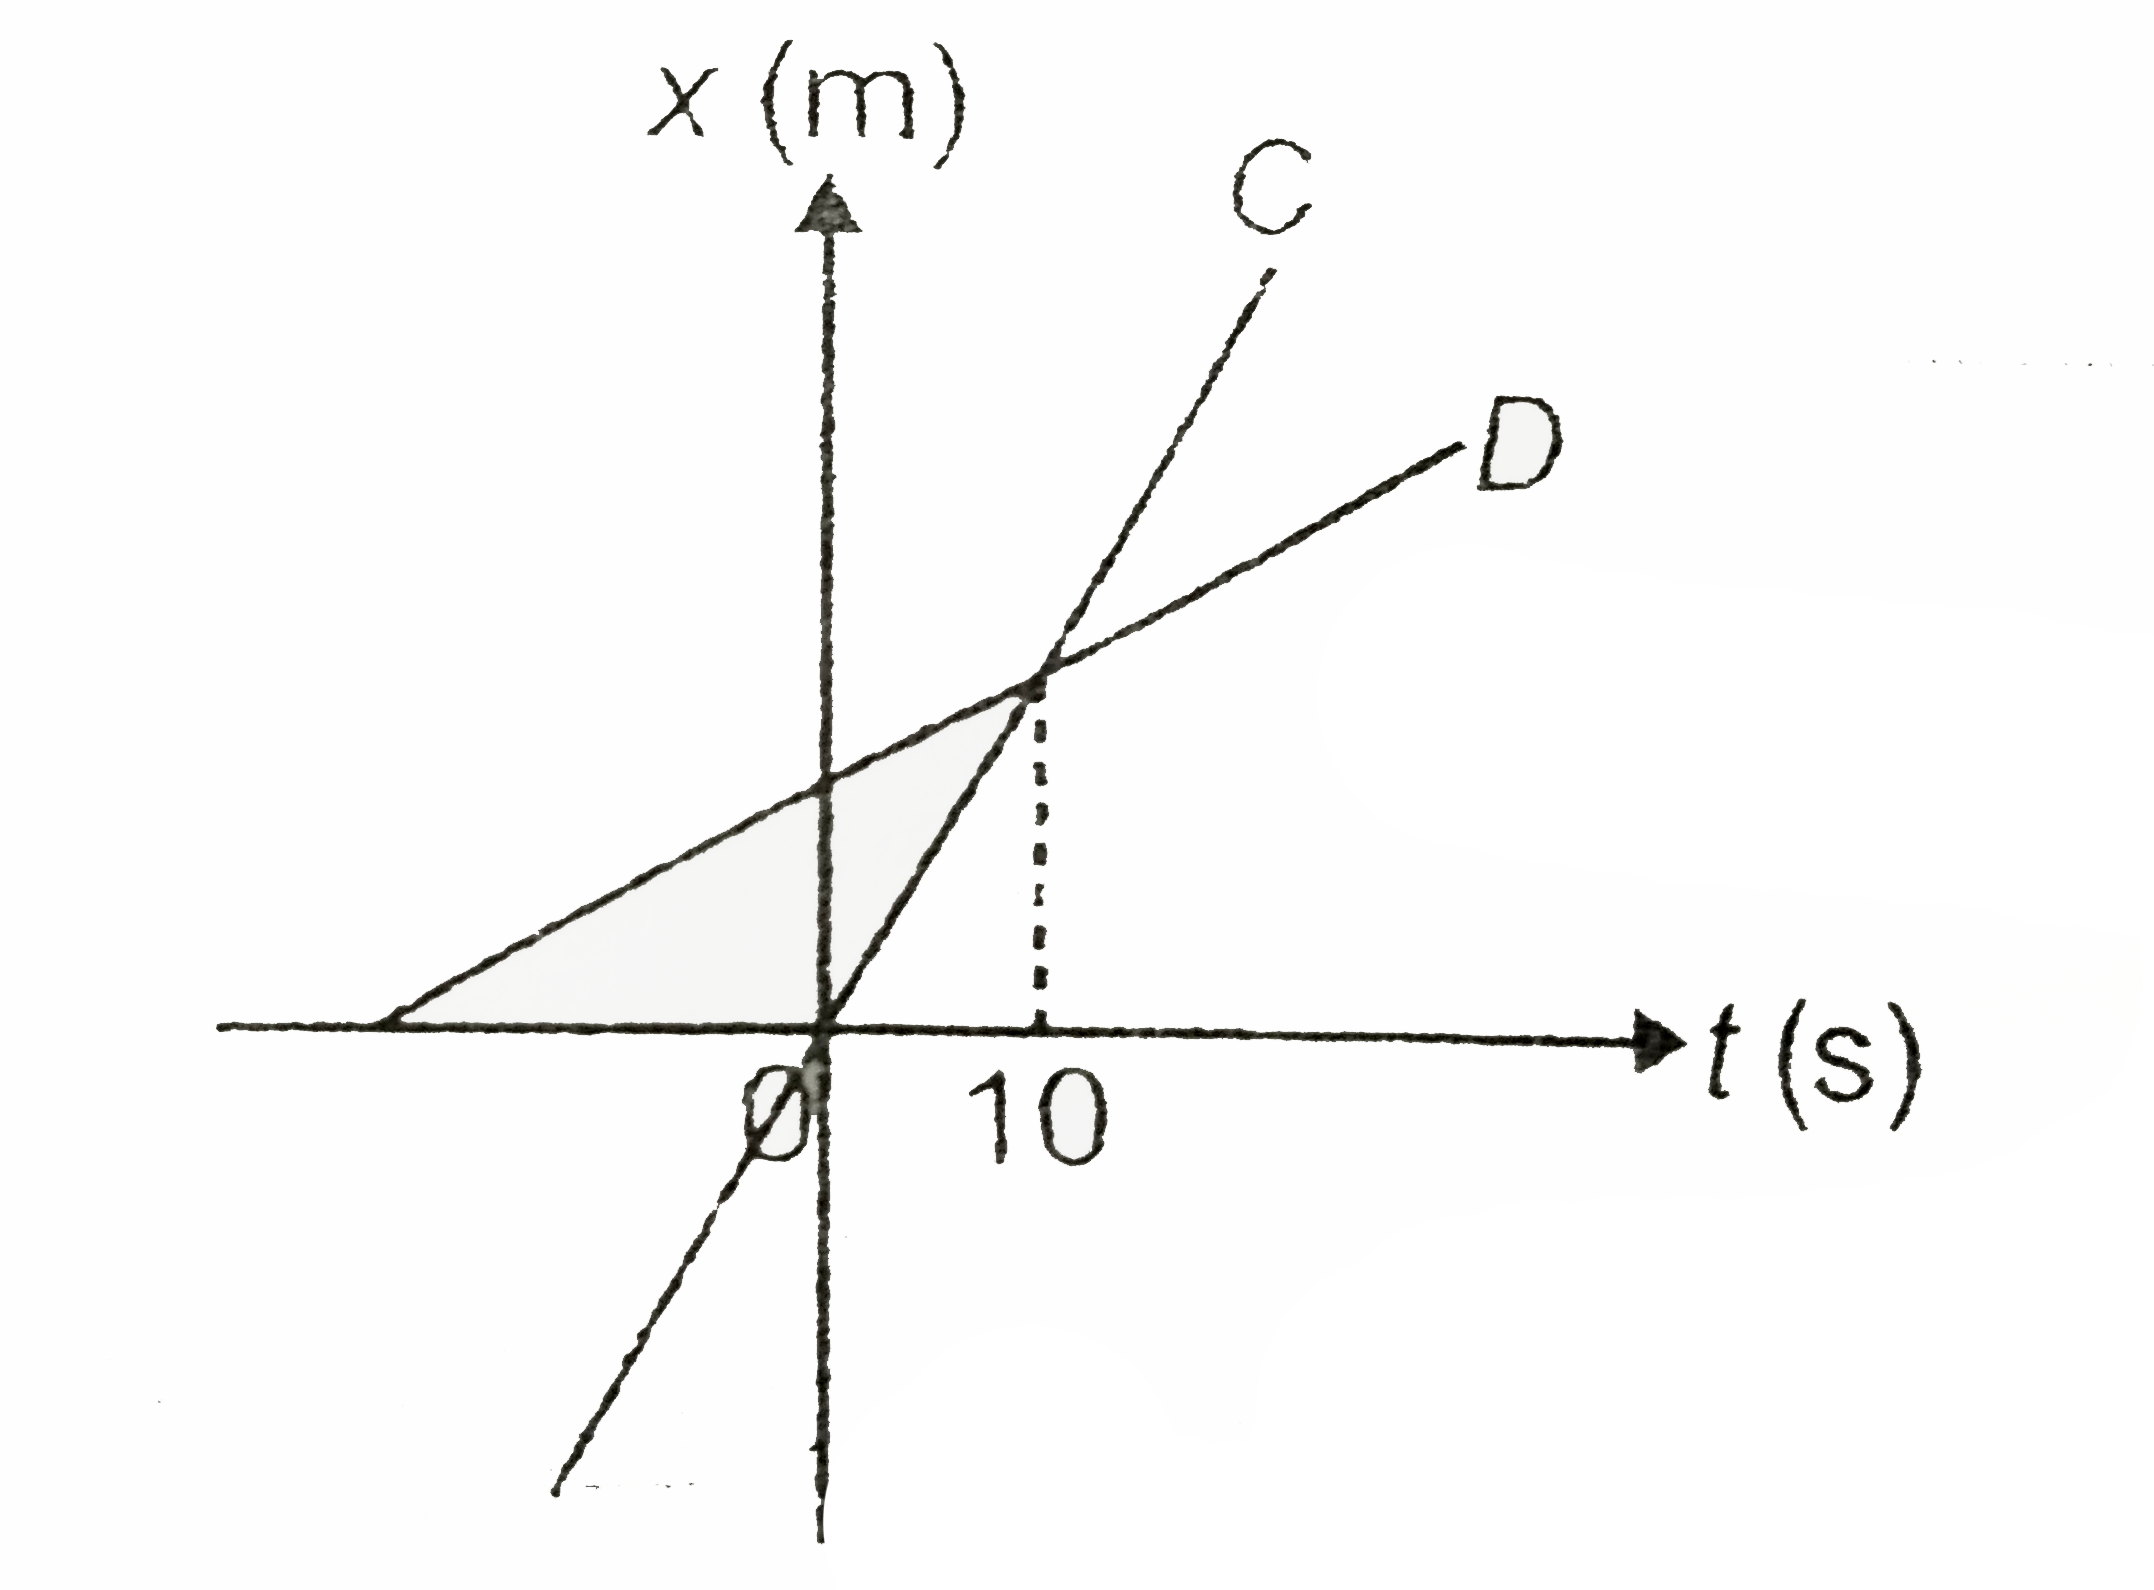
At t = 0 s
C is moving, and D is at rest
D is moving, and C is at rest
C and D are both moving
C and D are both at rest
The correct Answer is:C
Step by step video & image solution for The figure shows position time graph of two riders C and D. Based on the information represented by the graph, answer the following questions. At t = 0 s by Physics experts to help you in doubts & scoring excellent marks in Class 12 exams.
Updated on:21/07/2023Topper's Solved these Questions
- MOTION IN STRAIGHT LINEBOOK - AAKASH INSTITUTE ENGLISHCHAPTER - MOTION IN STRAIGHT LINEEXERCISE - Assignment (SECTION - E)
8 Videos
- MOTION IN STRAIGHT LINEBOOK - AAKASH INSTITUTE ENGLISHCHAPTER - MOTION IN STRAIGHT LINEEXERCISE - Assignment (SECTION - F)
2 Videos
- MOTION IN STRAIGHT LINEBOOK - AAKASH INSTITUTE ENGLISHCHAPTER - MOTION IN STRAIGHT LINEEXERCISE - Assignment (SECTION - C)
7 Videos
- MOTION IN A STRAIGHT LINEBOOK - AAKASH INSTITUTE ENGLISHCHAPTER - MOTION IN A STRAIGHT LINEEXERCISE - ASSIGNMENT (SECTION - D)
15 Videos
- MOVING CHARGE AND MAGNESIUMBOOK - AAKASH INSTITUTE ENGLISHCHAPTER - MOVING CHARGE AND MAGNESIUMEXERCISE - SECTION D
16 Videos
Similar Questions
The figure shows position time graph of two riders C and D. Based on the information represented by the graph, answer the following questions.
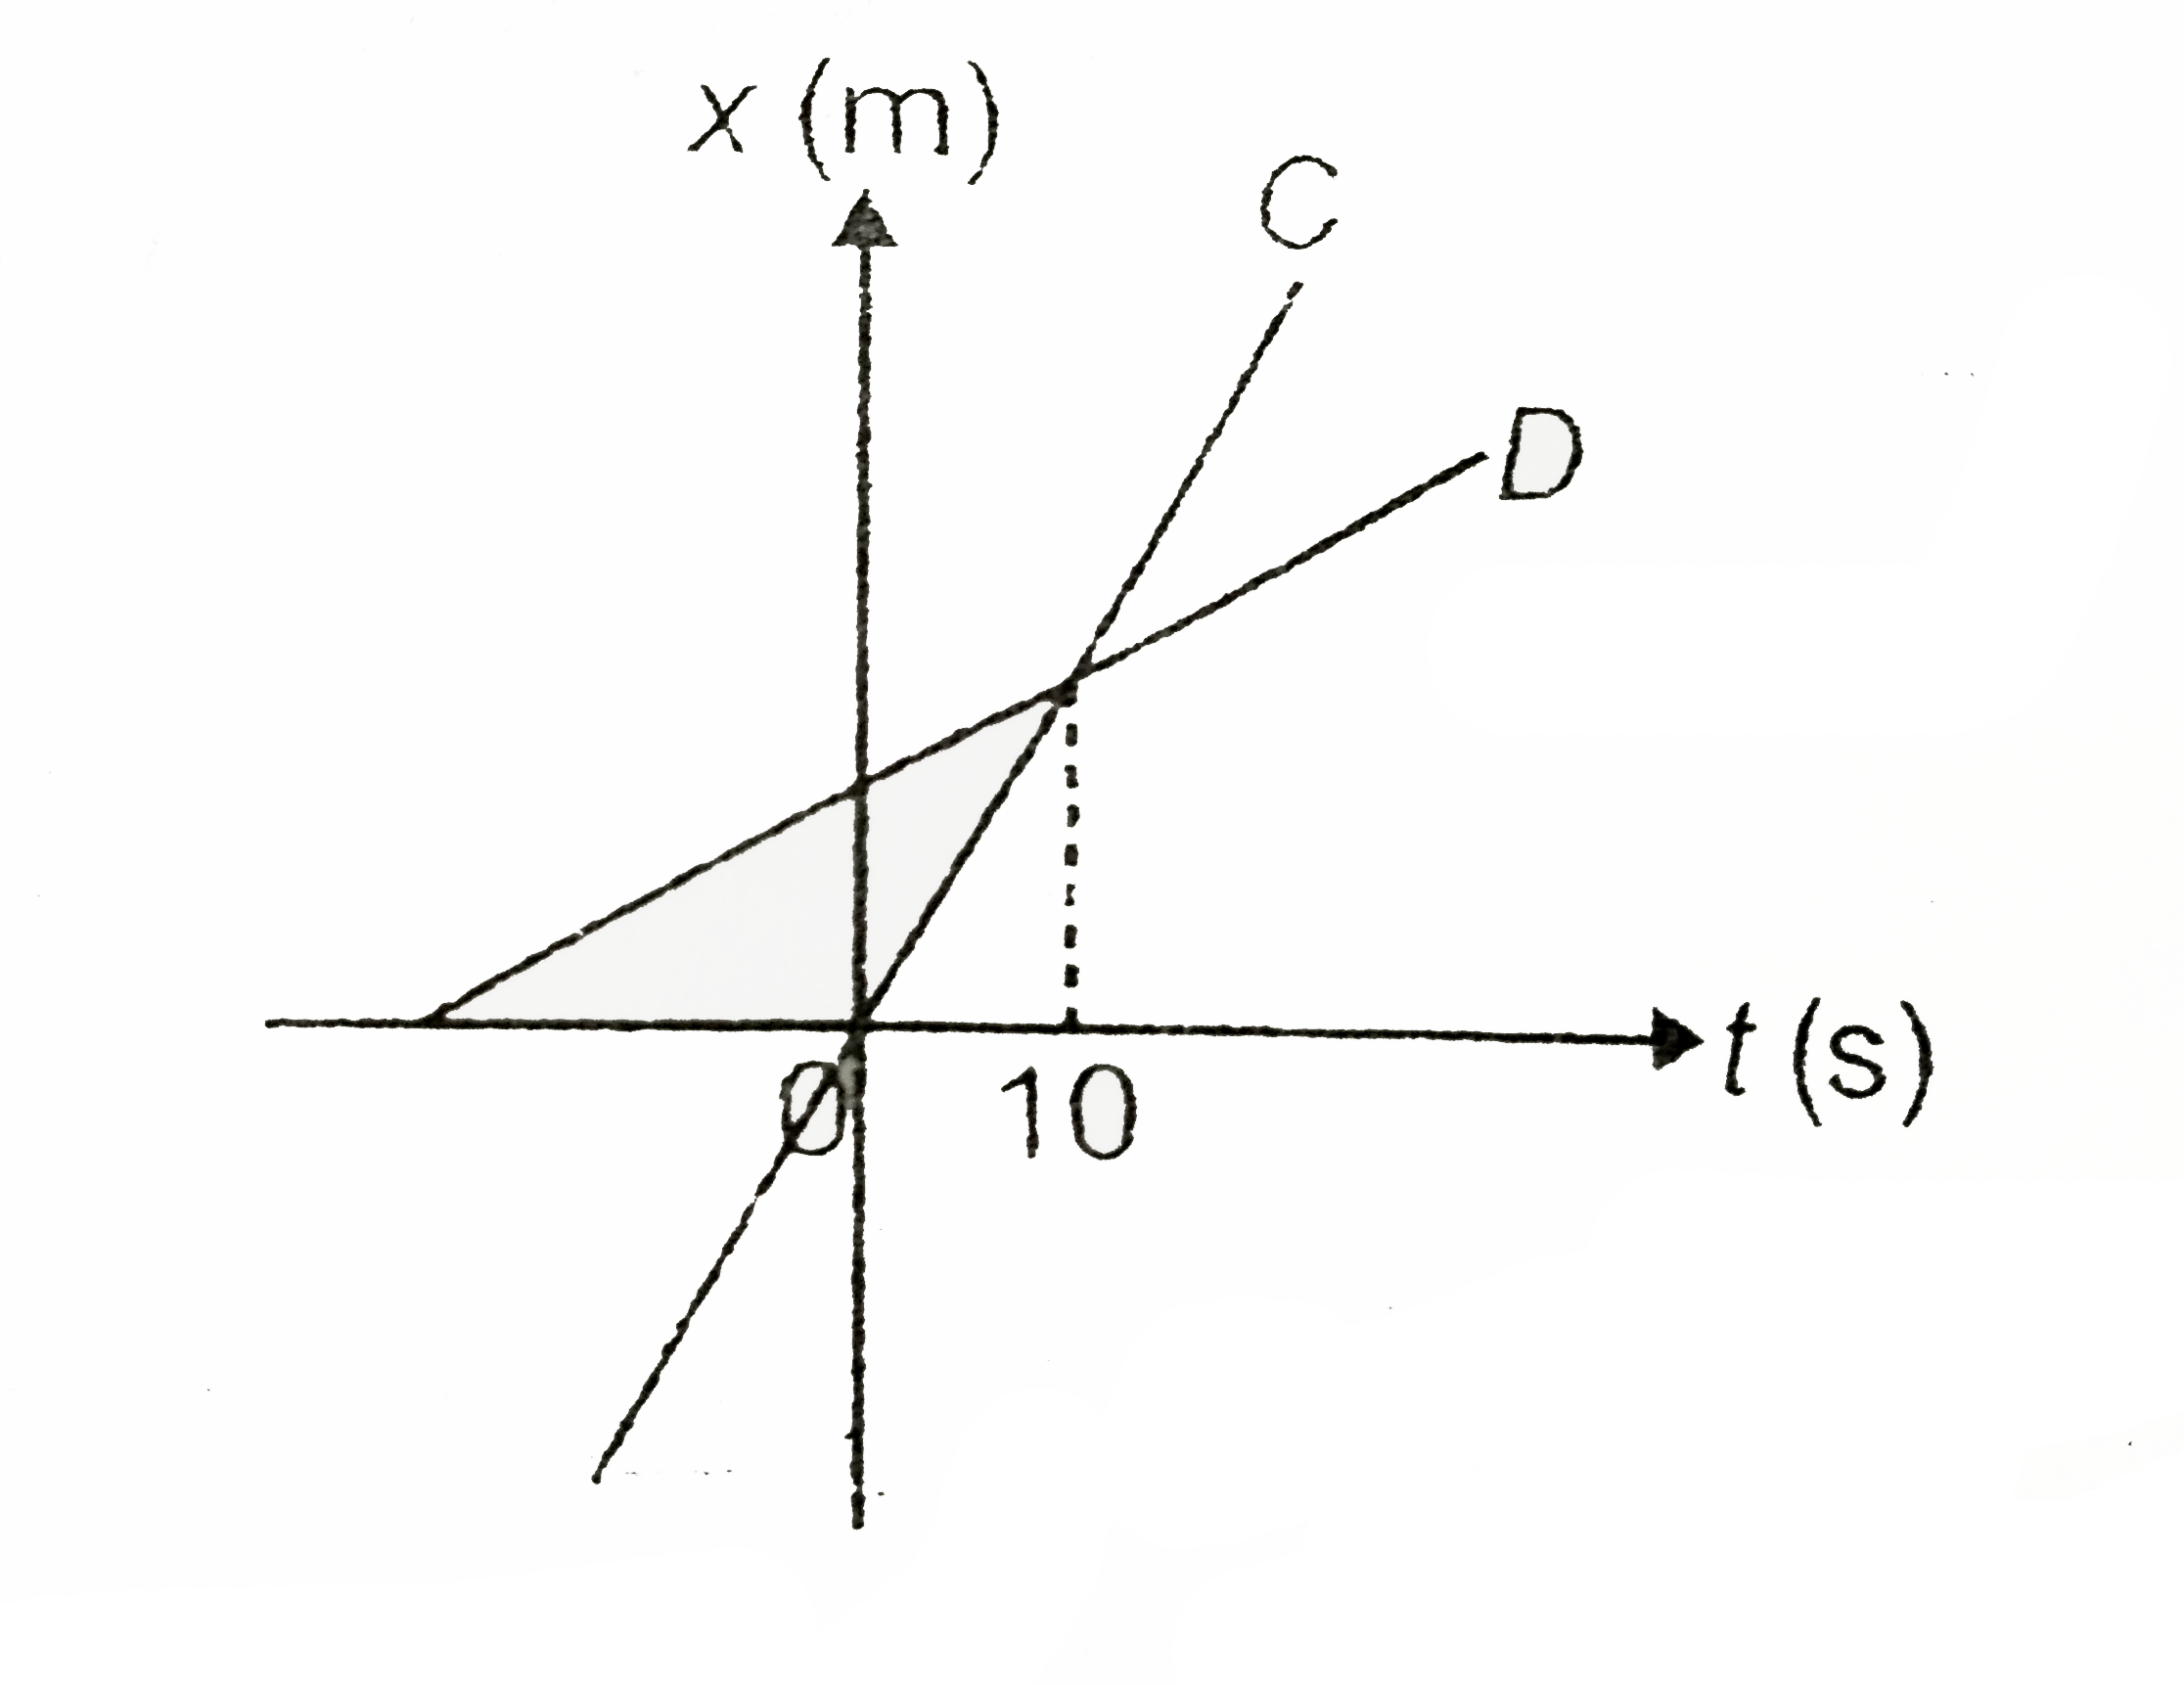
At t = 10 s
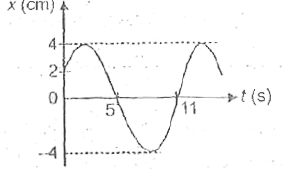
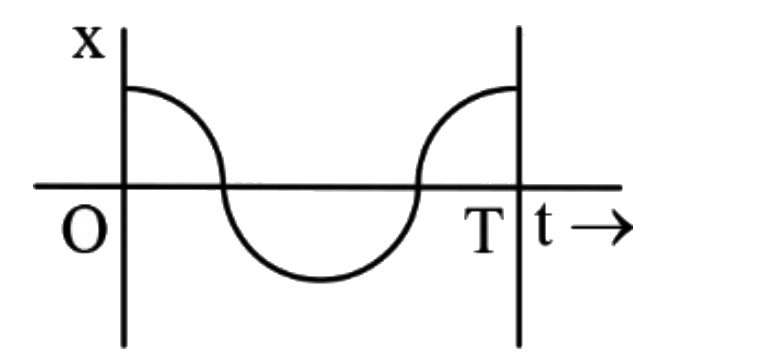
View SolutionFigure shows the position -time graph of an object in SHM. The correct equation representing this motion is
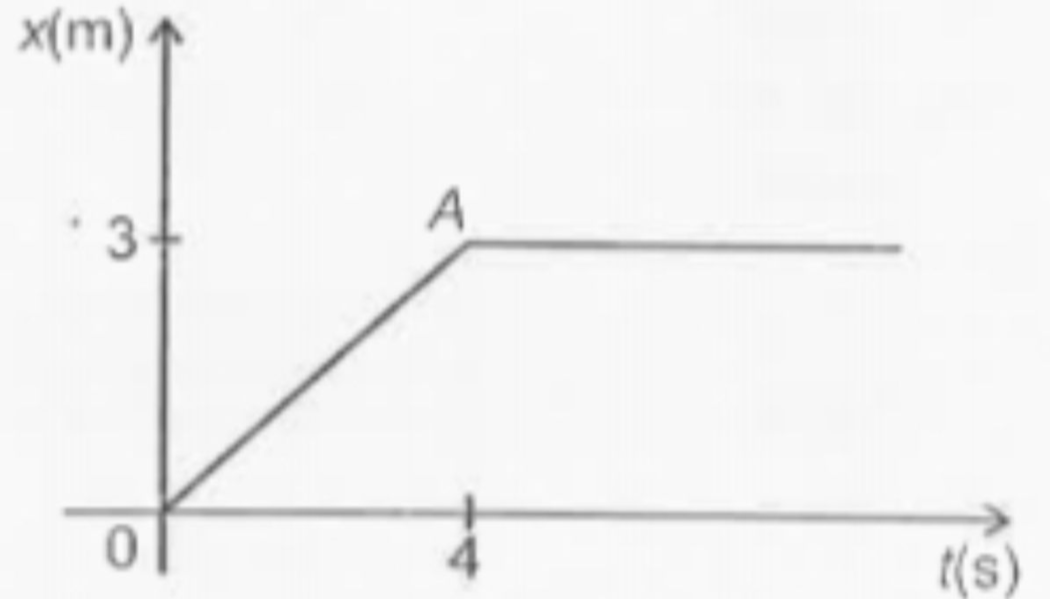
View SolutionThe figure shows the position time graph of a particle of mass 40 kg. What is the force acting on the particle of 0<t<4 s
View SolutionA body is performing simple harmonic motion of amplitude A and time period T. The figure shown position-time graph of the body . At any time t, acceleration of the body is f, then which of the following graphs is/are appropriate?
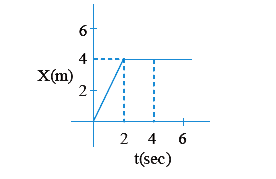
View SolutionIn the figure, the position time graph of a particle of mass 0.1 kg is shown. The impulse at t=2 second is :
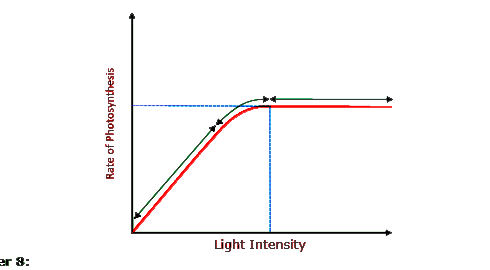
View SolutionFigure 13.10 shows the effect of light on the rate of photosynthesis. Based on the graph, answer the following questions:
(a) At which point/s (A, B or C) in the curve is light a limiting factor?
(b) What could be the limiting factor/s in region A?
(c) What do C and D represent on the curve?
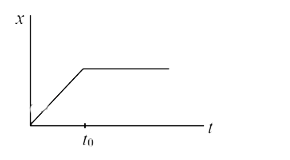
View SolutionFigure shows the position-time graph of a particle moving on the X--axis. Which of these option correctly describes the particle 's motion?
View SolutionRead the given bar graph and answer the question that follow :
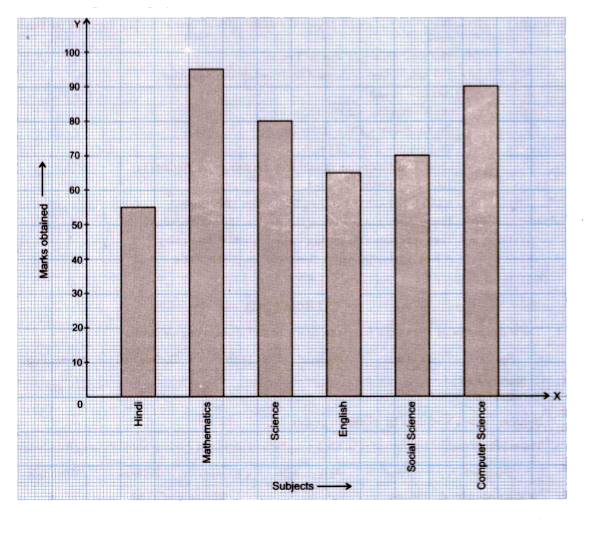
What information is represented by the bar graph?
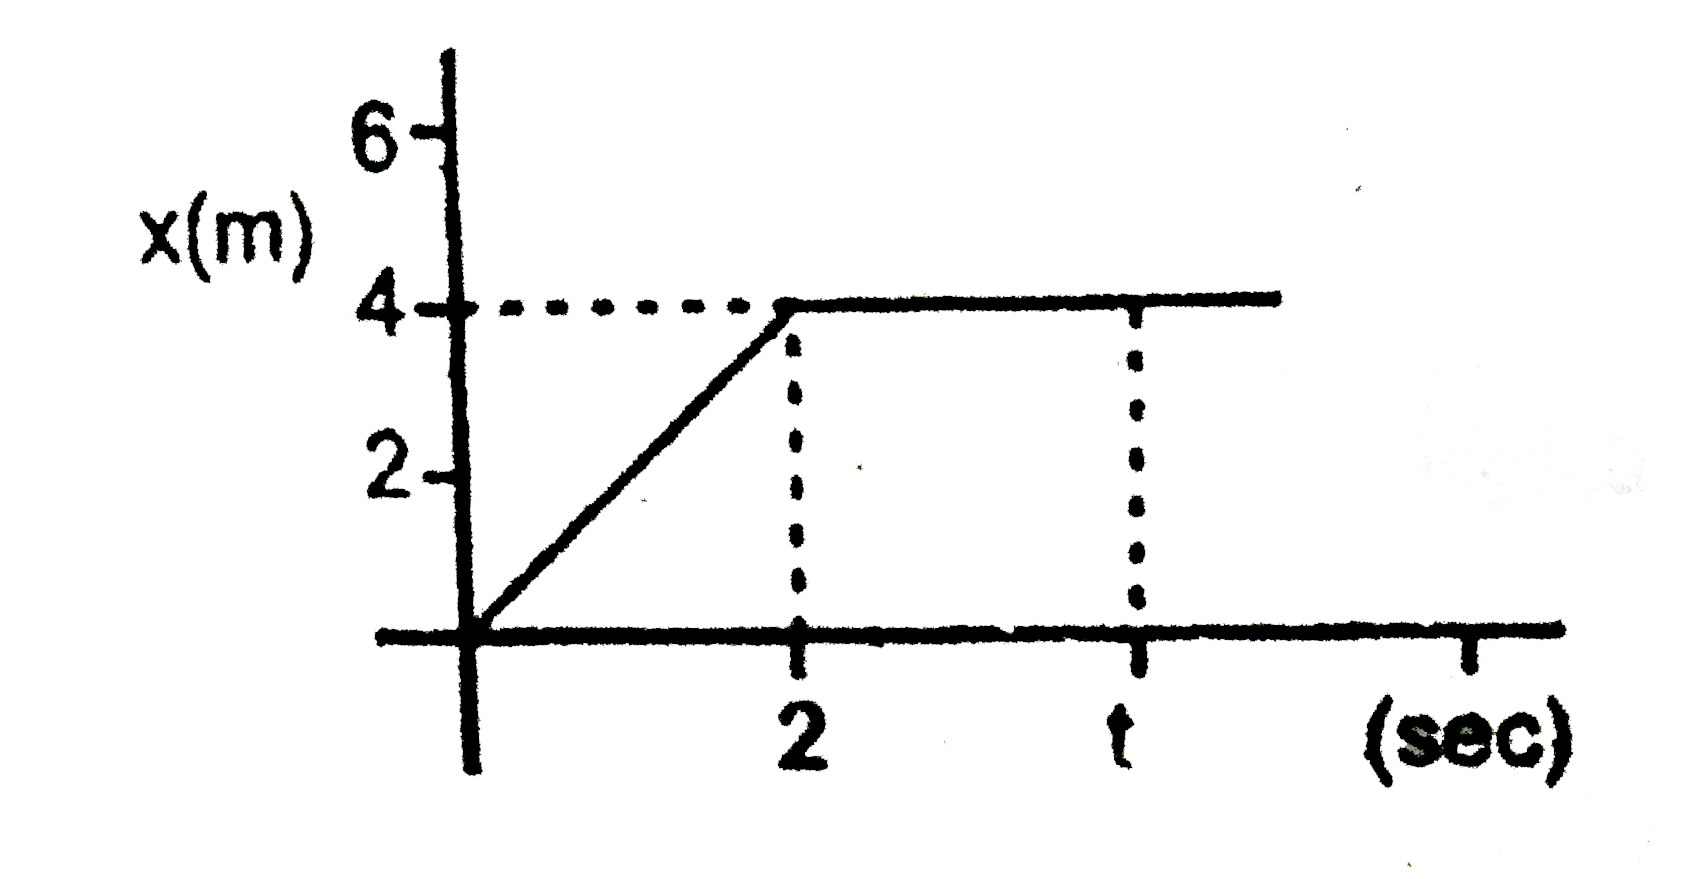
View SolutionIn the figure given below, the position time graph of a particle of mass 0.1kg is shown. The impulse at t=2 sec is
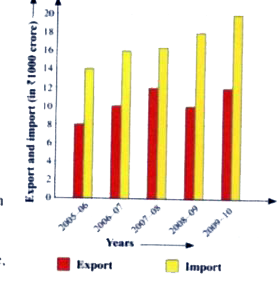
View SolutionRead the bar graph and answer the following questions.
What information is given by the bar graph?
View Solution
