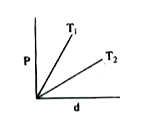
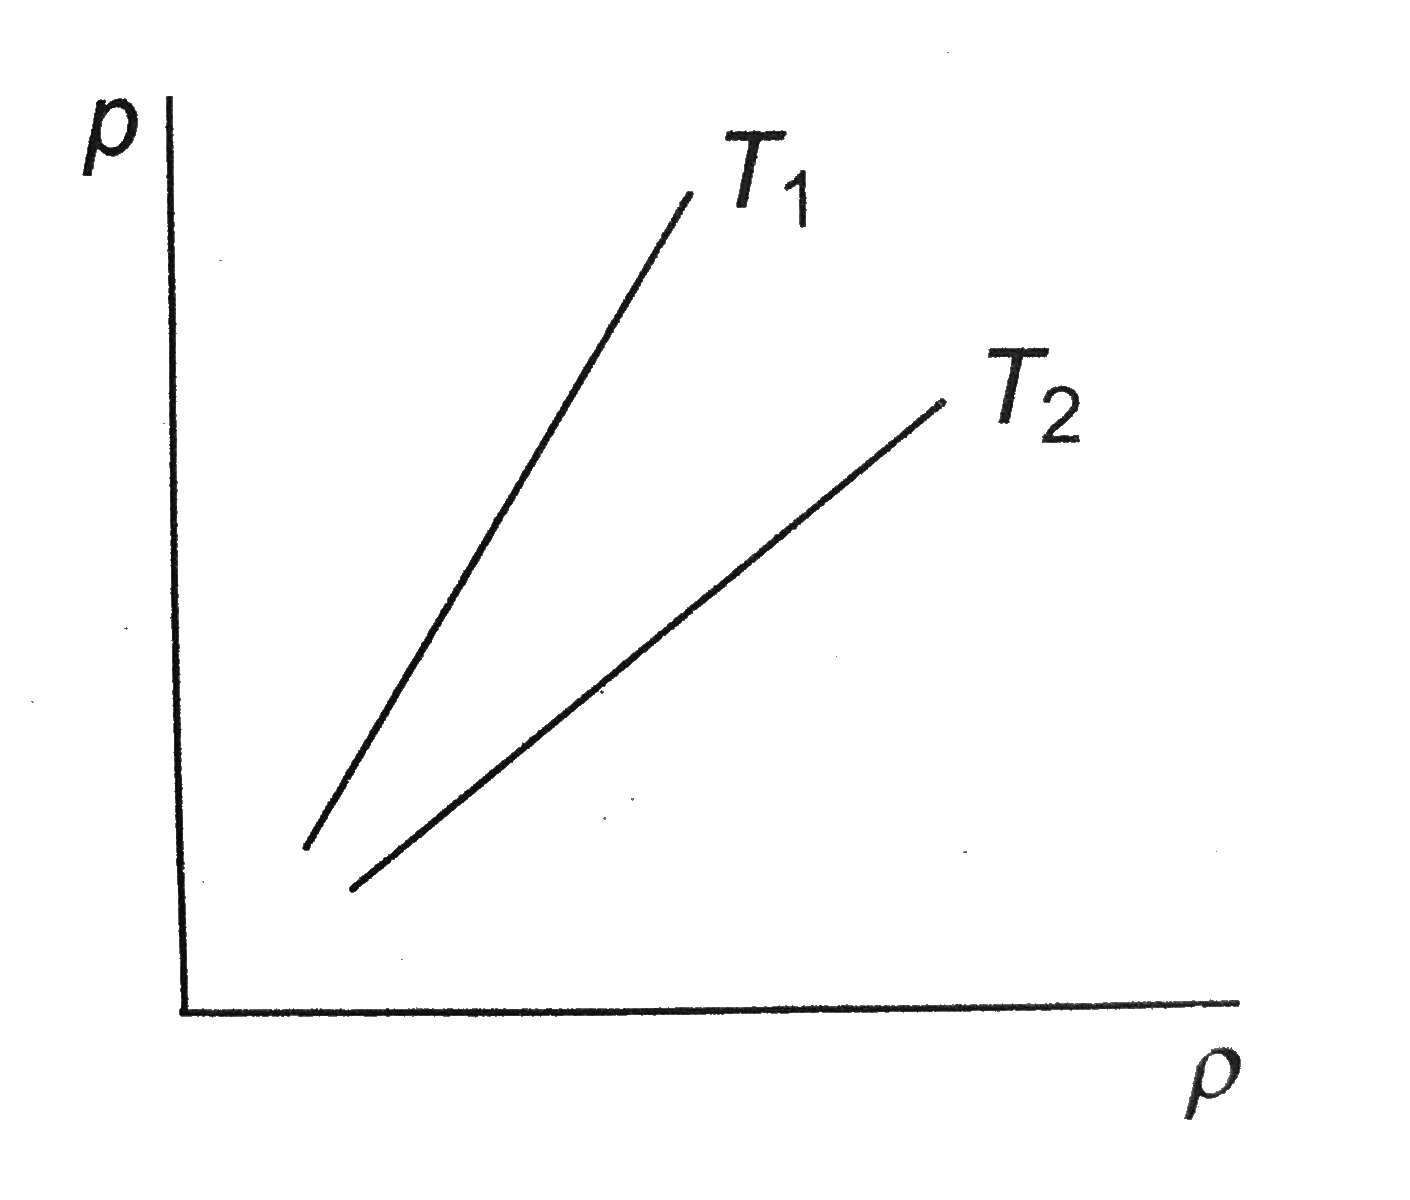
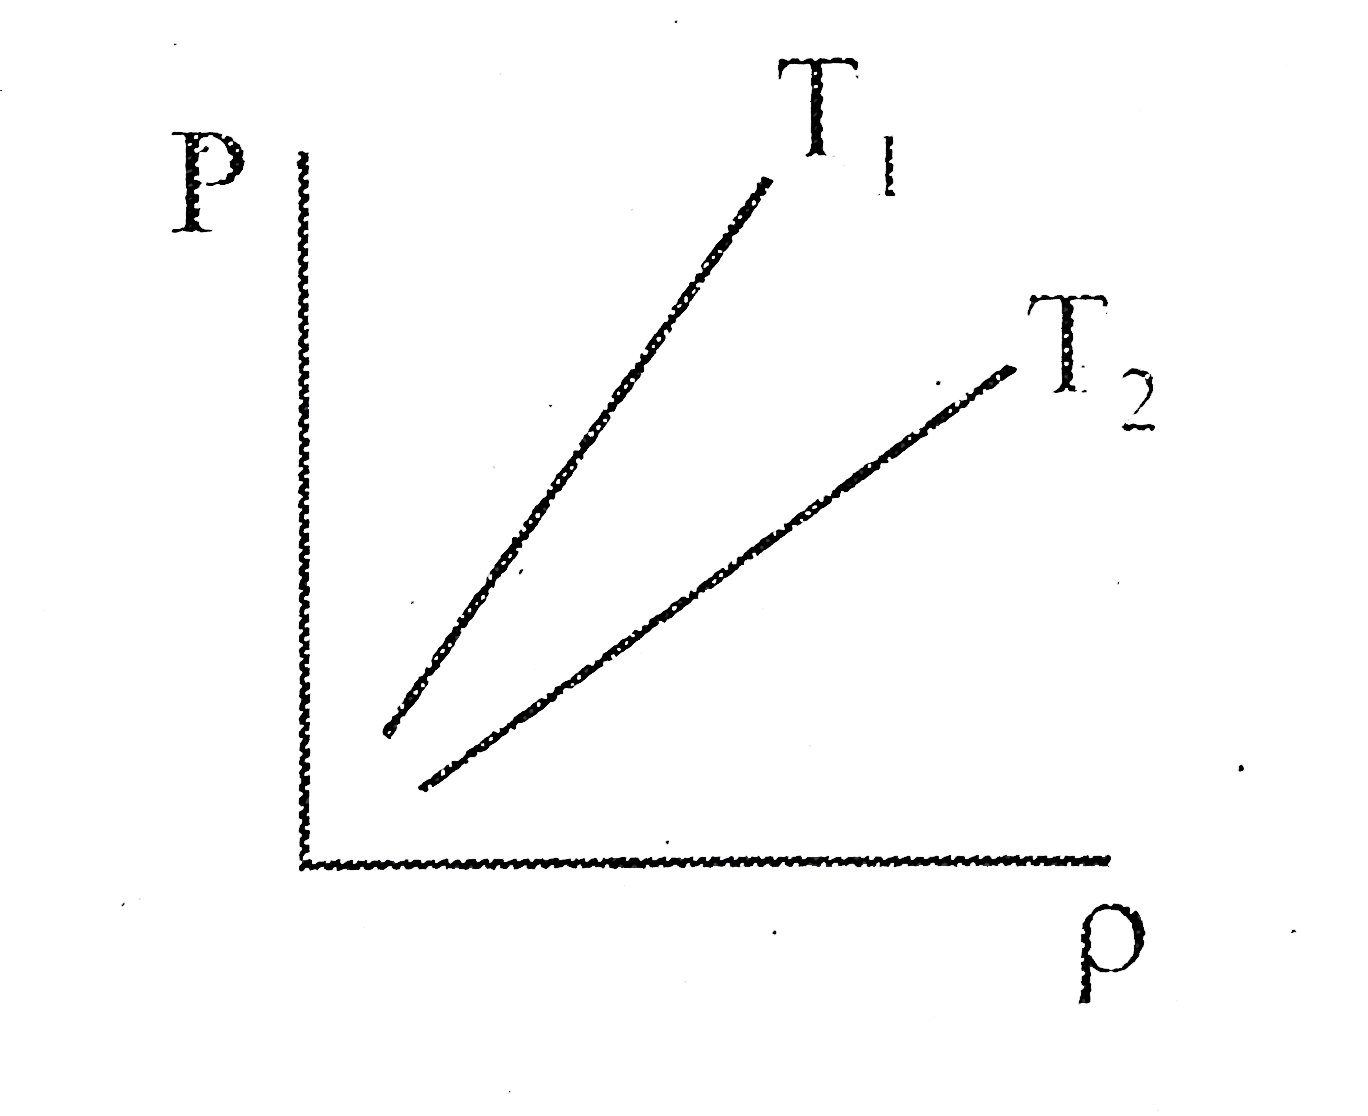
Diagram shows a graph between pressure and density for an ideal gas at two temperatures T1andT2 which is correct
 Solution in Telugu
T1>T2
T=T2
T1<T2
None
The correct Answer is:A
Step by step video, text & image solution for Diagram shows a graph between pressure and density for an ideal gas at two temperatures T_1 and T_2 which is correct by Chemistry experts to help you in doubts & scoring excellent marks in Class 11 exams.
Topper's Solved these Questions
- BOOK - AAKASH SERIESCHAPTER - STATES OF MATTEREXERCISE - OBJECTIVE EXERCISE -319videos
STATES OF MATTER
- BOOK - AAKASH SERIESCHAPTER - STATES OF MATTEREXERCISE - OBJECTIVE EXERCISE -197videos
STATES OF MATTER
- BOOK - AAKASH SERIESCHAPTER - SATURATED HYDROCARBONSEXERCISE - QUESTIONS FOR DESCRIPTIVE ANSWERS10videos
SATURATED HYDROCARBONS
- BOOK - AAKASH SERIESCHAPTER - STOICHIOMETRYEXERCISE - QUESTIONS FOR DESCRIPTIVE ANSWERS59videos
STOICHIOMETRY
Similar Questions
Van der Waal's real gas, acts as an ideal gas, at which conditions
03:02View SolutionNumber of measurable parameters of a gas is
01:39View SolutionWhy boiling and melting points of hydrocarbons are low ?
02:09View SolutionDistinguish between element and compound?
02:36View SolutionFigure shows graphs of pressure vs density for an ideal gas at two temperature T1andT2. Which of the following is correct?
 04:37View Solution
Figure shows graphs of pressure versus density for an ideal gas at two temperatures T_(1) and T_(2) Which is correct ? .
View SolutionThe adjoining figure shows graphs of pressure and volume of a gas at two temperature T_1 and T_2 Which of the following inferences is correct?
View SolutionFigure shows graphs of pressure vs density for an ideal gas at two temperature T1 and T2 . Which of the following is correct ?
 02:08View Solution
Which of the following shows the correct relationship between the perssure and density of an ideal gas constant temperature ?
01:30View SolutionWhich of the following shows the correct relationship between the pressure and density of an ideal gas at constant temperature ?
01:30View SolutionWhich of the following shows the correct relationship between the pressure and density of an ideal gas at constant temperature ?
01:14View SolutionFigure shows graphs of pressure versus density for an ideal gas at two temperatures T1 and T2 Then
 05:40View Solution
Diagram shows a graph between pressure and density for an ideal gas at two temperatures T1andT2 which is correct
 01:59View Solution
Diagram shows a graph between pressure and density for an ideal gas at two temperatures T1andT2 which is correct
 03:51View Solution
Pressure (P) vs. density (D) curve for an ideal gas at two different temperatures T_1 and T_2 is shown below . Identify the correct statement about T_1 and T_2 .
03:01View SolutionTwo different temperatures of an ideal gas T_1 Oh T_2 Pressure (P) vs. The graph of density (D) is given below. T_1 Oh T_2 Identify the correct statement about:
04:06View Solution

