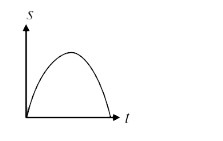
Graphs || Distance Between Two Points vs Time || Examples Based on Graphs || Air Drag
Video Solution
|
Answer
Step by step video solution for Graphs || Distance Between Two Points vs Time || Examples Based on Graphs || Air Drag by Physics experts to help you in doubts & scoring excellent marks in Class 12 exams.
Updated on:21/07/2023Similar Questions
Knowledge Check
A graph plotted between log N vs, time gives a slope and intercept equal to:
A−λ2.303,logN0Bλ2.303,logN0C−λ2.303,N0Dλ2.303,N0Distance covered-time graph cannot be
Aa closed curveBbelow the time-axisCa line or curve with negative slopeDall of he aboveThe distance between the points (0,0) and the intersecting point of the graphs of x= 3 and y = 4 is
A4 unitB3 unitC2 unitD5 unit
Graph Of A Linear Equation In Two Variables|Examples|OMR
View SolutionGraphs in Kinematics|| Displacement-time graph|| Velocity-time graph|| accn vs time graph
View SolutionA graph plotted between log k vs 1T is represented by
View SolutionThe graph of displacement vs time for a particle moving along a straight line is as shown. The best option for the corresponding velocity - time graph will be:

View SolutionThe slope of distance-time graph is curved. It represents
View Solution
