The following pie chart shows the hourly distribution of all the major activities of a student.
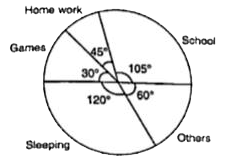
The percentage of time which he spends in school is :
38%
30%
40%
25%
The correct Answer is:B
Step by step video, text & image solution for The following pie chart shows the hourly distribution of all the major activities of a student. The percentage of time which he spends in school is : by Maths experts to help you in doubts & scoring excellent marks in Class 14 exams.
Topper's Solved these Questions
Similar Questions
The following pie-chart shows the percentage-wise distribution of the number of students in five different schools P, Q, R, S and T. The total number of students in all five schools together is 8400.
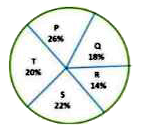
Find the average number of students in schools R and S together.View SolutionReading of pie chart for the % wise distribution of lectures in different subjects
View Solution
Knowledge Check
- Question 1 - Select One
The following pie chart shows the hourly distribution of all the major activities of a student.
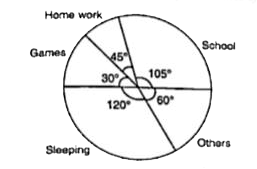
What is the difference in time (in hours) spends in school and in home work :A2B3C4D8 - Question 2 - Select One
The following pie chart shows the hourly distribution of all the major activities of a student.
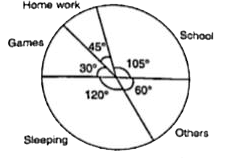
How much time (in per cent) he spends in games in comparison to sleeping ?A30%B40%C25%Dnone of these - Question 3 - Select One
The following pie chart shows the hourly distribution of all the major activities of a student.
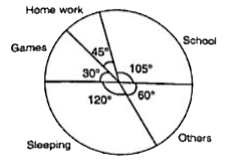
If he spends the time in games equal to the home work and remains constant in other activities, then the percentage decrease in time of sleeping :A0.15B12.5%C20%Dnone of these
Following pie chart shows the degree wise distribution of the students of a school using different transport while going to school. Read the chart answer the questions carefully.
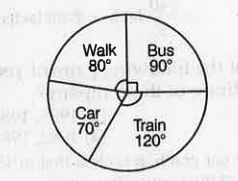
Total number of students = 2160
The number of students who come to school by car, isView SolutionThe following pie chart shows the hourly distribution of all the major activities of a student.
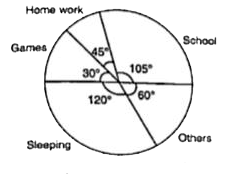
If he spends 13 rd time of home work in Mathematics then the no. of hours spends in rest of the subjects in home work :View SolutionThe following pie chart shows the performance in an examination in a particular year for 360 students. The percentage of students who have failed in the examination is
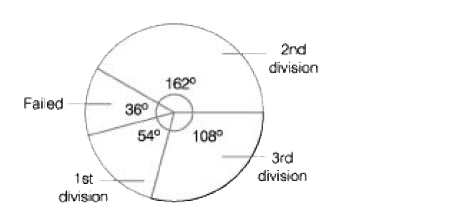 View Solution
The following pie-chart shows the study-time of different subjects of a student in a day. Study the pie-chart and answer the following questions
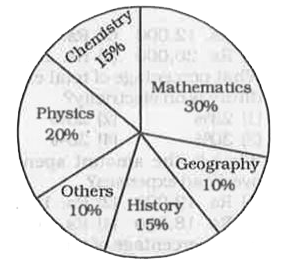
If the student studied 10 hours in a day, then he / she studied mathematics forView SolutionThe following pie-chart shows the study-time of different subjects of a student in a day. Study the pie-chart and answer the following questions
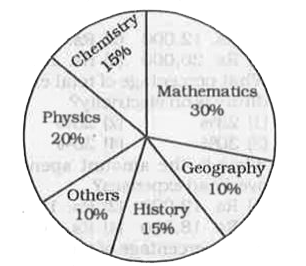
If the student studied chemistry for 3 hours, then he / she studied geography forView Solution
