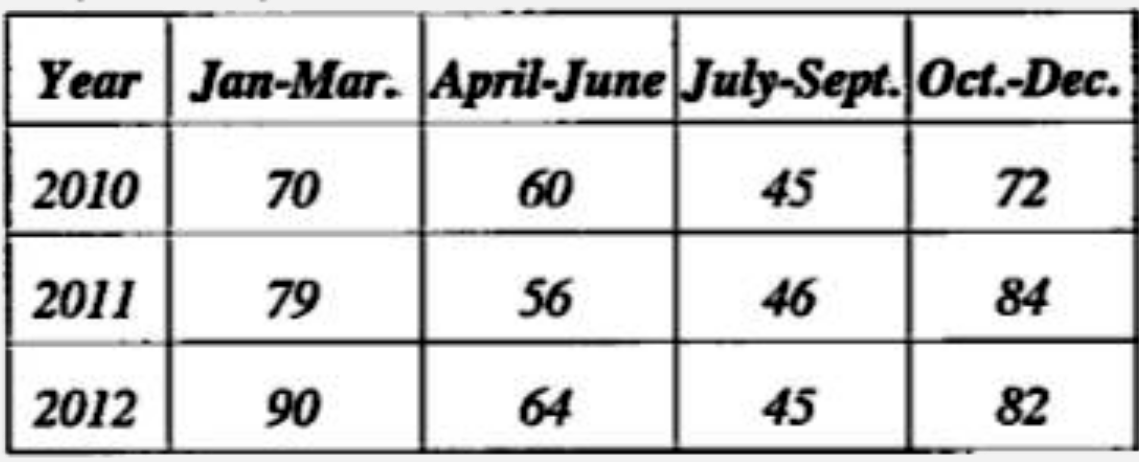
Using the following data. Find out the trend using Quarterly moving average and plot them on graph

The correct Answer is:Trend values are 43,38,51,63,53,75,56,38,52,12,47,88,50,25
Topper's Solved these Questions
Similar Questions
The number of road accidents in the city due to rash driving over a period of 3 years, is given in the following table :

Calculate four quarterly moving averages and illustrate them and original figures on one graph using the same axes for both.
View SolutionDaily absence from a school during three weeks is recorded as follows :

Draw a graph , illustrating the above data . Calculate the 5 - days moving average and plot them on the same graph .
View SolutionThe following table gives the number of failures of commercial industries in a country during the year 1975 to 1990

Draw a graph illustrating these figures. Calculate the 4 yearly moving averages and plot them on the same graph.
View SolutionThe following table gives the numbers of failures of commercial industries in a country during the years 2000 to 2015.

Draw a graph illustrating these figure.
Calculate the 4 yearly moving averages and plot them on the same graph.
View SolutionFind out Qty dd by 'A' using the following data:

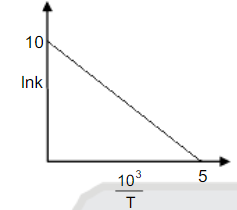
View SolutionUsing following graph find activation energy (in KJ)

View SolutionUsing following graph find activation energy (in KJ)

View SolutionUsing the income method find out the national income from the following data :

View SolutionObtain trend values for data in Problem 1 using 4-yearly centered moving averages.
View SolutionFind the mode of following data, using a histogram.

View Solution
