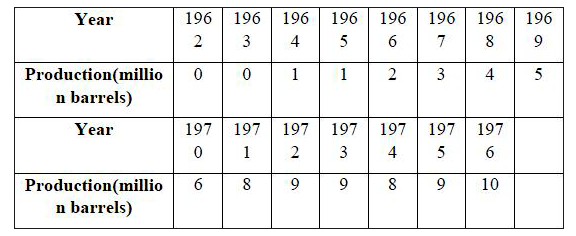
Obtain trend values for data in Problem 1 using 4-yearly centered moving averages.
The correct Answer is:(##M∀MATSTAXII01_E02151_A01##)
Topper's Solved these Questions
- QUESTION BANK 2021BOOK - NAVNEET PUBLICATION - MAHARASHTRA BOARDCHAPTER - QUESTION BANK 2021EXERCISE - Part II 4. TIME SERIES (V) Activity based questions)
4 Videos
- QUESTION BANK 2021BOOK - NAVNEET PUBLICATION - MAHARASHTRA BOARDCHAPTER - QUESTION BANK 2021EXERCISE - Part II 5. INDEX NUMBERS (I) Choose the correct alternative.)
9 Videos
- QUESTION BANK 2021BOOK - NAVNEET PUBLICATION - MAHARASHTRA BOARDCHAPTER - QUESTION BANK 2021EXERCISE - Part II 4. TIME SERIES (III) State whether each of the following is True or False.)
5 Videos
- PROBABILITY DISTRIBUTIONBOOK - NAVNEET PUBLICATION - MAHARASHTRA BOARDCHAPTER - PROBABILITY DISTRIBUTIONEXERCISE - MULTIPLE CHOICE QUESTIONS
9 Videos
- THREE DIMENSIONAL GEOMETRY BOOK - NAVNEET PUBLICATION - MAHARASHTRA BOARDCHAPTER - THREE DIMENSIONAL GEOMETRY EXERCISE - MULTIPLE CHOICE QUESTIONS
8 Videos
Similar Questions
Knowledge Check

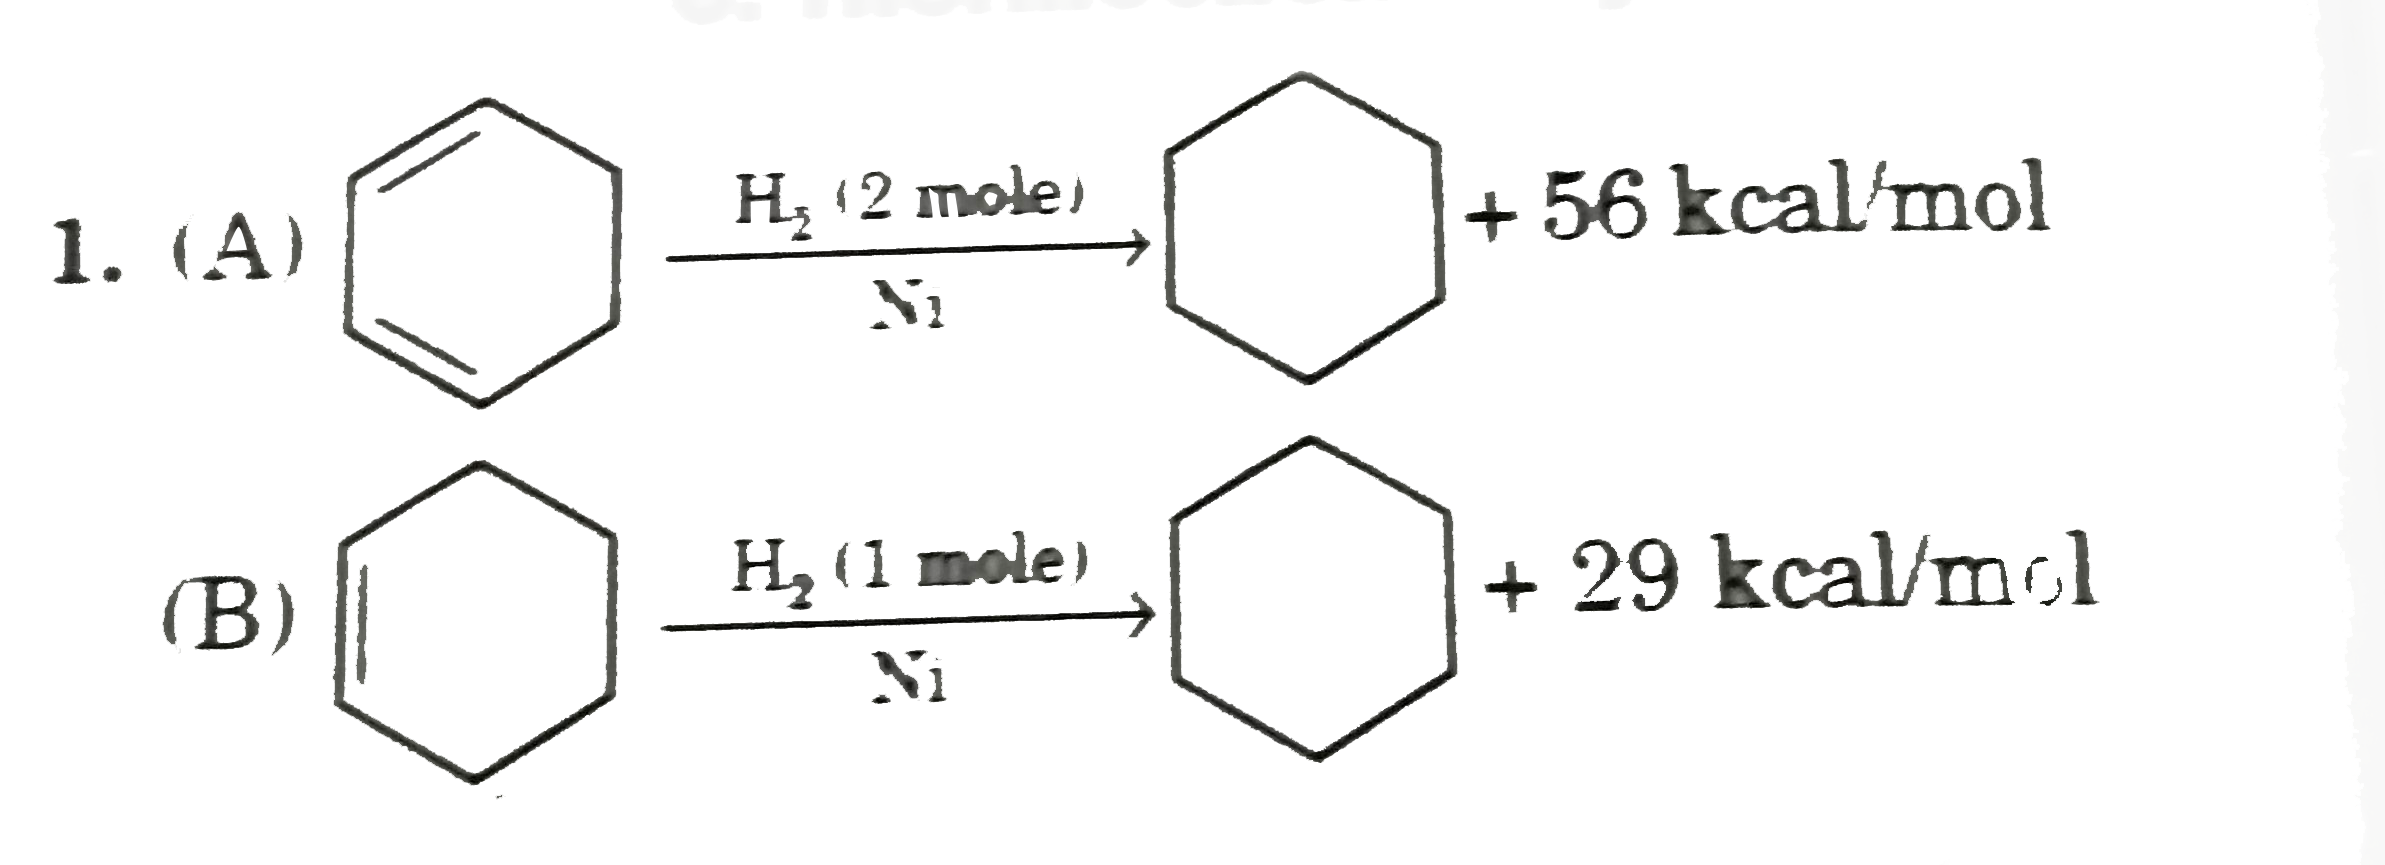
Give the value of resonance energy for using these data :A1 kcal/moleB2 kcal/moleC3 kcal/moleD4 kcal/mole
The production of cement by a firm in years 1 to 9 is given below:

Calculate the trend values for the above series by the 3 yearly moving average method.
View SolutionUsing the following data. Find out the trend using Quarterly moving average and plot them on graph

View SolutionUse the method of least squares to fit a trend line to the data in Problem 6 below. Also, obtain the trend value for the year 1975.
View SolutionIn problems on speed of a body, the average used is
View SolutionThe averge number , in thousands , of working hours lost in strikes each year of the period 2000-2009 was as under

. Calculate the three - yearly moving averages .
View SolutionThe following table gives the number of failures of commercial industries in a country during the year 1975 to 1990

Draw a graph illustrating these figures. Calculate the 4 yearly moving averages and plot them on the same graph.
View SolutionThe following table gives the numbers of failures of commercial industries in a country during the years 2000 to 2015.

Draw a graph illustrating these figure.
Calculate the 4 yearly moving averages and plot them on the same graph.
View Solution

