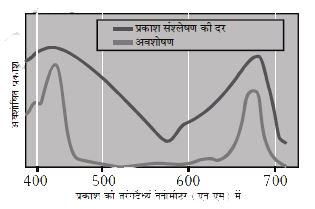
The graphic representation showing rate of photosynthesis at different wavelength of light is called asSolution in Marathi
action spectrum
Emerson spectrum
absporption spectrum
both action and absorption spectrum
Step by step video & image solution for The graphic representation showing rate of photosynthesis at different wavelength of light is called as by Biology experts to help you in doubts & scoring excellent marks in Class 11 exams.
Updated on:21/07/2023Topper's Solved these Questions
Similar Questions
Which one of the following will grow better in moist and shady region?
View SolutionThe term 'meristem' was given by…….
View SolutionWavelength of light least effective in photosynthesis is
View SolutionMost effective wavelength of light for photosynthesis is
View SolutionThe graph representing absorption of light at different wavelength is called
View SolutionThe graph showing rate of photosynthesis at different wavelength of light is called
View SolutionEffectiveness of different wavelength of light on photosynthesis is measured by
View SolutionAssertion :- Presence of accessory pigments enhances rate of photosynthesis. Reason :- They enable a wider range of wavelength of incoming light to be utilised for photosynthesis.
View SolutionWith graphical representation explain the effect of temperature on the rate of reaction.
View SolutionThe graph showing rate of Photosynthesis at different wavelengths of light is called
View SolutionThe curve showing the rate of photosynthesis at different wavelengths of light is:
View SolutionGraphical representation of population growth shows -
View Solutionनीचे दिये जा रहे आरेखीय निरूपण में एक ग्राफ दर्शाया गया है जो क्लोरोफिल 'ए' के अवशोषण वर्णक्रम पर प्रकाश संश्लेषण के क्रियात्मक वर्णक्रम के अध्यारोपण को दिखा रहा है। इसके लिए निम्न में से कौनसा सही है?

View Solutionसंकेतों का प्रयोग करते हुए आकड़ों के चित्रीय निरूपण को कहते हैं :
View SolutionEffectiveness of different wavelength of light on photosynthesis is measured by
View Solution