For a reaction, A⇔P,theplotof[A]and[P]withtimeattemperatureT_(1)andT_(2)aregivenbelow:<br><imga≤ocr_imageload∈g=lazysrc=https://d10lpgp6xz60nq.cloudfront.net/physics_images/BBP_RCM_MAC_CHE_C14_E02_058_Q01.pngwh=80%mx-autosty≤=background:white;><br>IfT_(2)gtT_(1),thecorrectstatement(s)is(are)<br>(As∑eDelltaH^(@)andDeltaS^(@)are∈dependentoftemperatureandratioof∈KatT_(1)→1nKatT_(2)isgreaterthanT_(2)//T_(1).HereT_(2)//T_(1). Here H,S,G and K are enthalpy, entropy, Gibbs energy and equilibrium constant, respectively )
ΔH∘<0,ΔS∘<0
ΔG∘<0,ΔH∘>0
ΔG∘<0,ΔS∘<0
ΔG∘<0,ΔS∘>0
The correct Answer is:A, C
As kp increases with the increase in temperature, the reaction is exothermic, i.e., ΔH<0.
Further T1(1nK)1>T2(1nK)T2
or −RT1(1nK)1<−RT2(1nK)2,i.e.,(ΔG∘)T1<(ΔG∘)T2
ΔH∘−T1ΔS∘<ΔH∘−T2ΔS∘,ΔShas to be<0.]
Topper's Solved these Questions
- CHEMICAL THERMODYNAMICSBOOK - RC MUKHERJEECHAPTER - CHEMICAL THERMODYNAMICSEXERCISE - Problems
48 Videos
- CHEMICAL KINETICSBOOK - RC MUKHERJEECHAPTER - CHEMICAL KINETICSEXERCISE - OBJECTIVE PROBLEMS
51 Videos
- DILUTE SOLUTION AND COLLIGATIVE PROPERTIESBOOK - RC MUKHERJEECHAPTER - DILUTE SOLUTION AND COLLIGATIVE PROPERTIESEXERCISE - Objective problems
36 Videos
Similar Questions
For a reaction A→P, the plots of [A] and [P] with time at temperatures T1 and T2 are given below.
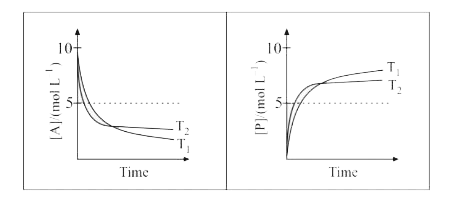
If T1>T2, the correct statements is (are):
(Assume ΔHΘ and ΔSΘ are independent of temperature and ratio of ln K at T1 to ln K at T2 is greater than T2T1. Here H,S,G and K are enthalpy, entropy, Gibbs energy and equilibrium constant, respectively).
View SolutionHere T1andT2 are
View Solution
Knowledge Check
For a reaction, A⇔P, the plots of [A[ and [P] with time at temperature T1andT2 are given ahead:
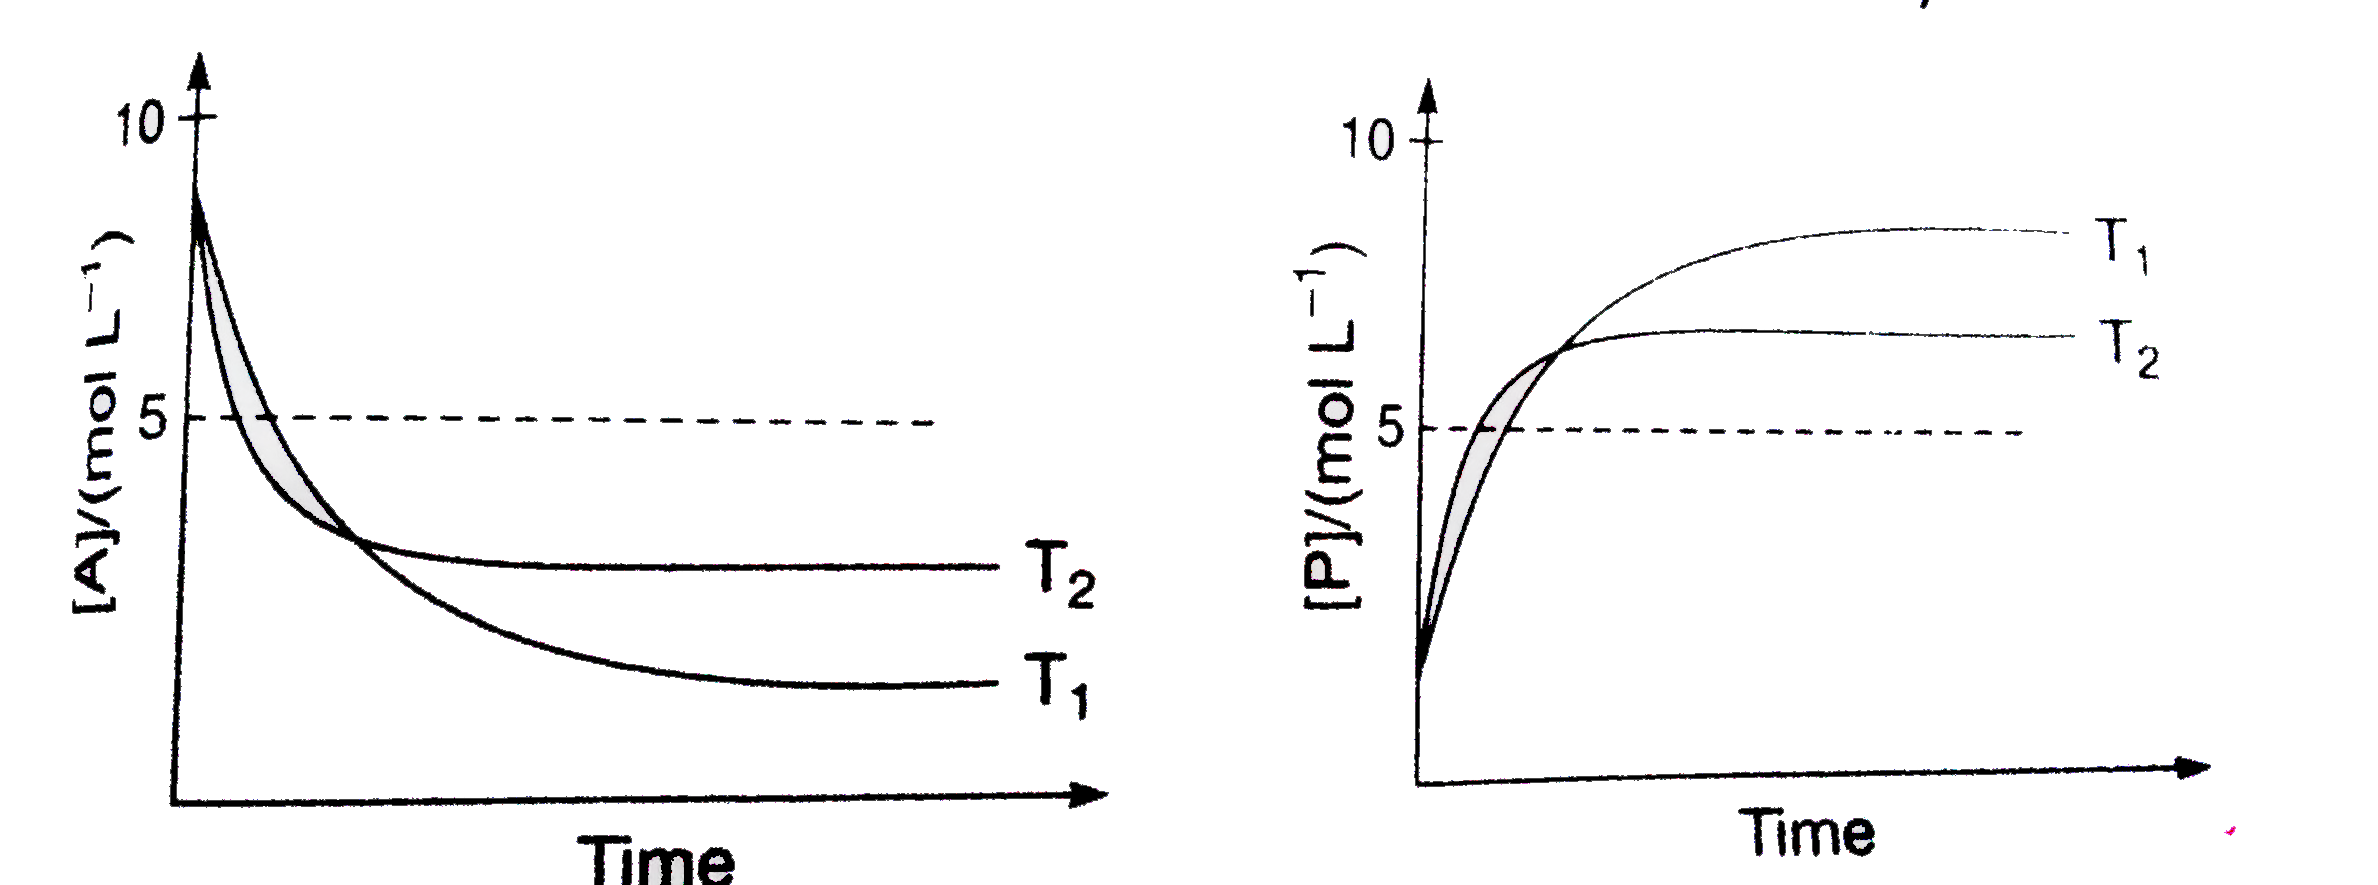 .
.
If T1>T1, the correct statement(s) is (are):
(Assume ΔH∘ and ΔS∘ are independent of temperature and ratio of ln K at T1 to ln K at T2 as greater than T2T1. Here, H,S,G and K are enthalpy, entropy, Gibbs energy and equilibrium constant, respectively.AΔH∘<0,ΔS∘<0BΔG∘<0,ΔH∘>0CΔG∘<0,ΔS∘<0DΔG∘<0,ΔS∘>0Shown below are the black body radiation curves at temperature T1 and T2(T2>T1). Which of the following plots is correct?
A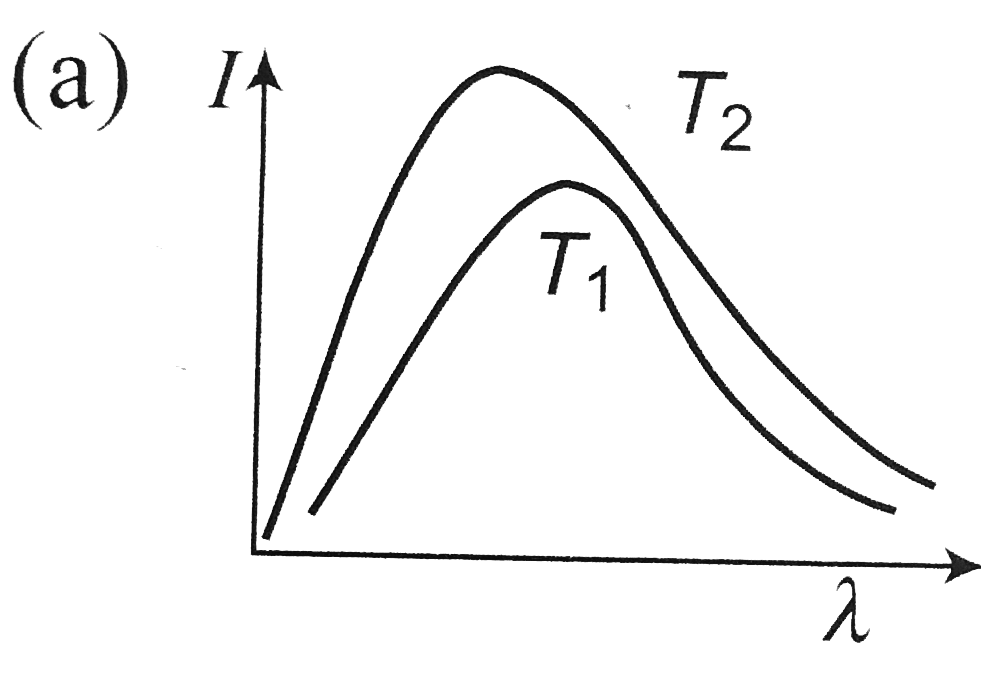 B
B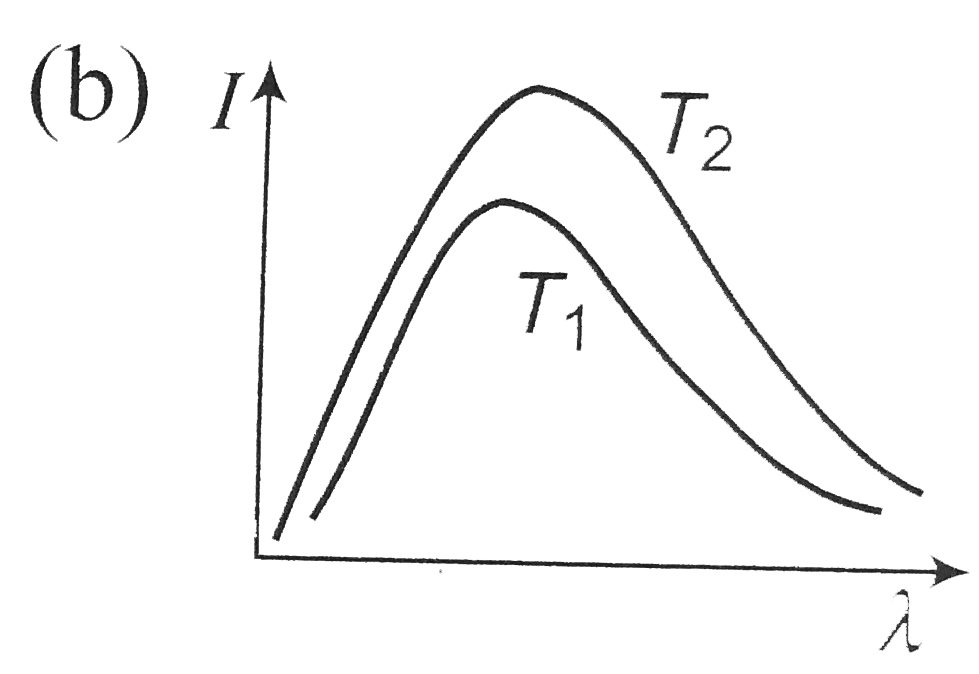 C
C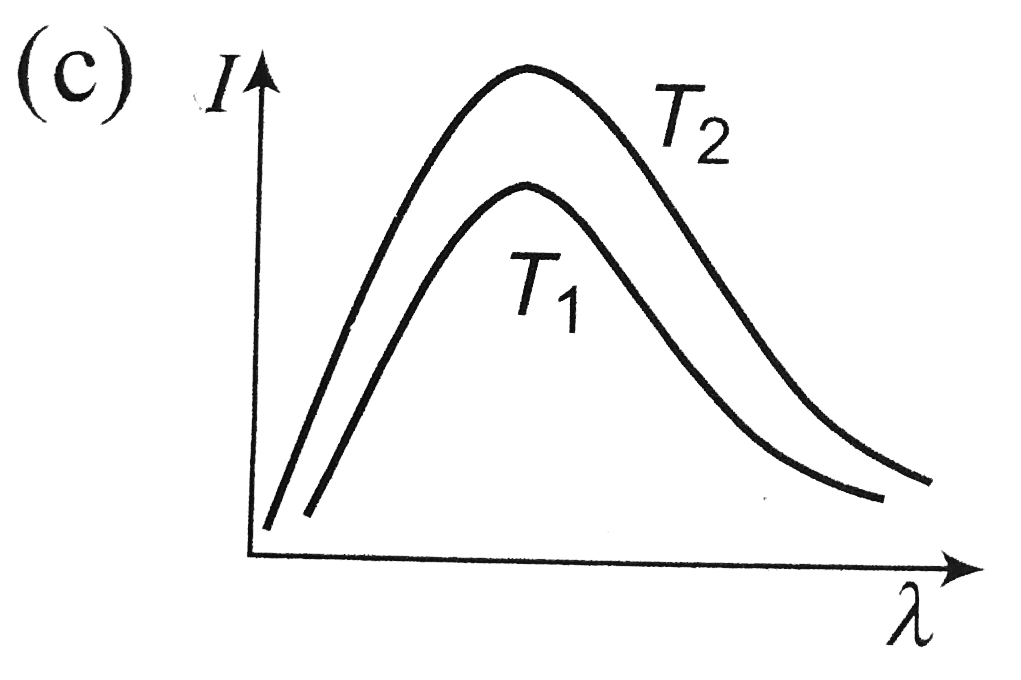 D
D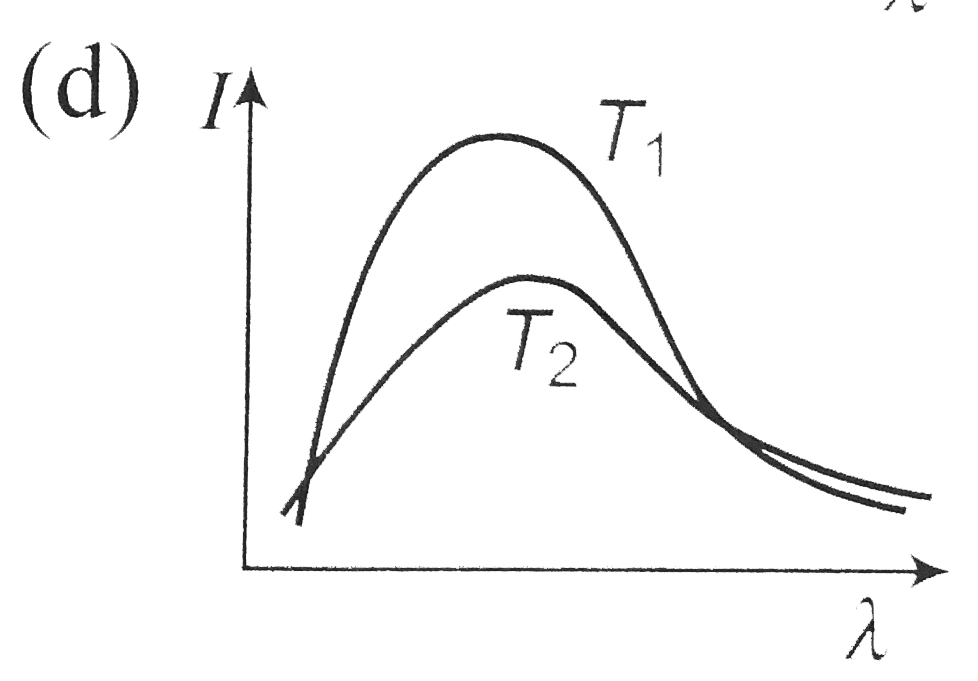
χ1 and χ2 are susceptinilities of diamagnetic substance at temperatures T1K and T2K respectively. Then
Aχ1T1=χ2T2Bχ1=χ2Cχ1√T1=χ2√T2Dχ1T2=χ2T1
Shown below are the black body radiation curves at temperature T1 and T2(T2>T1). Which of the following plots is correct?
View SolutionThe p−V diagrams of same mass of a gas are drawn at two different temperatues T1 and T2 Explain whether T1>T2> or T2>T1.
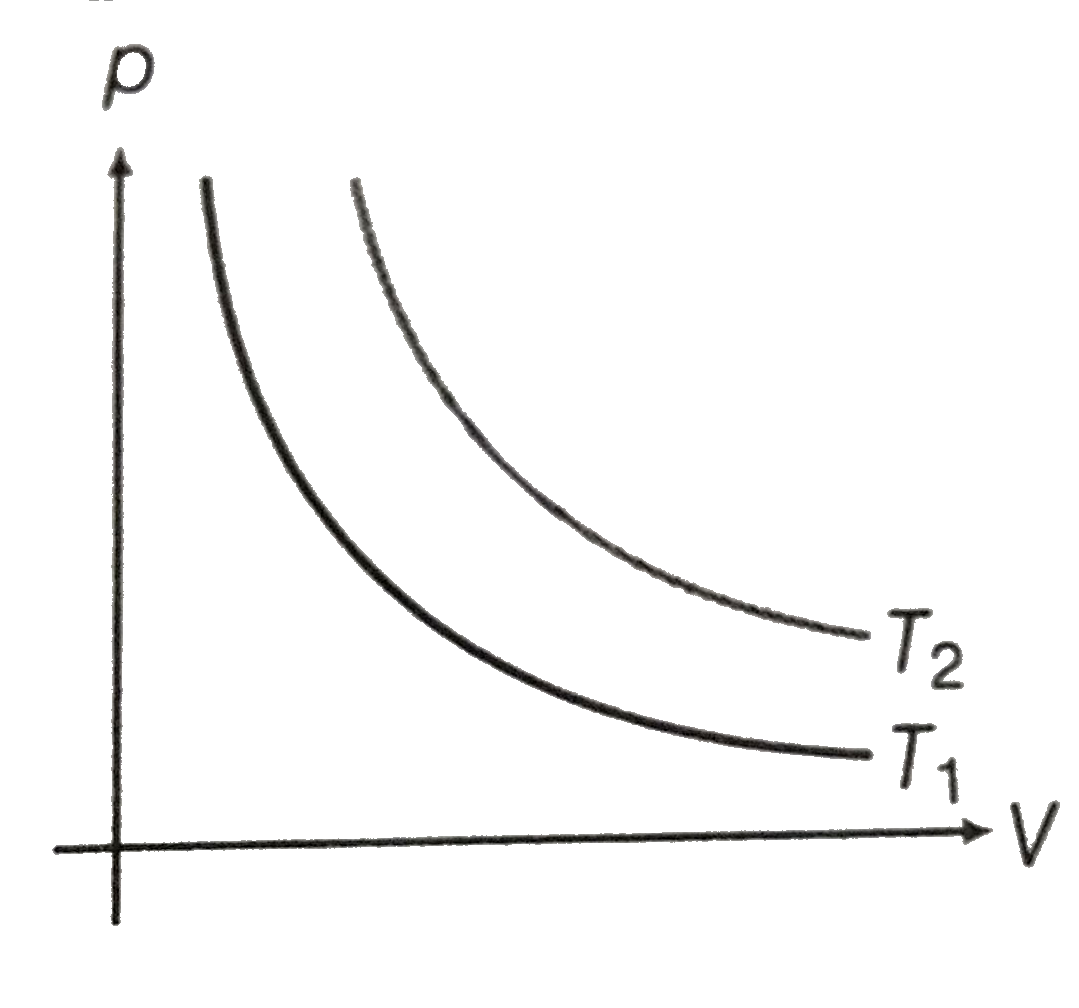
View SolutionThe p−V diagrams of same mass of a gas are drawn at two different temperatues T1 and T2 Explain whether T1>T2 or T2>T1.

View SolutionShow below are the black body radiation curves at temperature T1 and T2(T2>T1). Which of the following plots is correct?
View SolutionThe plots of intensity v/s wavelength for three at temperatures T1,T2 & T3 respectively. Their temperatures are such that (Decreasing order)

View Solution
