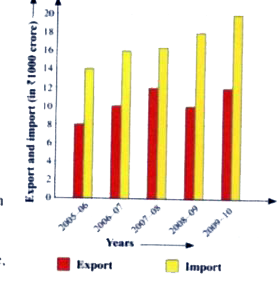
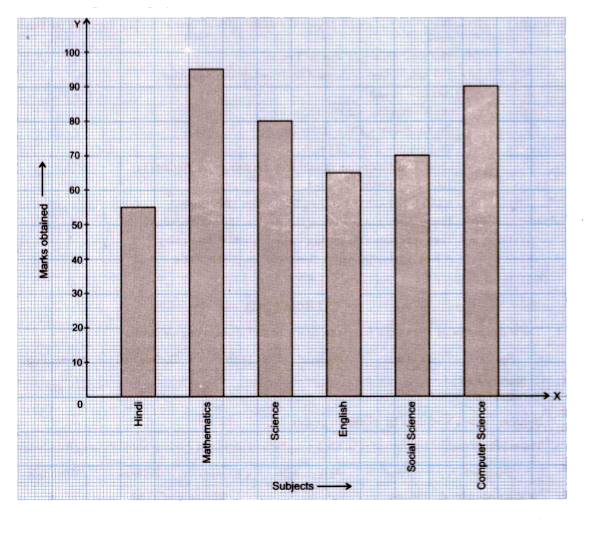
Look at the bar graph given below.
Read it care fully and answer the following questions.
(i) What information does the bar graph give?
(ii) In which subject is the student very good?
(iii) In which subject is the poor?
(iv) What is the average of his marks?
Step by step video & image solution for Look at the bar graph given below. Read it care fully and answer the following questions. (i) What information does the bar graph give? (ii) In which subject is the student very good? (iii) In which subject is the poor? (iv) What is the average of his marks? by Maths experts to help you in doubts & scoring excellent marks in Class 7 exams.
Updated on:21/07/2023Topper's Solved these Questions
- DATA HANDLING AND MEASURES OF CENTRAL TENDENCYBOOK - ICSECHAPTER - DATA HANDLING AND MEASURES OF CENTRAL TENDENCYEXERCISE - EXERCIES 18.1
37 Videos
- DATA HANDLING AND MEASURES OF CENTRAL TENDENCYBOOK - ICSECHAPTER - DATA HANDLING AND MEASURES OF CENTRAL TENDENCYEXERCISE - EXERCIES 18.2
16 Videos
- CONSTRUCTIONS BOOK - ICSECHAPTER - CONSTRUCTIONS EXERCISE - REVISION EXERCISE
12 Videos
- DATA HANDLING BOOK - ICSECHAPTER - DATA HANDLING EXERCISE - EXERCISE 24D
13 Videos
Similar Questions
Knowledge Check
Look at the picture carefully and answer the questions which follow :
What does the picture depict?AFormation of Provincial Government of Azad Hind on 21 October, 1943BFormation of Provincial Government of Azad Hind on 21 October, 1941CFormation of Provincial Government of Azad Hind on 21 October, 1942DNone of the above
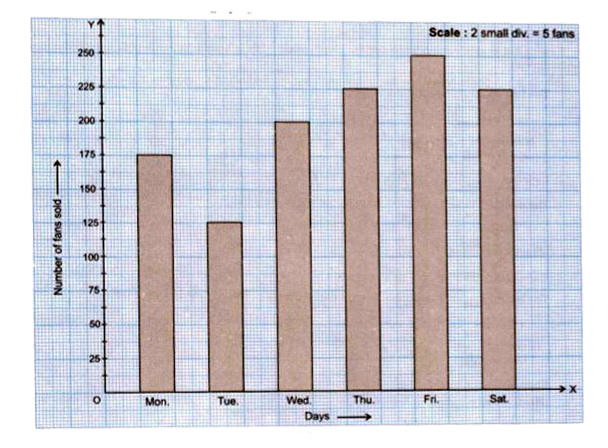
Observe the bar graph given below :
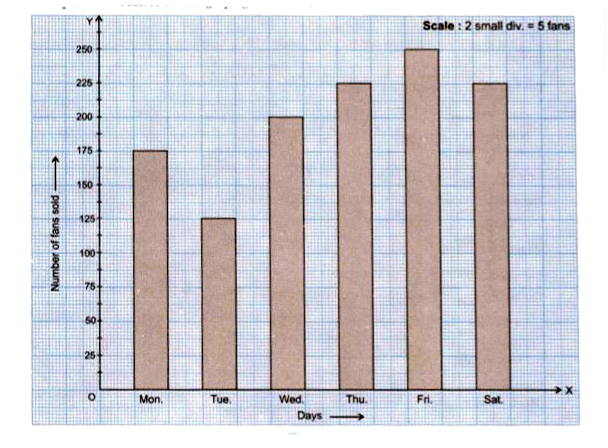
Read the bar graph carefully and answer the following questions :
What was the total sale during the week?
View SolutionObserve the bar graph given below :
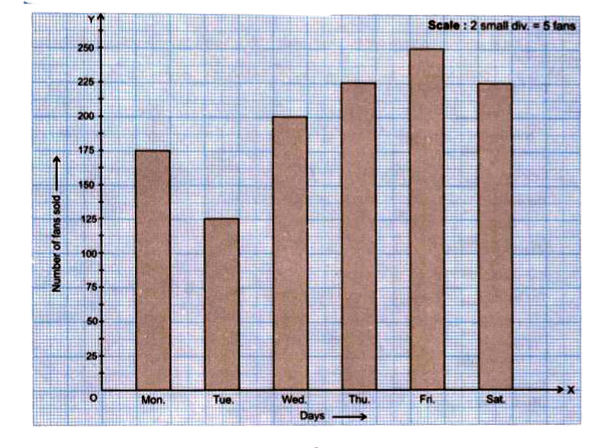
Read the bar graph carefully and answer the following questions :
What is the ratio between the minimum sale and the maximum sale?
View SolutionObserve the bar graph given below :
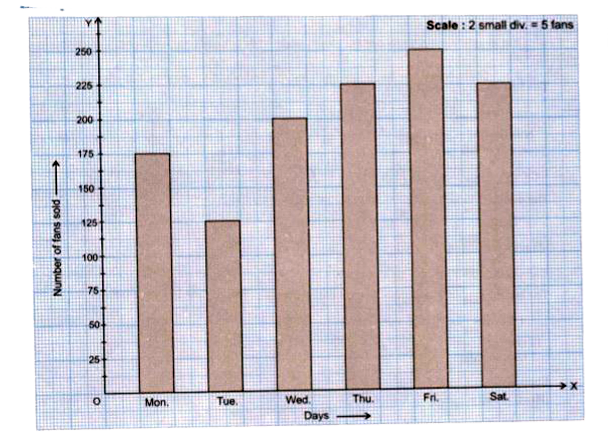
Read the bar graph carefully and answer the following questions :
On which day of the week was the sale maximum?
View SolutionRead the given bar graph and answer the question that follow :
What information is represented by the bar graph?
View SolutionRead the following bar graph shown in Figure and answer the following questions: What is the information given by the bar graph? In which month was the sale of the book maximum? In which month was the sale of the book minimum? What is the total sale of the book during these five months?
View SolutionRead the following bar graph shown in Figure and answer the following questions: What is the information given by the bar graph? In which month was the sale of the book maximum? In which month was the sale of the book minimum? What is the total sale of the book during these five months?
View SolutionRead the bar graph given below :
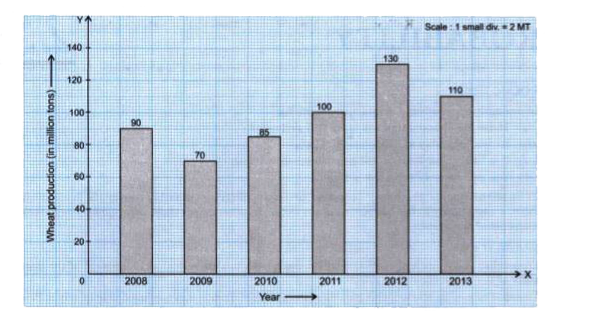
What information is given by the bar graph?
View Solution

