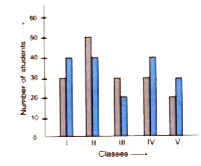
The following graph gives the number of times the numbers 1 to 6 show when a die is rolled 40 times.

Read the graph and answer the following.
Which number(s) appears/appear the least number of times?
The correct Answer is:1 and 6
Step by step video & image solution for The following graph gives the number of times the numbers 1 to 6 show when a die is rolled 40 times. Read the graph and answer the following. Which number(s) appears/appear the least number of times? by Maths experts to help you in doubts & scoring excellent marks in Class 7 exams.
Updated on:21/07/2023Topper's Solved these Questions
- DATA HANDLING AND MEASURES OF CENTRAL TENDENCYBook:ICSEChapter:DATA HANDLING AND MEASURES OF CENTRAL TENDENCYExercise:REVISION EXERCISE
Explore 39 Videos
- DATA HANDLING AND MEASURES OF CENTRAL TENDENCYBook:ICSEChapter:DATA HANDLING AND MEASURES OF CENTRAL TENDENCYExercise:WARM-UP EXERCISE
Explore 5 Videos
- DATA HANDLING AND MEASURES OF CENTRAL TENDENCYBook:ICSEChapter:DATA HANDLING AND MEASURES OF CENTRAL TENDENCYExercise:EXERCIES 18.1
Explore 37 Videos
- CONSTRUCTIONS Book:ICSEChapter:CONSTRUCTIONS Exercise:REVISION EXERCISE
Explore 12 Videos
- DATA HANDLING Book:ICSEChapter:DATA HANDLING Exercise:EXERCISE 24D
Explore 13 Videos
Similar Questions
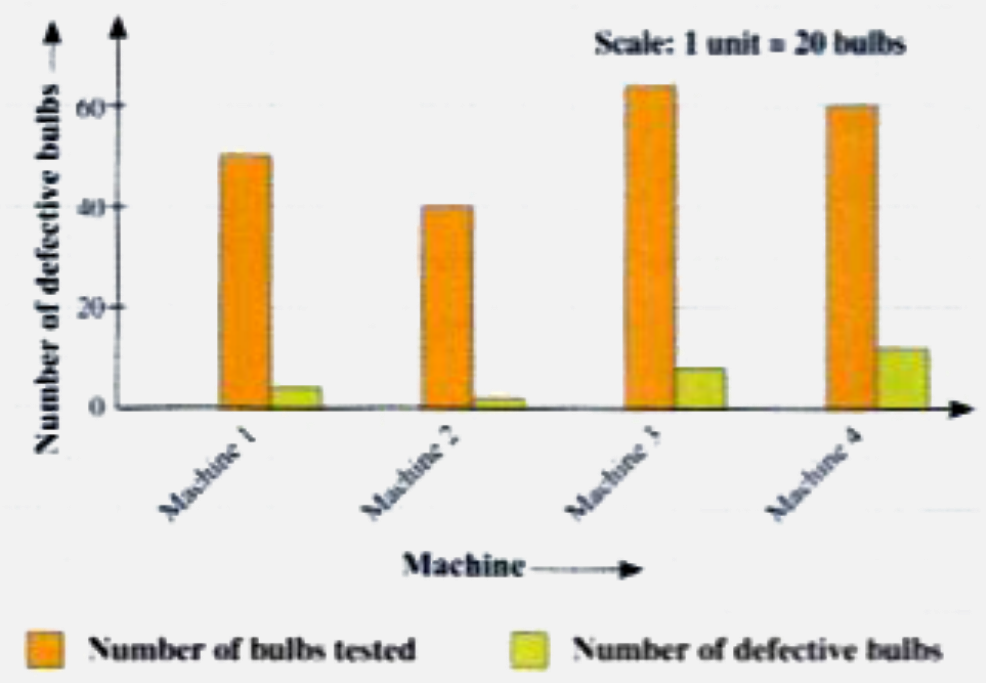
A bulb manufacturing company tests the bulbs produced by four different machines. The following graph gives the number of bulbs tested that are produced by each machine and the number that are found to be defective.

Read the graph and answer the following.
Which is the best machine?
View SolutionA bulb manufacturing company tests the bulbs produced by four different machines. The following graph gives the number of bulbs tested that are produced by each machine and the number that are found to be defective.

Read the graph and answer the following.
Which is the worst machined?
View Solution
Knowledge Check
The number 0.07 is 1000 times as large as which of the following numbers ?
A0.7B0.07C0.007D7.0E-5
The number of possible outcomes when a coin is tossed 6 times is
View SolutionExmine the given graph carefully.

In the graph show above represents the number of girls in a particular class and represents the number of boys in the same class.
Read and answer the following questions.
(i) Which class has the least number of students ?
(ii) Which class has maximum number of students ?
(iii) What is the ratio between the number of girls and the number of boys of class V.
View SolutionThe following bar graph shows the number of vehicles passing through a road crossing in Delhi in different time intervals on a particular day. Read the bar graph and answer the following questions: What does the bar graph represent? Also, give the maximum number of vehicles. When is the hourly traffic maximum? Also give the minimum number of vehicles. When is the hourly traffic minimum? What is the total number of vehicles passing through a crossing during a particular day?
View SolutionA die is rolled. List the outcomes of the event A if:
A is the event that a prime number appears.
View SolutionA die is rolled 50 times and the number 6 is obtained 8 times. Now, if the die is rolled at random, find the probability of getting the number 6.
View SolutionTotal number of 6-digit numbers in which all the odd digits appear, is
View SolutionCatherine threw a dice 40 times and noted the number appearing each time as shown below : Make a table and enter the data using tally marks. Find the number that appeared.(a) The minimum number of times (b) The maximum number of times(c) Find those numbers that appear an equal number of times
View Solution