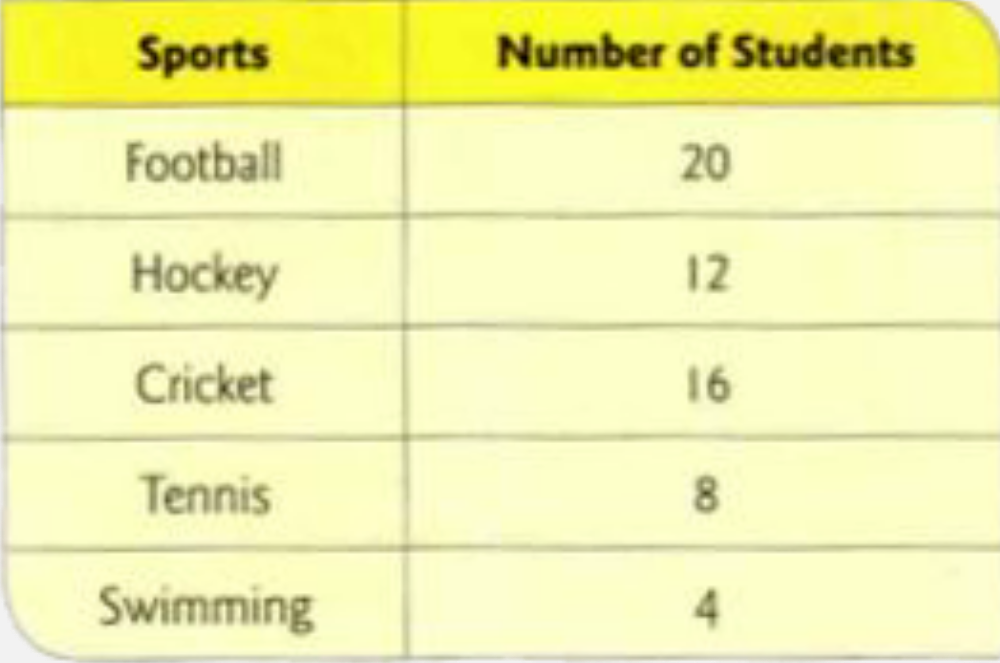
Following is a data collected from a survey of a colony about their favourite sports.

Draw a double bar graph choosing appropriate scale
Step by step video & image solution for Following is a data collected from a survey of a colony about their favourite sports. Draw a double bar graph choosing appropriate scale by Maths experts to help you in doubts & scoring excellent marks in Class 7 exams.
Updated on:21/07/2023Topper's Solved these Questions
- DATA HANDLING AND MEASURES OF CENTRAL TENDENCYBOOK - ICSECHAPTER - DATA HANDLING AND MEASURES OF CENTRAL TENDENCYEXERCISE - REVISION EXERCISE
39 Videos
- DATA HANDLING AND MEASURES OF CENTRAL TENDENCYBOOK - ICSECHAPTER - DATA HANDLING AND MEASURES OF CENTRAL TENDENCYEXERCISE - WARM-UP EXERCISE
5 Videos
- DATA HANDLING AND MEASURES OF CENTRAL TENDENCYBOOK - ICSECHAPTER - DATA HANDLING AND MEASURES OF CENTRAL TENDENCYEXERCISE - EXERCIES 18.1
37 Videos
- CONSTRUCTIONS BOOK - ICSECHAPTER - CONSTRUCTIONS EXERCISE - REVISION EXERCISE
12 Videos
- DATA HANDLING BOOK - ICSECHAPTER - DATA HANDLING EXERCISE - EXERCISE 24D
13 Videos
Similar Questions
Knowledge Check
Read the following extract from the poem, 'I Know Why the Caged Bird Sings' and answer the questions that follow by choosing the most appropriate response from the choices given below:
But a bird that stalks
down his narrow cage
can seldom see through
his bars of rage
The caged bird sings about __________Athe unknown things that he longs for and for freedomBshadows and unknown thingsCfreedom and fat wormsDfear and rage
The folliwng table shows the mode of transport used by boys and girls for going to the same school.

Draw a double bar graph representing the above data.
View SolutionConsider the following data gathered from a survey of a colony: Favourite Sport, Cricket, Basket-Ball, Swimming, Hockey, Athletics Watching, 1240, 470, 510, 423, 250 Participating, 620, 320, 320, 250, 105 Draw a double bar graph choosing an appropriate scale. What do you infer from the bar graph? Which sport is most popular? What is more preferred watching or participating in sports?
View SolutionFor the following table, draw a bar-graph

View SolutionThe following table gives the height of five trees in a garden.
<
If the given data has to be represented as a bar graph, then select the most appropriate scale from the given options that can be used to draw the bar graph.
1 unit = 1 trees
View SolutionThe following table gives the height of five trees in a garden.

If the given data has to be represented as a bar graph, then select the most appropriate scale from the given options that can be used to draw the bar graph.
1 unit = 8 trees
View SolutionThe following table gives the height of five trees in a garden.

If the given data has to be represented as a bar graph, then select the most appropriate scale from the given options that can be used to draw the bar graph.
1 unit = 20 trees
View SolutionThe following table gives the height of five trees in a garden.

If the given data has to be represented as a bar graph, then select the most appropriate scale from the given options that can be used to draw the bar graph.
1 unit = 5 trees
View Solution


