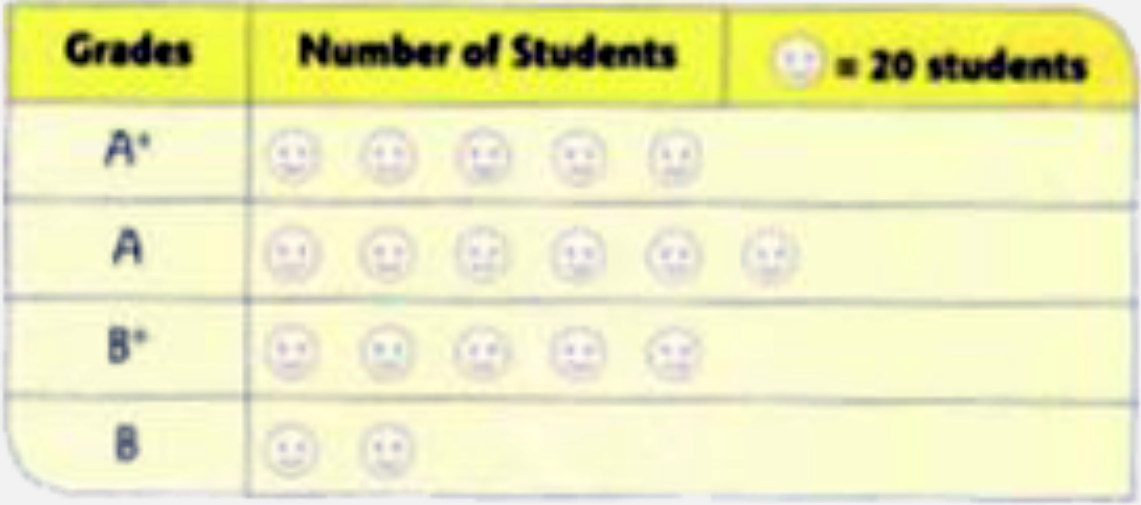
A testing centre conducted a 'Spelling Test' for class VI students. The following pictograph represents the results of the test.

Answer the following:
How many students received B grade?
The correct Answer is:40 students
Step by step video & image solution for A testing centre conducted a 'Spelling Test' for class VI students. The following pictograph represents the results of the test. Answer the following: How many students received B grade? by Maths experts to help you in doubts & scoring excellent marks in Class 7 exams.
Updated on:21/07/2023Topper's Solved these Questions
- DATA HANDLING AND MEASURES OF CENTRAL TENDENCYBOOK - ICSECHAPTER - DATA HANDLING AND MEASURES OF CENTRAL TENDENCYEXERCISE - TRY THIS
19 Videos
- DATA HANDLING AND MEASURES OF CENTRAL TENDENCYBOOK - ICSECHAPTER - DATA HANDLING AND MEASURES OF CENTRAL TENDENCYEXERCISE - REVISION EXERCISE
39 Videos
- CONSTRUCTIONS BOOK - ICSECHAPTER - CONSTRUCTIONS EXERCISE - REVISION EXERCISE
12 Videos
- DATA HANDLING BOOK - ICSECHAPTER - DATA HANDLING EXERCISE - EXERCISE 24D
13 Videos
Similar Questions
Knowledge Check
Which of the following represents a test cross?
AWw x WWBWw x WwCWw x wwDWW x WWWhich of the following does not answer iodoform test ?
An - Butyl alcoholBsec - Butyl alcoholCAcetophenoneDAcetaldehyde
Answer the following questions :
Why is soil tested for pH ?
View SolutionThe following pictograph shows the number of absentees in a class of 30 students during the previous week
View SolutionA survey was carried out in a certain school to find about different modes of transport used by students to travel to school each day. 30 students of class VI were interviewed and the data obtained was displayed in the form of a pictographs given below: Mode of Transport, Number of Students Scooter, Figure Public Bus, Figure School Bus, Figure Cycle, Figure Walking, Figure Look at the above pictograph and answer the following questions: Look at the above pictograph and answer the following questions: How many students are using cycle or walking as a mode of travel? Which is most popular mode of travel?
View SolutionIn a test. 90% of the students passed and 4 students failed. How many students appeared for the test?
View SolutionIn a class of 85% students pass in a surprise test. What per cent of students did not pass?
View SolutionTotal number of students of a school in different years is shown in the following table: Year, No. of Students 1996 1998 2000 2002 2004, 400 550 450 600 650 Represent the above data by a pictograph. Prepare a pictograph of students using one symbol an icon of a student to represent 100 students and answer the following questions: How many symbols represent total number of students in the year 2002? How many symbols represent total number of students in the year 1998? Prepare another pictograph of students using any other symbol each representing 50 students. Which pictograph do you find more informative?
View Solution
