An object is moving along a straight line with a uniform speed of 10m/s. Plot a graph showing distance versus time from t=0 to t=10s.Solution in Assamese
Step by step video & image solution for An object is moving along a straight line with a uniform speed of 10m/s. Plot a graph showing distance versus time from t=0 to t=10s. by Physics experts to help you in doubts & scoring excellent marks in Class 9 exams.
Updated on:21/07/2023Topper's Solved these Questions
Similar Questions
State the universal law of gravitation.
View SolutionHow does the sound produced by a vibrating object in a medium reach your ear?
View SolutionVelocity-time graph of a particle moving in a straight line is shown in figure. At time t=0,s=−10m. Plot corresponding a-t and s-t graphs.
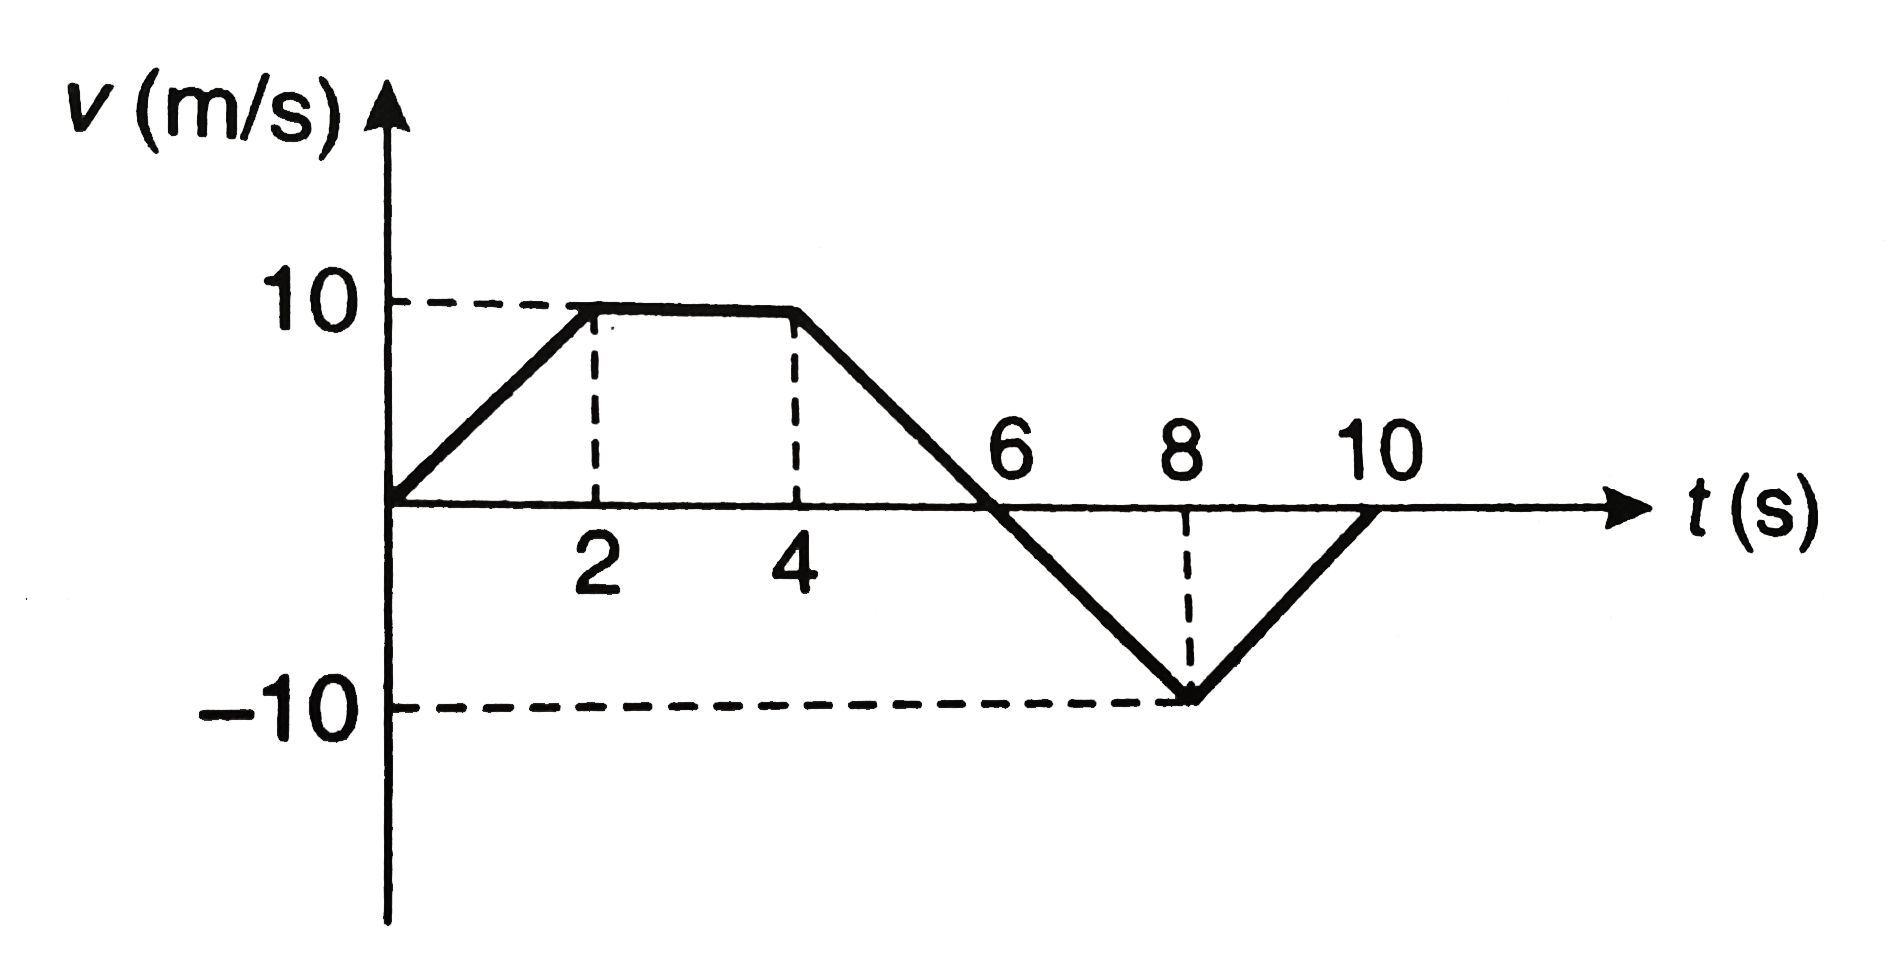
View SolutionVelocity-time graph of a particle moving in a straight line is shown in figure. At time t= 0. s = 20 m. Plot a-t and s-t graphs of the particle.
View SolutionThe diagram shows the displacement-time graph for a particle moving in a straight line. Find the average velocity for the interval from t=0 to t=5s.
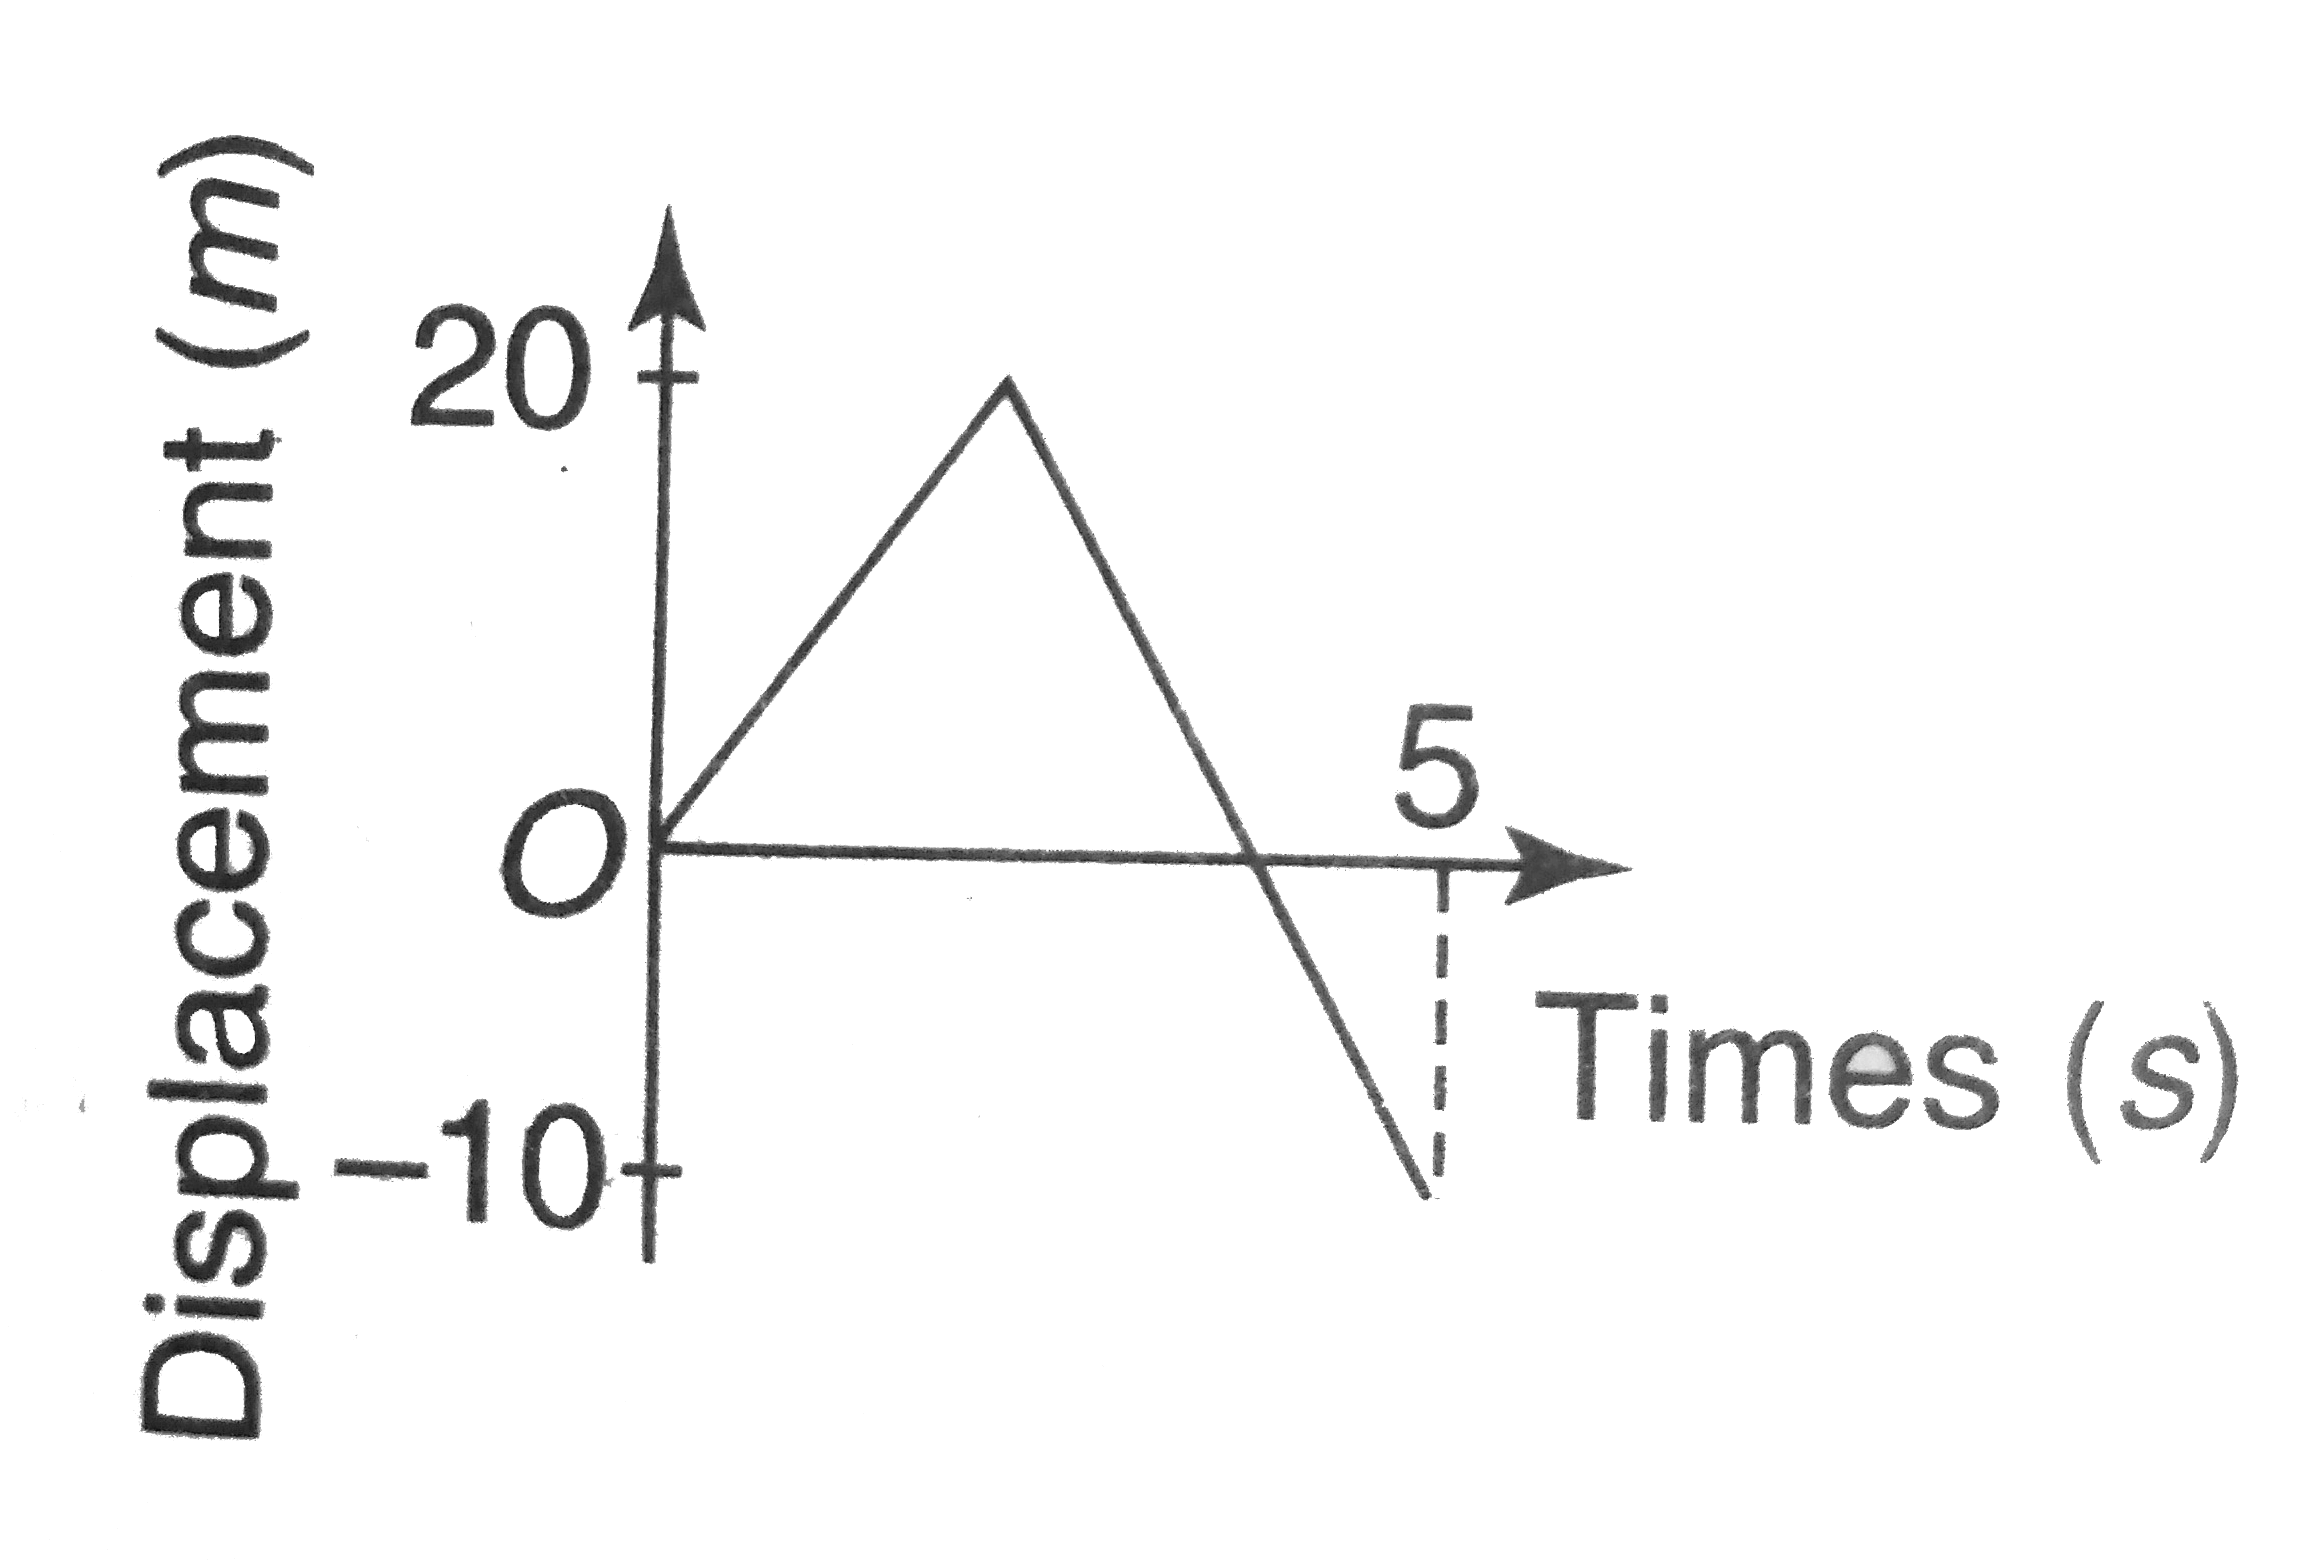
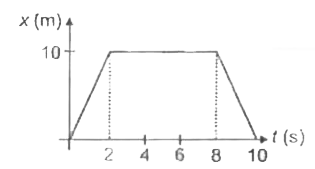
View SolutionThe position versus time graph of a particle moving along a straight line is shown. What is the total distance travelled by the particle from t=0s to t=10s?
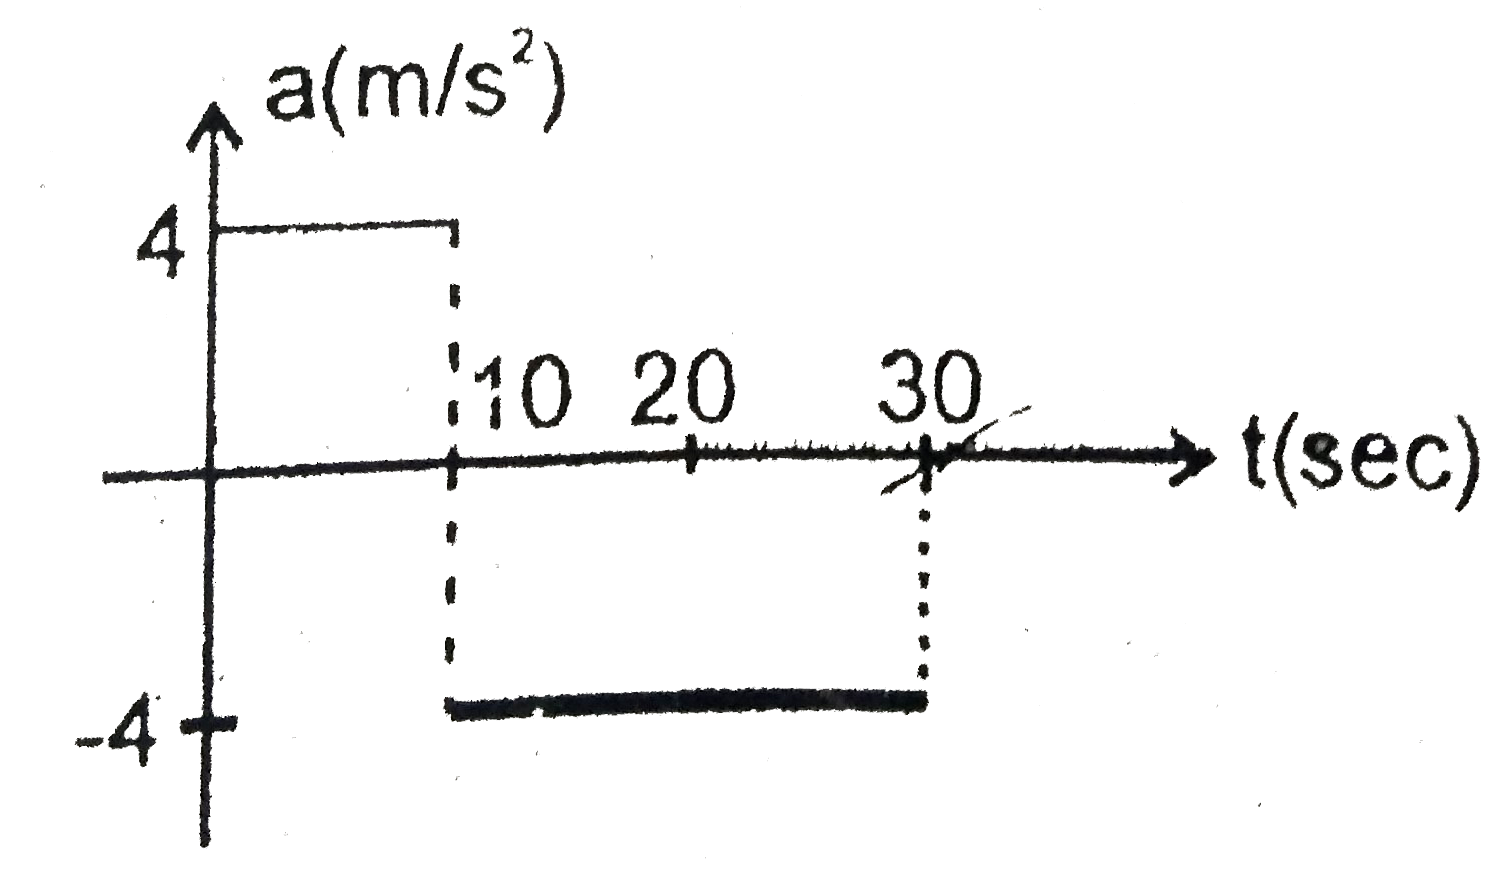
View SolutionThe acceleration versus time graph for a particle moving along a straight line is shown in the figure. If the particle starts from rest at t = 0, then its speed at t = 30 sec will be :
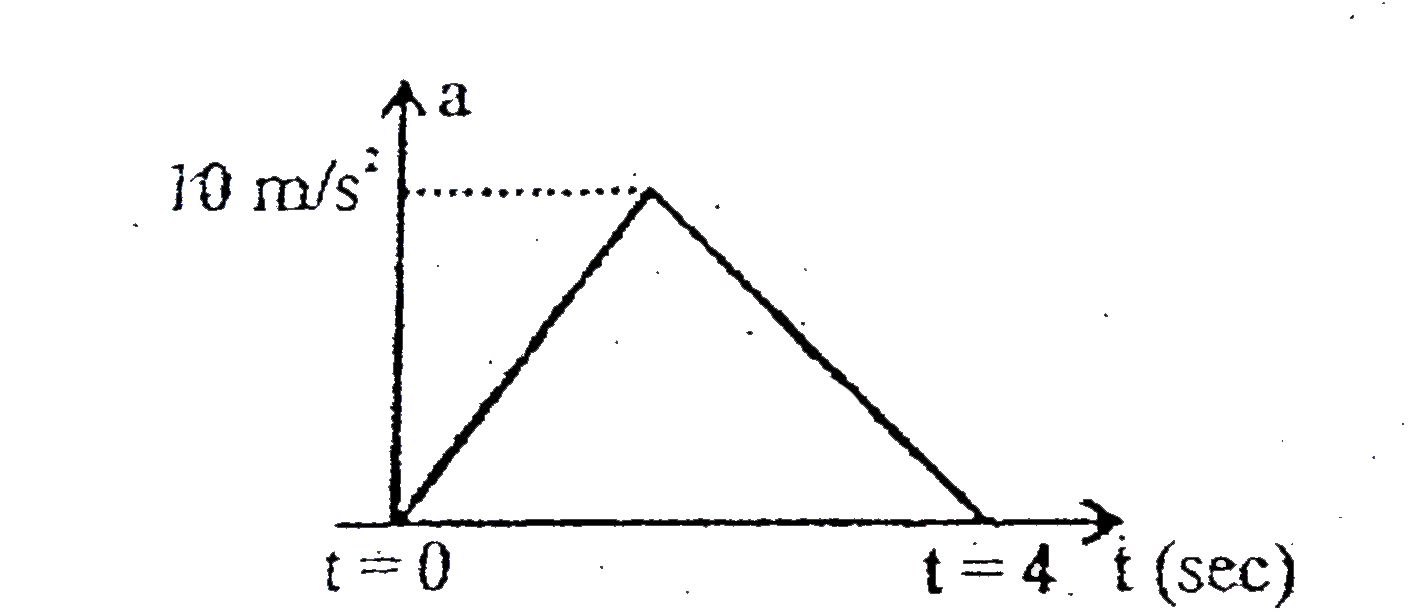
View SolutionAcceleration time graph of a particle moving along a straight line is given. Then average acceleration between t=0 & t=4 is :−
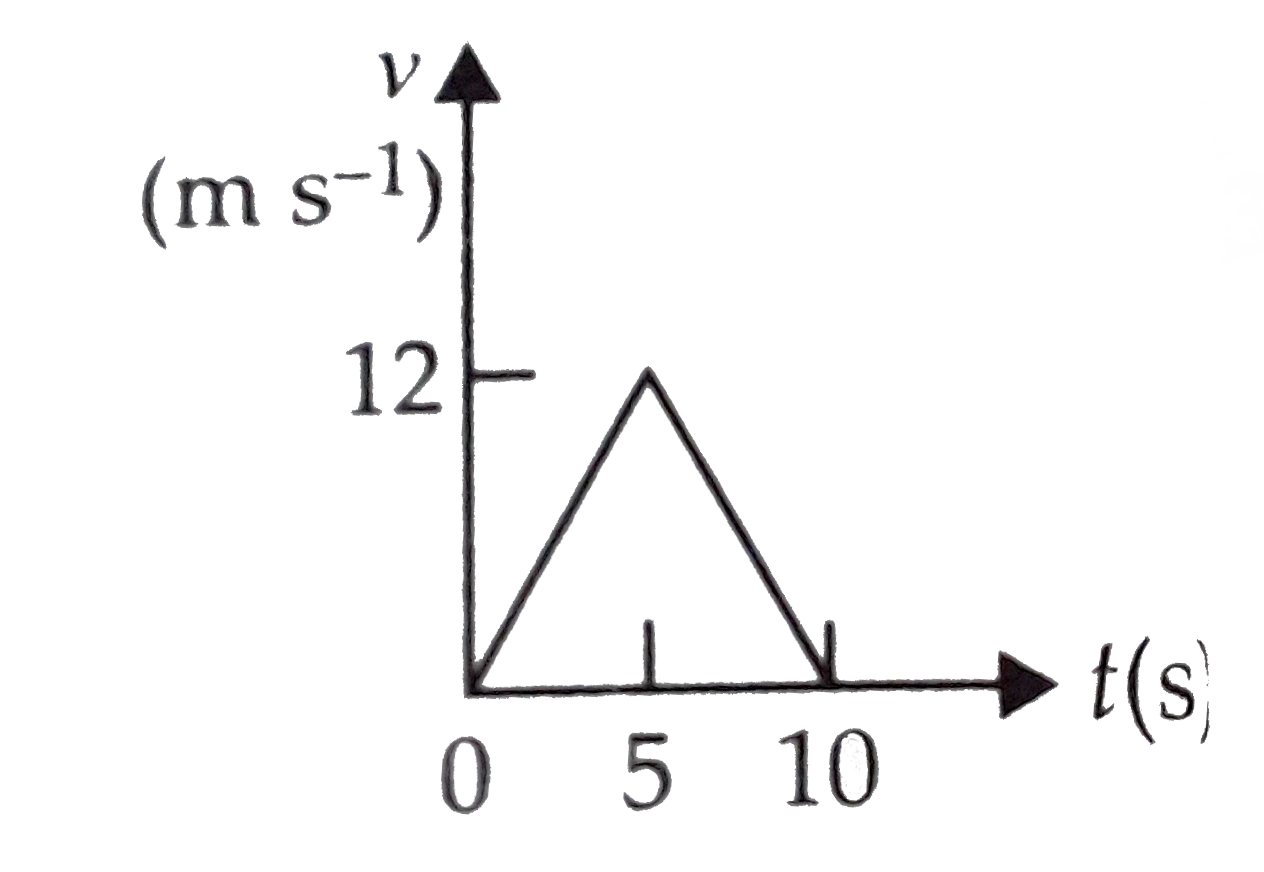
View SolutionThe velocity-time graph of an object moving along a straight line is as shown in Fig. 3.37. Find the net distance covered by the object in time interval between t=0 to t=10s. Also find the displacement in time 0 to 10 s.
View SolutionThe speed-time graph of a particle moving along a fixed direction as shown in the figure. The distance transversed by the particle between t = 0 s to t = 10 s is
View SolutionThe position - time graph for a particle moving along a straight line is shown in figure. The total distance travelled by it in time t = 0 to t = 10 s is
View SolutionThe speed-time graph of a particle moving along a fixed direction as shown in the figure. The distance traversed by the particle between t = 0 s to t = 10 s is
View SolutionVelocity-time graph of a particle moving in a straight line is shown in figure. At time t = 0, s = -10 m. Plot corresponding a-t and s-t graphs.
View SolutionThe position - time graph for a particle moving along a straight line is shown in figure. The total distance travelled by it in time t = 0 to t = 10 s is
View SolutionThe acceleration versus time graph for a particle moving along a straight line is shown in the figure. If the particle starts from rest at t = 0, then its speed at t = 30 sec will be :

View Solution
