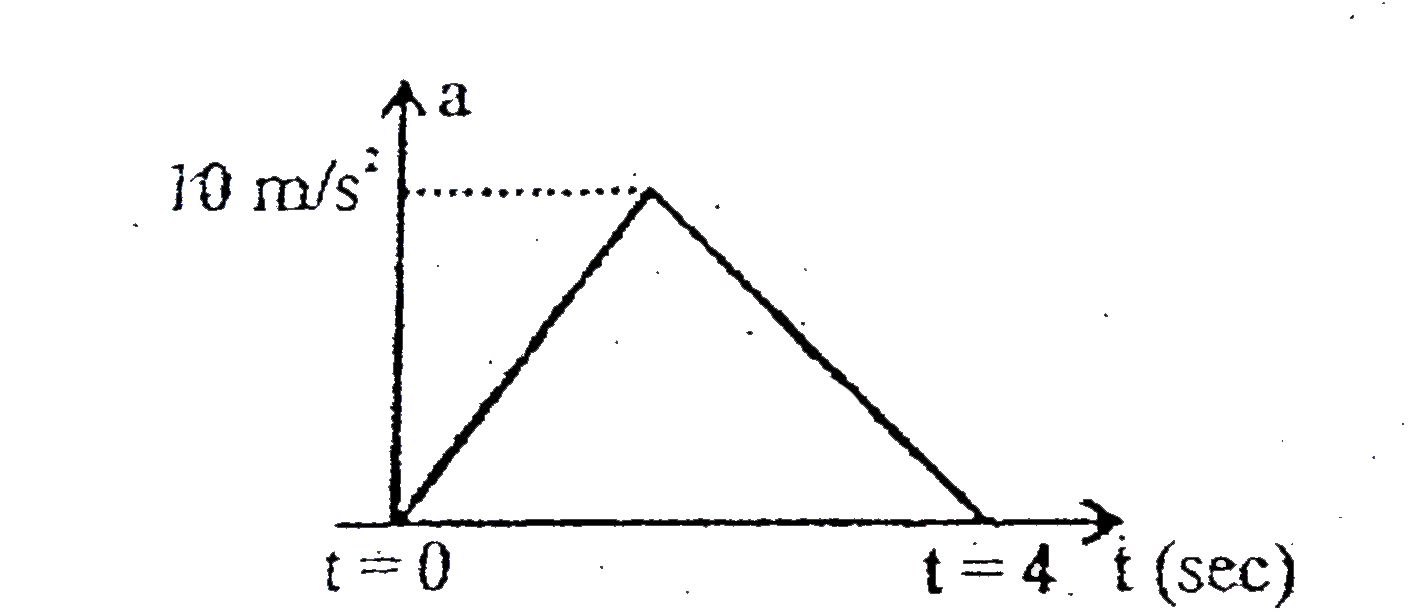
Acceleration time graph of a particle moving along a straight line is given. Then average acceleration between t=0 & t=4 is :−
0m/s2
5m/s2
10m/s2
7.5m/s2
The correct Answer is:B
Average acceleration =ΔvΔt
Δv=area=12×4×10=20
Average acceleration=204=5m/s2
Topper's Solved these Questions
Similar Questions
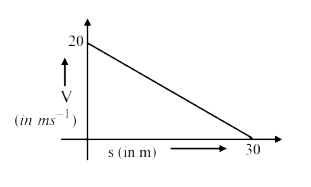
The velocity –position graph of a particle moving along a straight line is shown. Then acceleration of the particle at s = 15 m is :
 View Solution
The velocity-time graph of a particle moving along a straight line is shown is . The rate of acceleration and deceleration is constant and it is equal to 5ms−2. If the a average velocity during the motion is 20ms−1, Then
 .
.
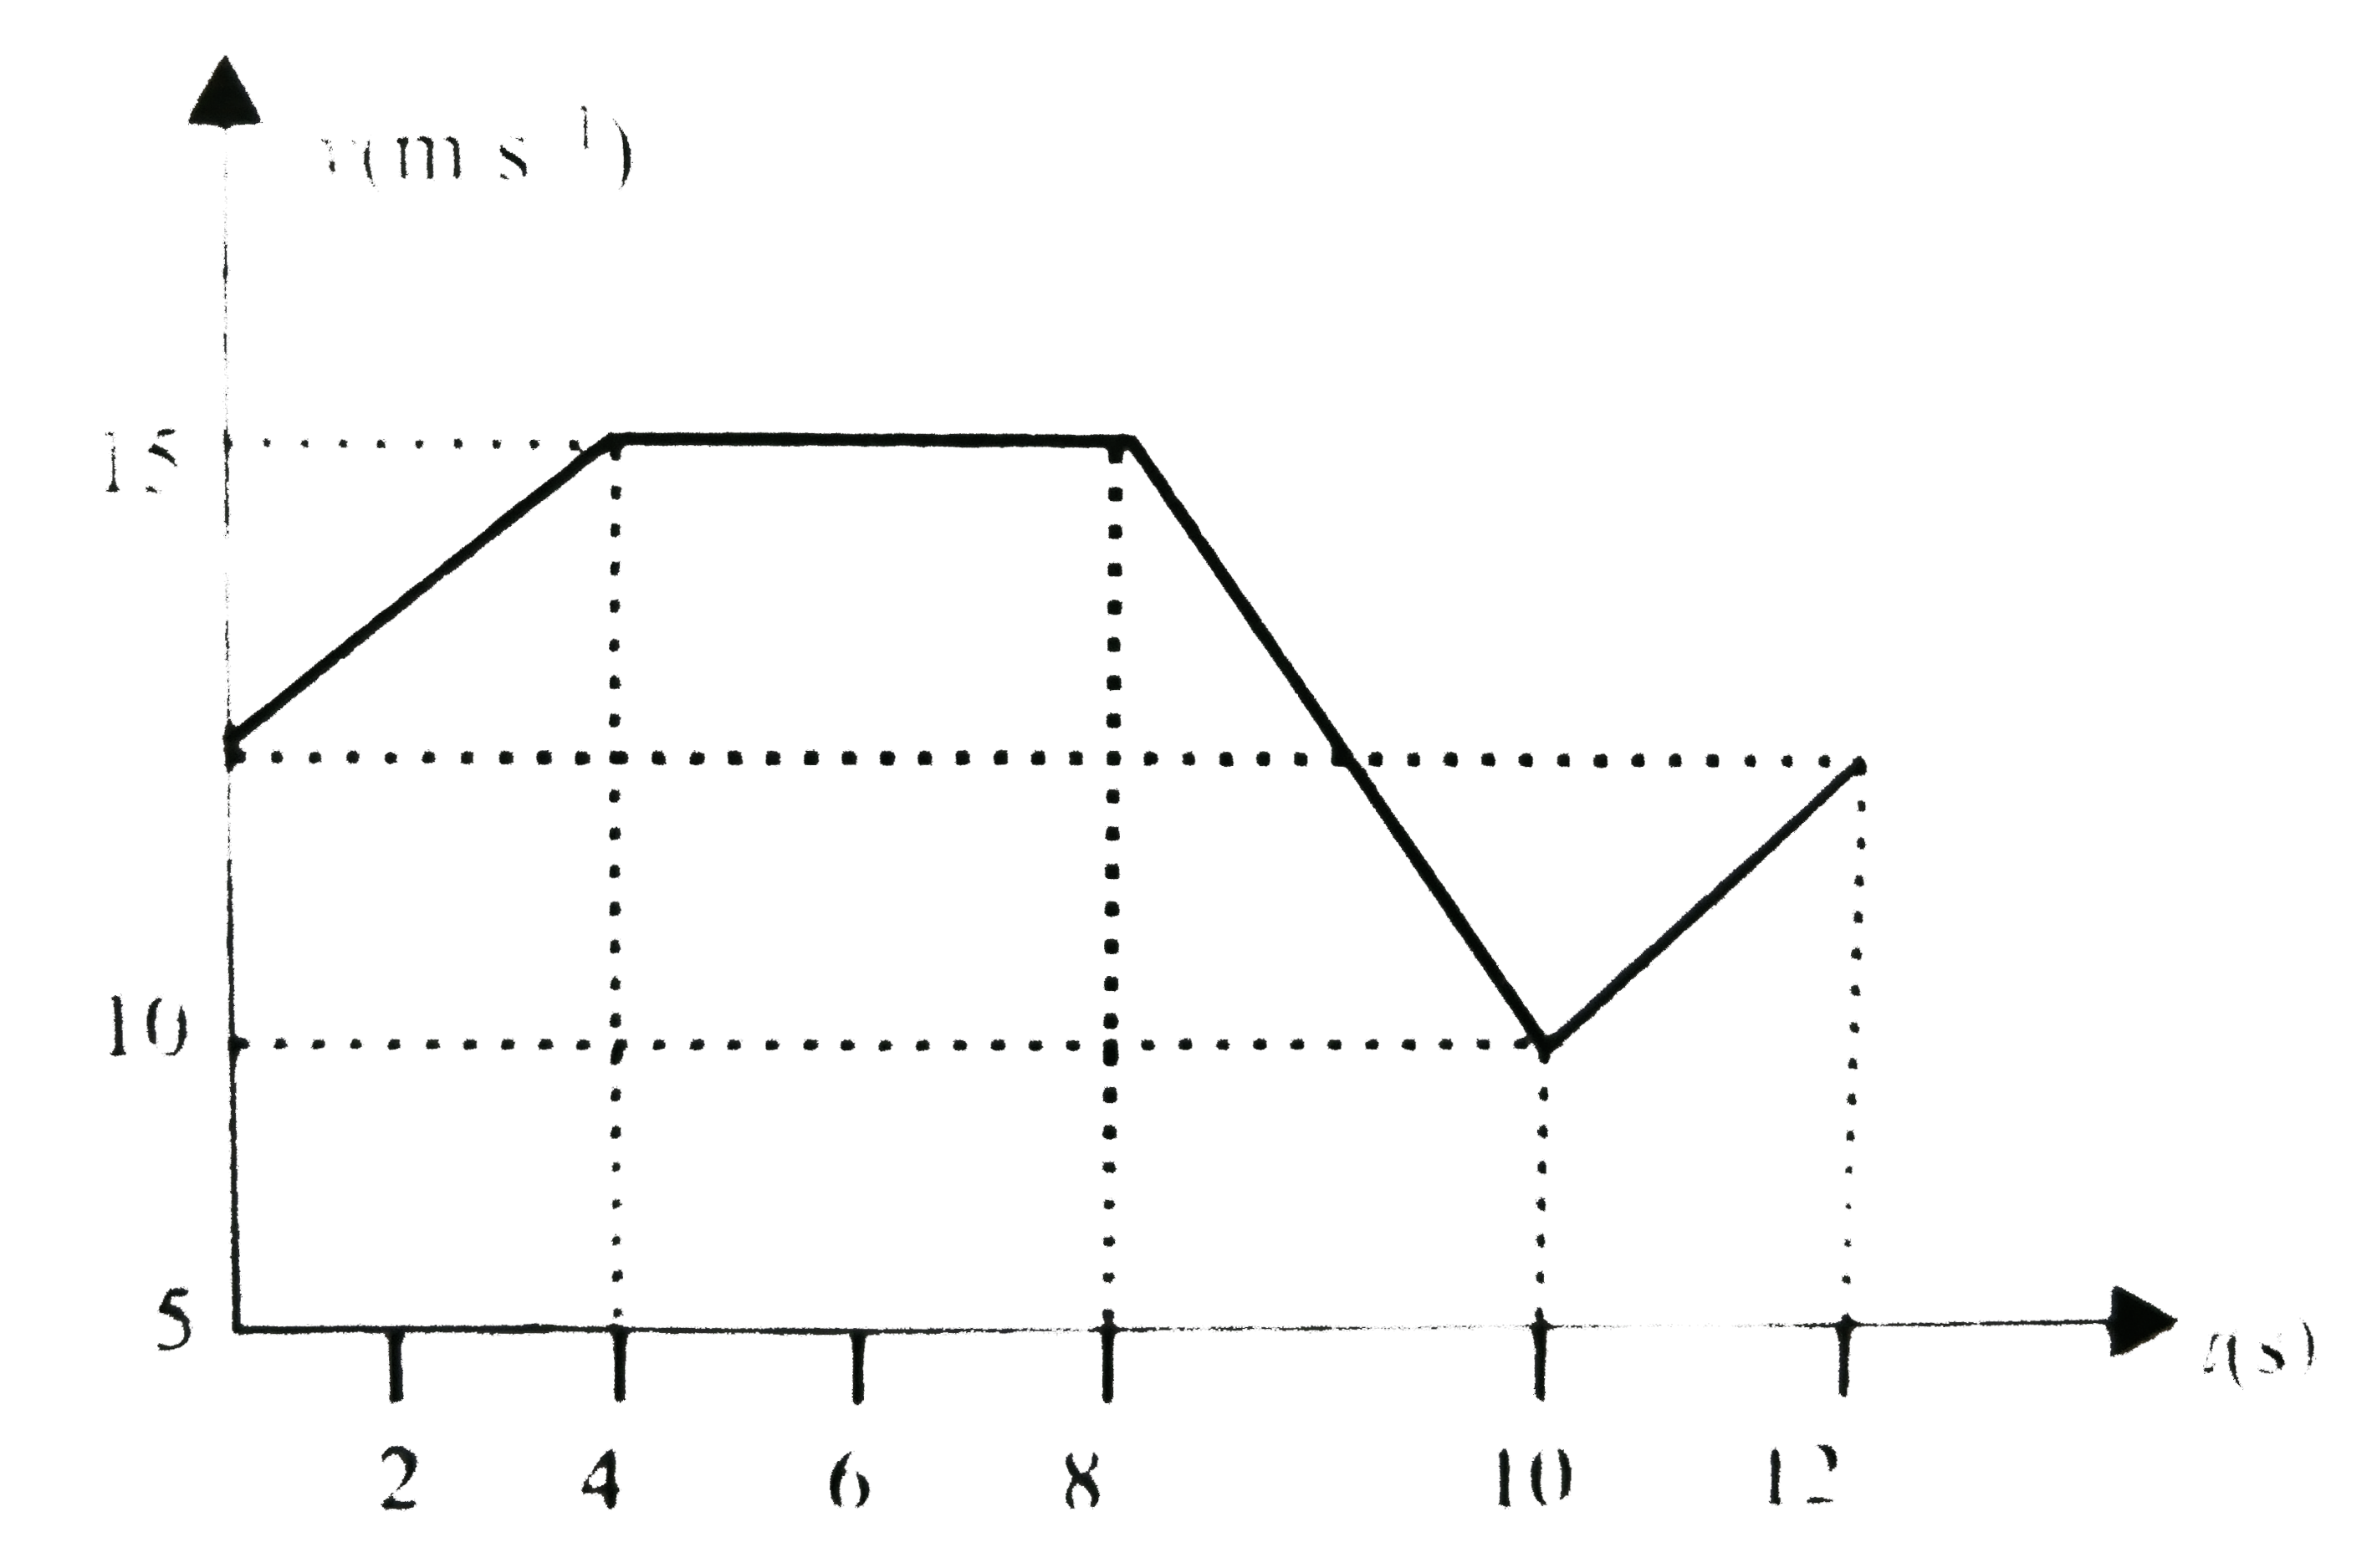
The value of t is.View SolutionThe velovity-time graph of a particle moving in a straitht line is shown in . The acceleration of the particle at t=9s is.
 .View Solution
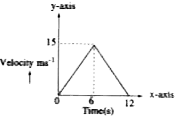
The velocity and time graph for a particle moving in a straight line s shown in the figure. Then, the average velocity between t=4 s and t=6 s is _____
 View Solution
The velocity displacement graph of a particle moving along a straight line is shown in figure.
Then the acceleration displacement graph is.View SolutionThe acceleration-time graph of a particle moving in a straight line is as shown in figure. The velocity of the particle at time t=0 is 2m/s. The velocity after 2 seconds will be
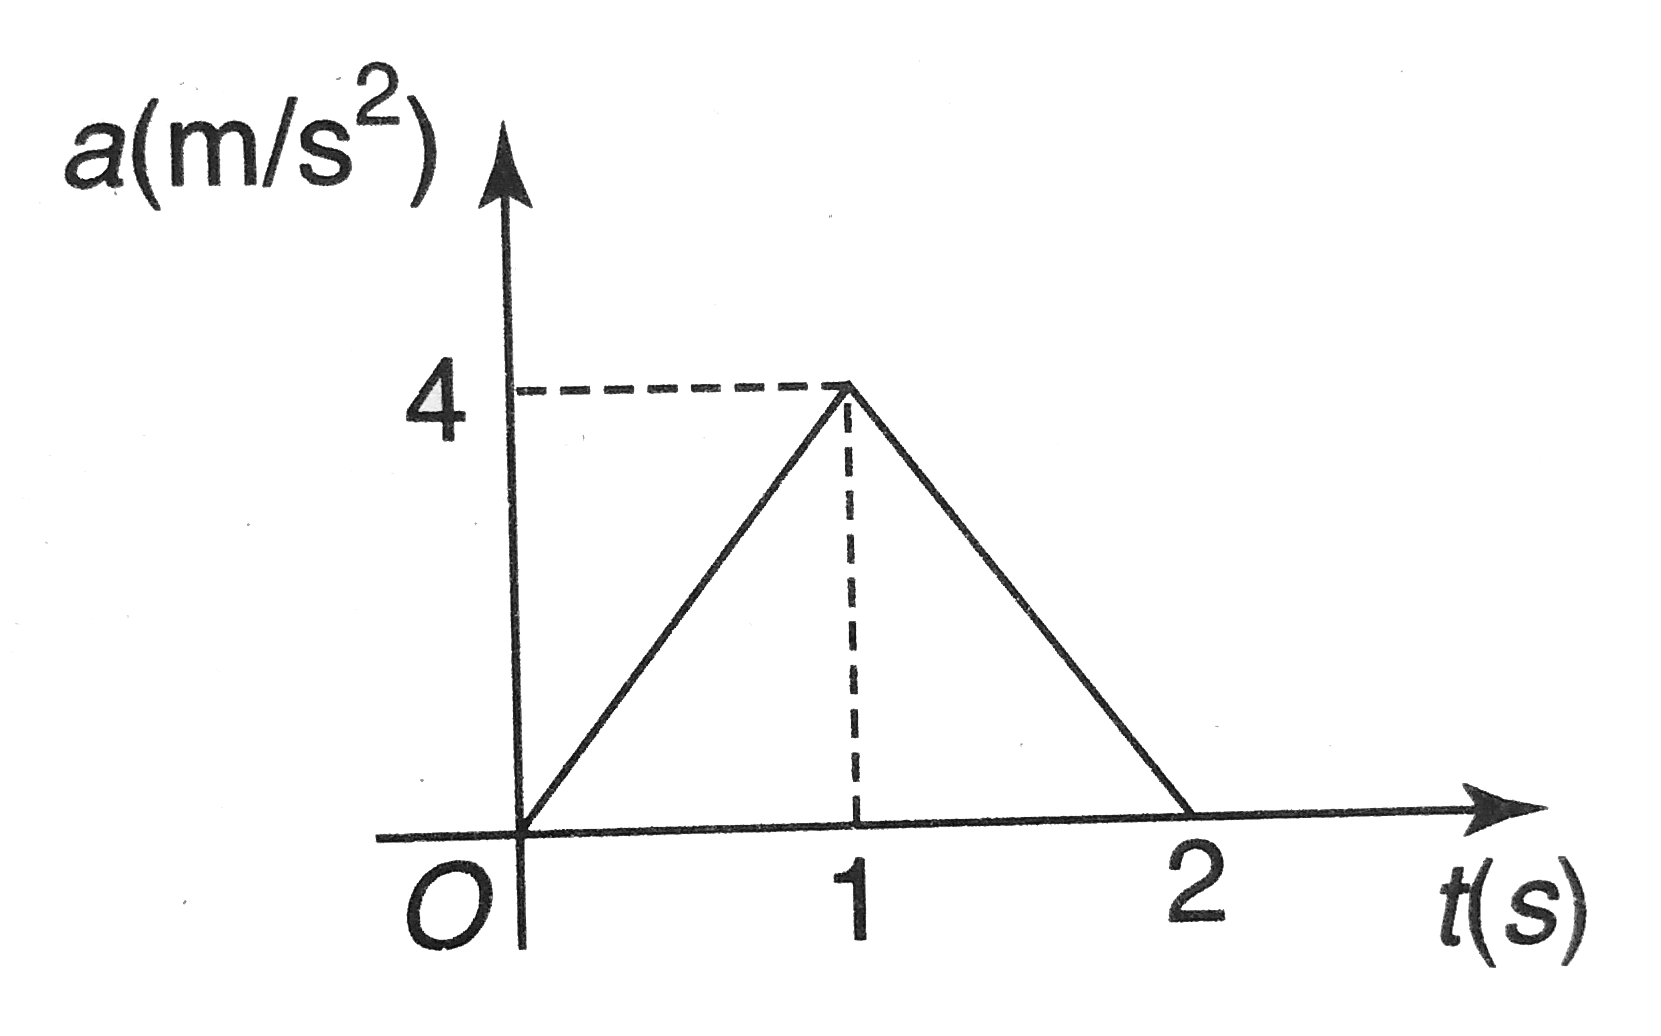 View Solution
Acceleration - time graph of a particle moving in a straight line is shown in figure. Velocity of particle at time t = 0 is 2ms−1. Find velocity at the end of fourth second.
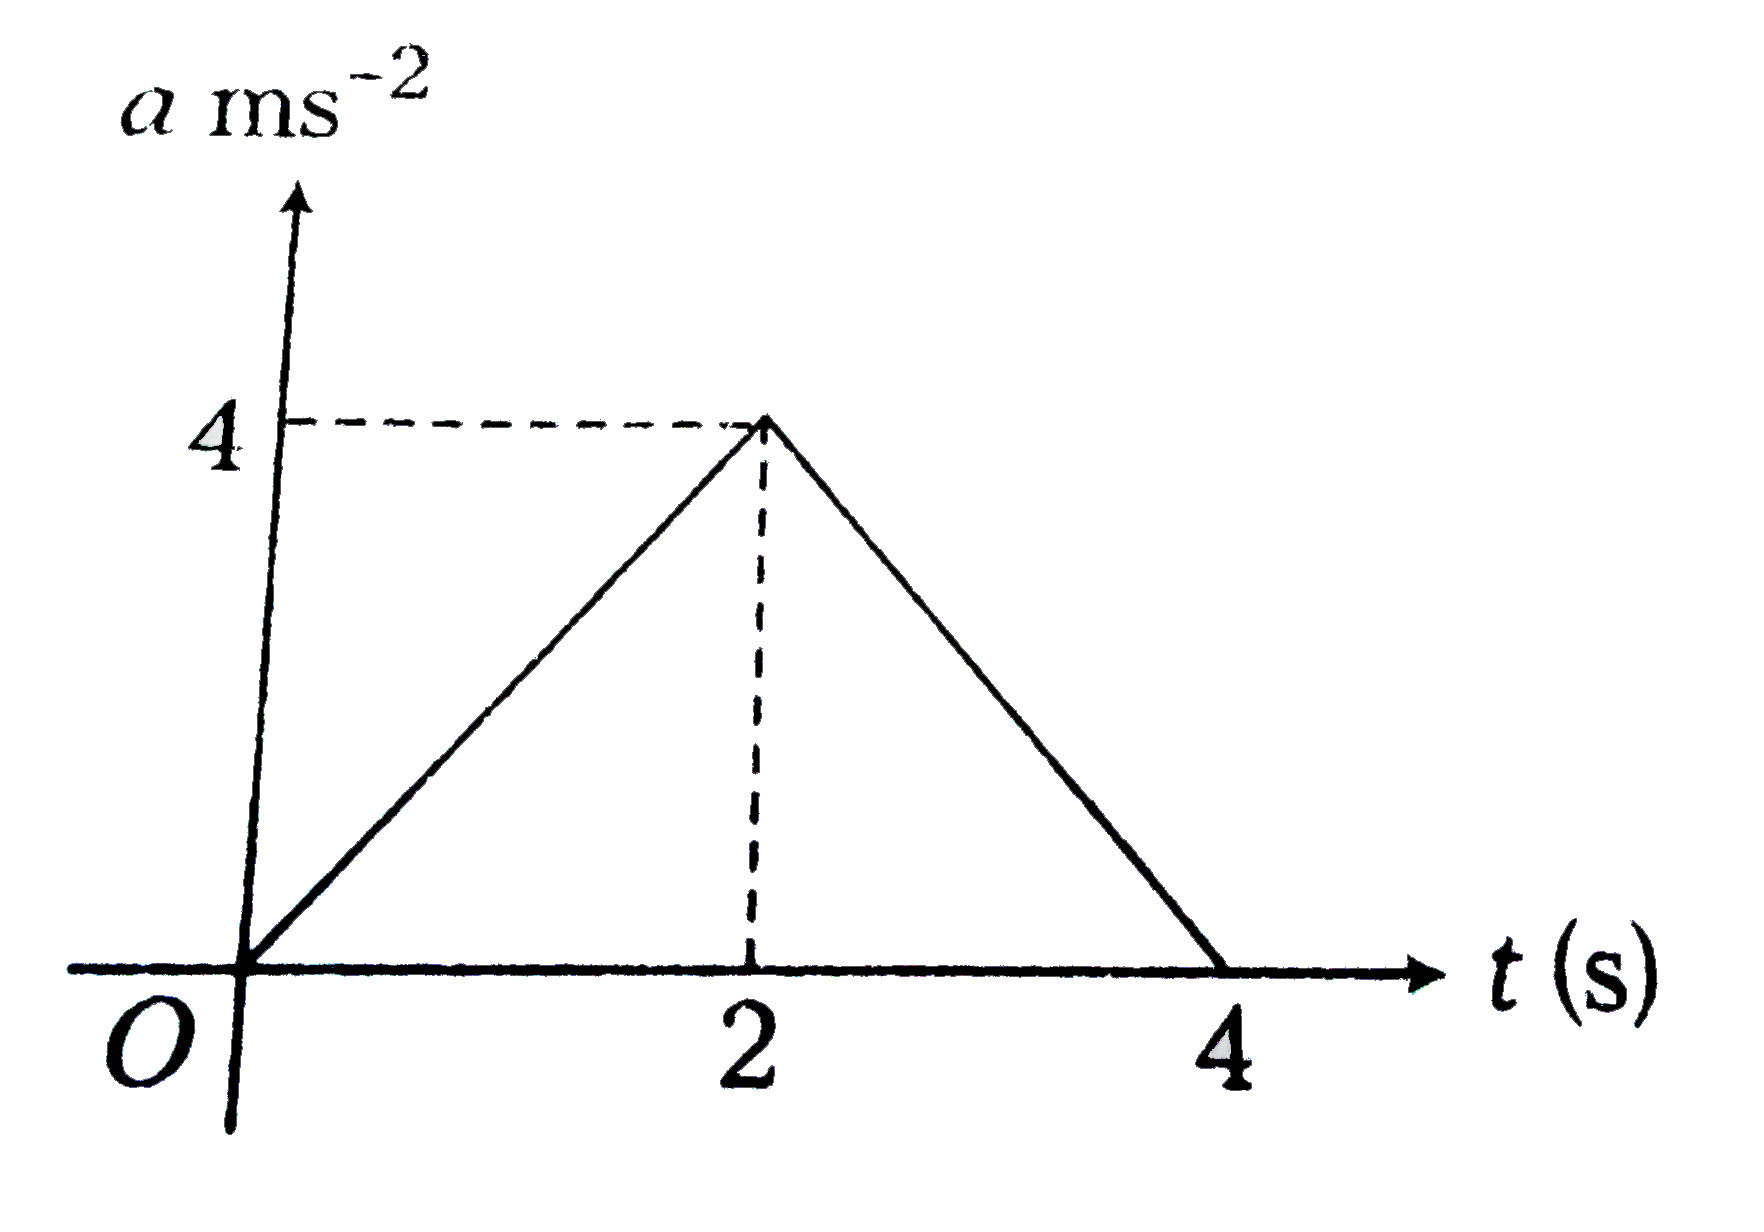 View Solution
The acceleration-time graph of a particle moving in a straight line is as shown in figure. The velocity of the particle at time t=0 is 2m/s. The velocity after 2 seconds will be
 View Solution
The speed - time graph for a body moving along a straight line is shown in figure. The average acceleration of body may be
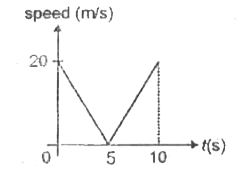 View Solution
The acceleration versus time graph of a particle moving along a straight line is shown in the figure. Draw the respective velocity-time graph Given v=0 at t=0.
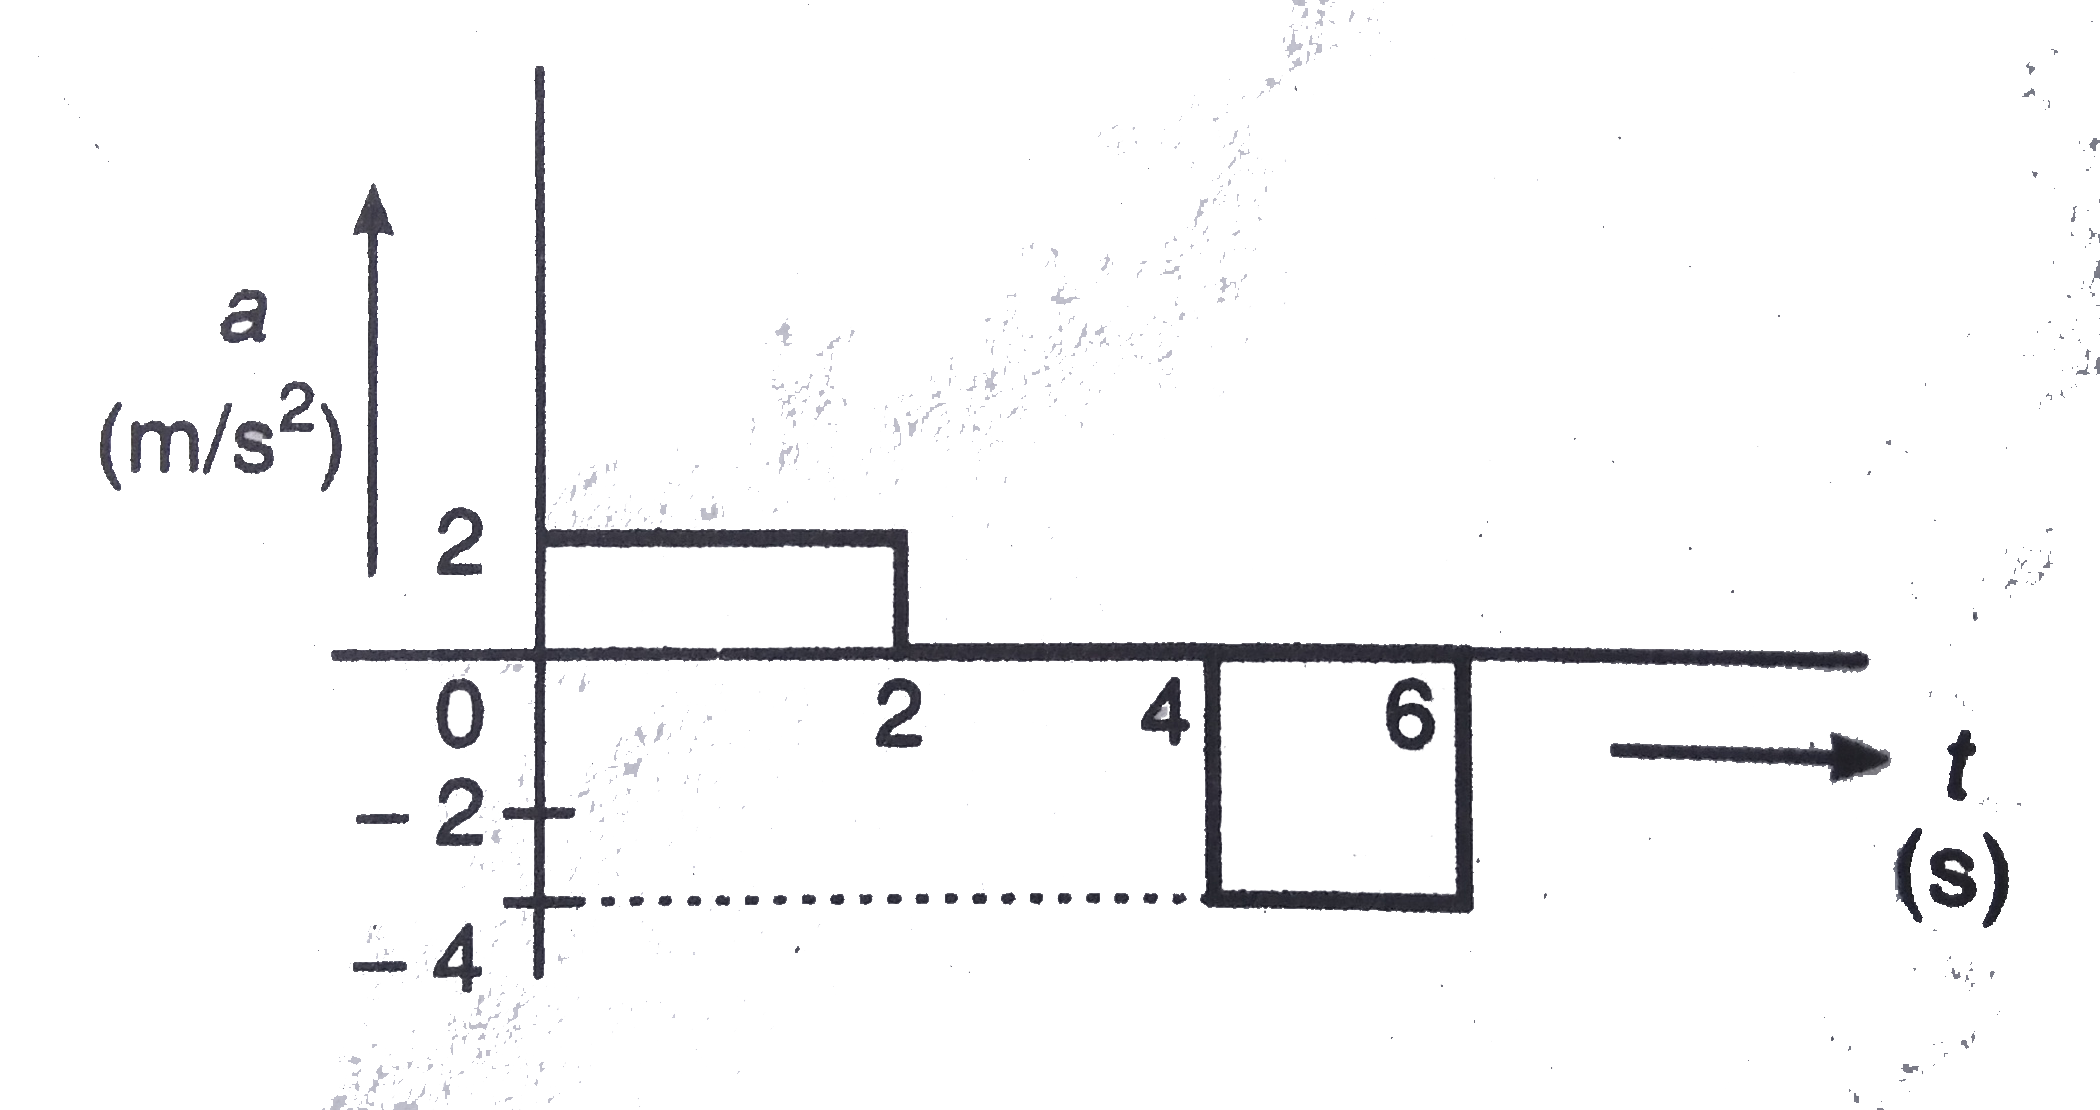 View Solution

