The median of a given frequency distribution is found with the help of
a)Histogram
b)Frequency curve
c)Frequency Polygon
d)OgiveSolution in Assamese
Histogram
Frequency curve
Frequency Polygon
Ogive
Step by step video & image solution for The median of a given frequency distribution is found with the help of a)Histogram b)Frequency curve c)Frequency Polygon d)Ogive by Maths experts to help you in doubts & scoring excellent marks in Class 10 exams.
Updated on:21/07/2023Topper's Solved these Questions
- STATISTICSBook:R G PUBLICATIONChapter:STATISTICSExercise:EXERCISE
Explore 39 Videos
- SOME APPLICATION OF TRIGONOMETRYBook:R G PUBLICATIONChapter:SOME APPLICATION OF TRIGONOMETRYExercise:EXERCISE
Explore 49 Videos
- SURFACE AREA AND VOLUMESBook:R G PUBLICATIONChapter:SURFACE AREA AND VOLUMESExercise:EXERCISE
Explore 69 Videos
Similar Questions
What is the median of the data 15,8,10,6,12,11,4,7,3?
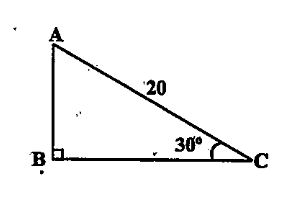
View SolutionA circus artist is climbing a 20 m long rope.which is tightly stretched and tied from the top of a vertical pole to the ground.Find the height of the pole,if the angle made by the rope with the ground level is 30∘(see Fig 9.11)

View Solution2 cubes each of volume 64cm3 are joined end to end.Find the surface area of the resulting cuboid.
View SolutionThe median of a given frequency distribution is found graphically with the help of (a) Histogram (b) Frequency curve (c) Frequency polygon (d) Ogive
View SolutionThe mode of a frequency distribution can be determined graphically from (a) Histogram (b) Frequency polygon (c) Ogive (d) Frequency curve
View SolutionFrom the following data, construct frequency histogram, frequency polygon and frequency curve.
View SolutionDraw histogram and frequency polygon for the following distribution :

View SolutionDraw a histogram, a frequency polygon and frequency curve of the following data :
View SolutionThe frequency distribution of marks obtained by students in a class test is given below . Draw frequency polygon and ogive.
View SolutionThe median of a frequency distribution is found graphically with the help of
View SolutionThe median of a given frequency distribution is found graphically with the help of (a) Histogram (b) Frequency curve (c) Frequency polygon (d) Ogive
View SolutionThe mode of a frequency distribution can be determined graphically from (a) Histogram (b) Frequency polygon (c) Ogive (d) Frequency curve
View SolutionIn a frequency distribution, ogives are graphical representation of (a) Frequency (b) Relative frequency (c) Cumulative frequency (d) Raw data
View SolutionDerive the formula of median from ogive for a frequency distribution.
View SolutionConstruct a combined histogram and frequency polygon for the following frequency distribution :

View Solution
