The straight lines in the figure depict the variations in temperature ΔT as a function of the amount of heat supplied Q is different process involving the change of state of a monoatomic and a diatomic ideal gas . The initial states, (P,V,T) of the two gases are the same . Match the processes as described, with the straight lines in the graph as numbered.
_E01_155_Q01.png)
Column-IColumn-II(A)Isobaric process of monoatomic gas.(p)1(B)Isobaric process of diatomic gas(q)2(C)Isochoric process of monoatomic gas(r)Minimum at section B(D)Isochoric process of diatomic gas(s)x-axis (i.e.'Q' axis)
As Q=mCdt and dT=QnC
Therefore molar heat constant C is the determining factor for rate of change of temperature of a gas as heat is supplied to it. It is minimum for isochoric process of a monoatomic gas (CV=32R), resulting in greatest slope (dTQ) i.e.curve 1.
For isobaric process of monoatomic gas and isochoric process of diatomic gas, their heat capacities are same (52R) ,therefore both are represented by curve 2 .
For isobaric process of diatomic gas Cp=72R that is represented by curve 3.Q axis represent by curve isothermal process and ΔT axis represent adiabatic process.
Topper's Solved these Questions
- GEOMETRICAL OPTICSBOOK - ALLENCHAPTER - GEOMETRICAL OPTICSEXERCISE - ASSERTION-REASON
36 Videos
- GEOMETRICAL OPTICSBOOK - ALLENCHAPTER - GEOMETRICAL OPTICSEXERCISE - Comprehension Based Questions
66 Videos
- GEOMETRICAL OPTICSBOOK - ALLENCHAPTER - GEOMETRICAL OPTICSEXERCISE - EXERCISE -02
82 Videos
- CURRENT ELECTRICITYBOOK - ALLENCHAPTER - CURRENT ELECTRICITYEXERCISE - EX.II
66 Videos
- GRAVITATIONBOOK - ALLENCHAPTER - GRAVITATIONEXERCISE - EXERCISE 4
9 Videos
Similar Questions
Match the following
Column-IColumn-II(A)Isothermal process(p)Temperature changes(B)Isobaric process(q)Pressure changes(C)Isochoric process(r)Volume change(D)Cyclic process(s)Initial and final states are same
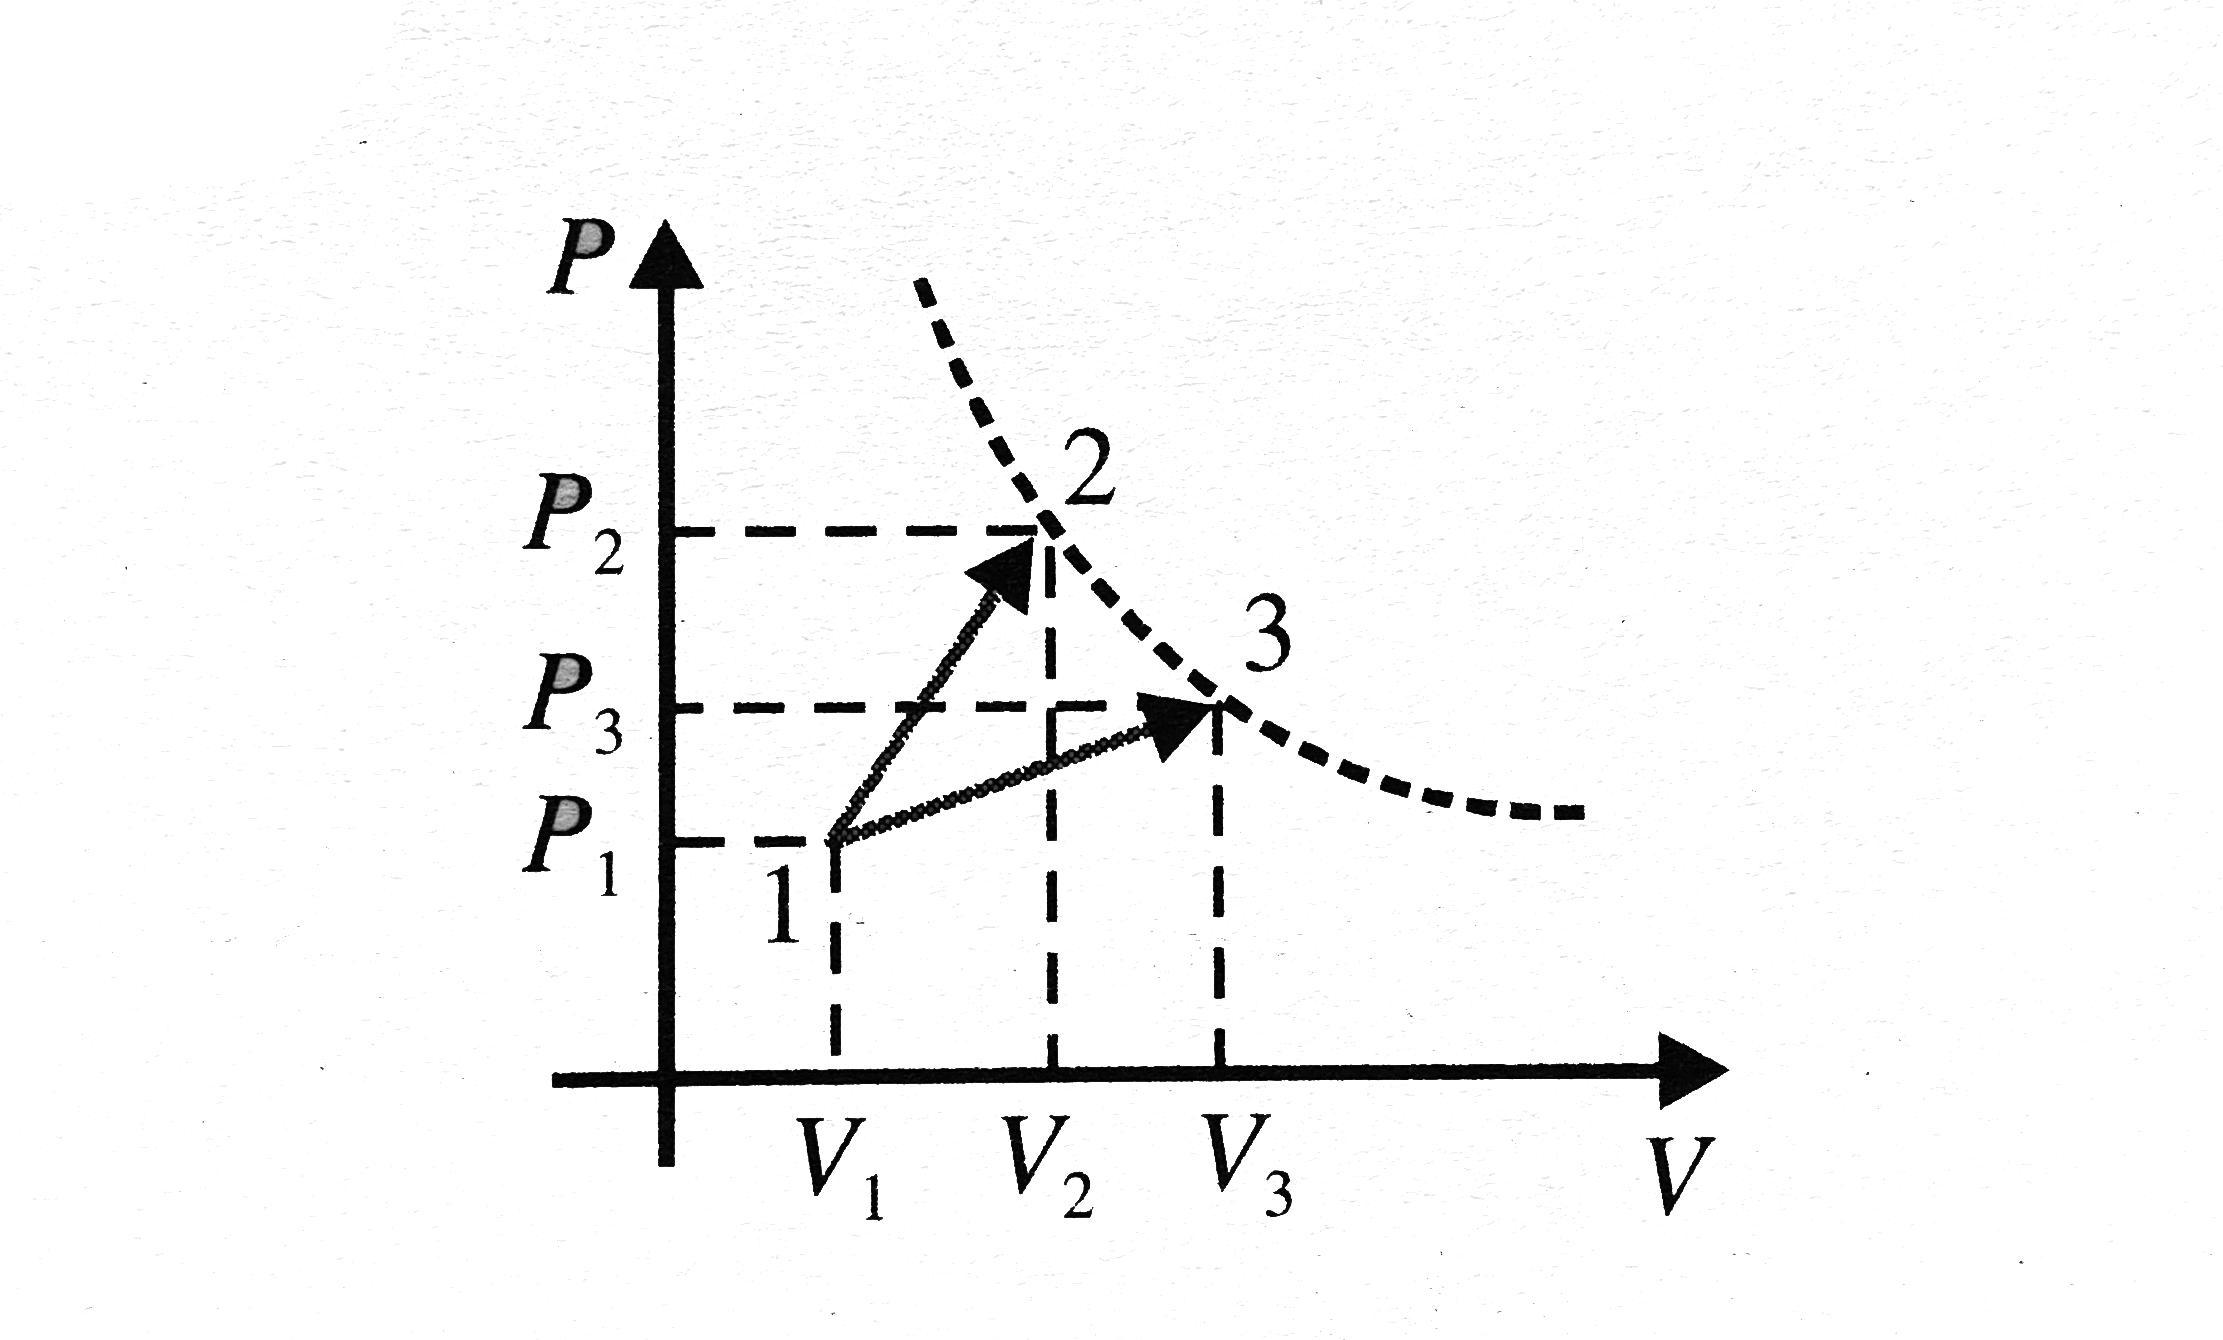
View SolutionA gas take part in two thermal processes in which it is heated from the same initial state to the same final temperature. The processes are shown on the P−V diagram by straight lines 1→3 and 1→2
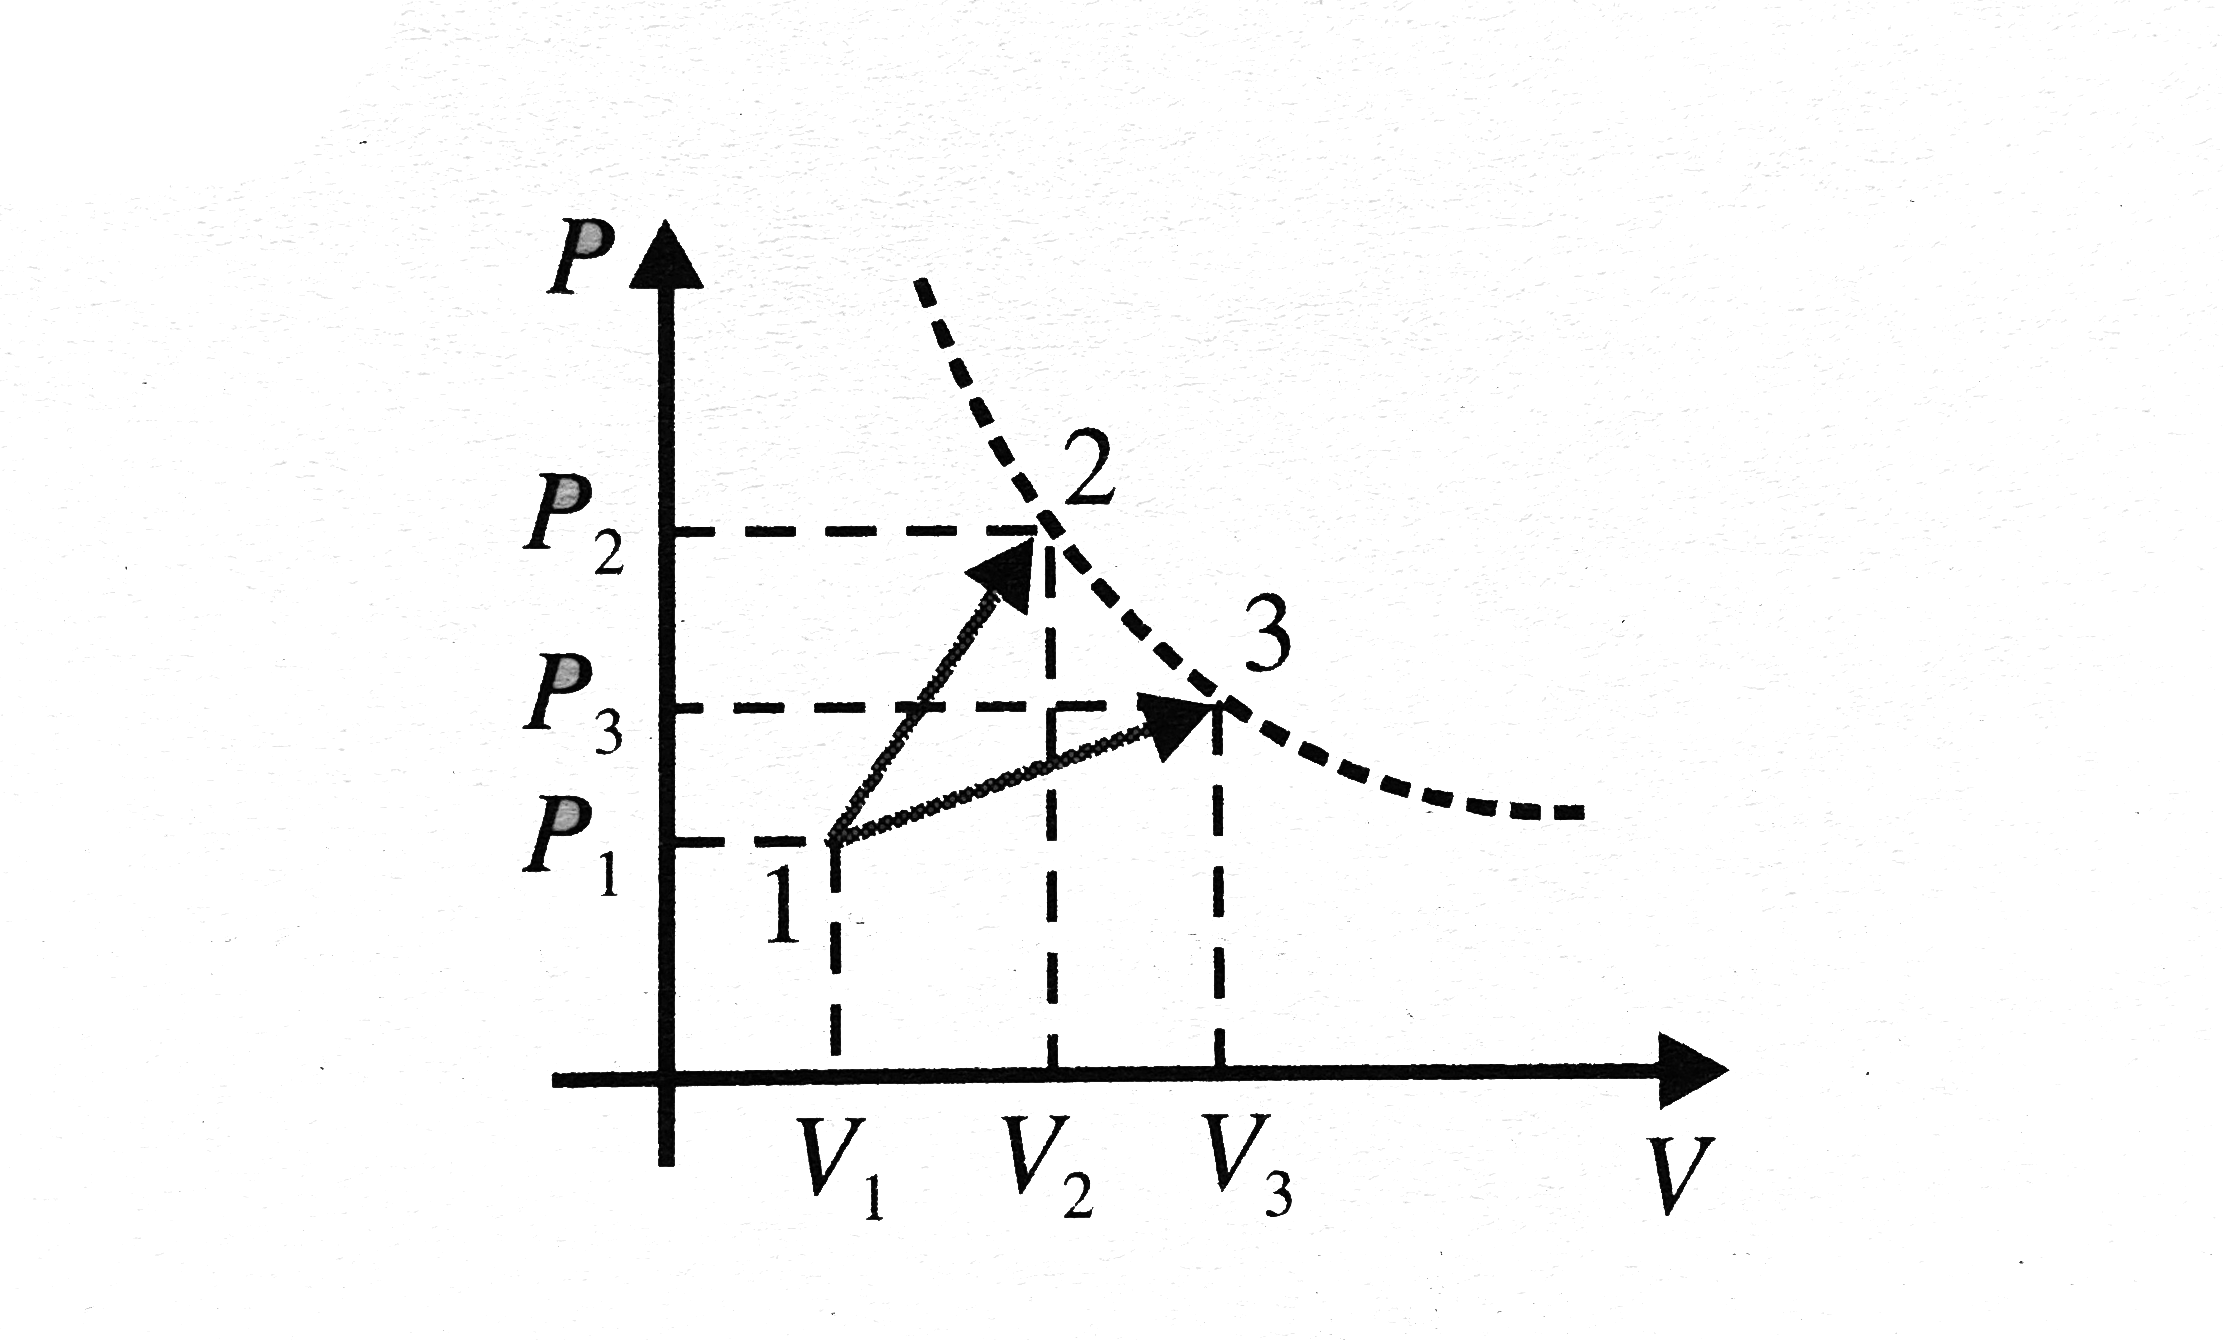
View SolutionA gas take part in two thermal processes in which it is heated from the same initial state to the same final temperature. The processes are shown on the P−V diagram by straight lines 1→3 and 1→2
View SolutionMatch the column :-
Column - IColumn - IIAAdiabatic processPq=0BIsothermal processQΔH=0CIsoenthalpic processRΔT=0DIsoentropic processSΔS=0
View SolutionThermodynamic processes are indicated in the following diagrams
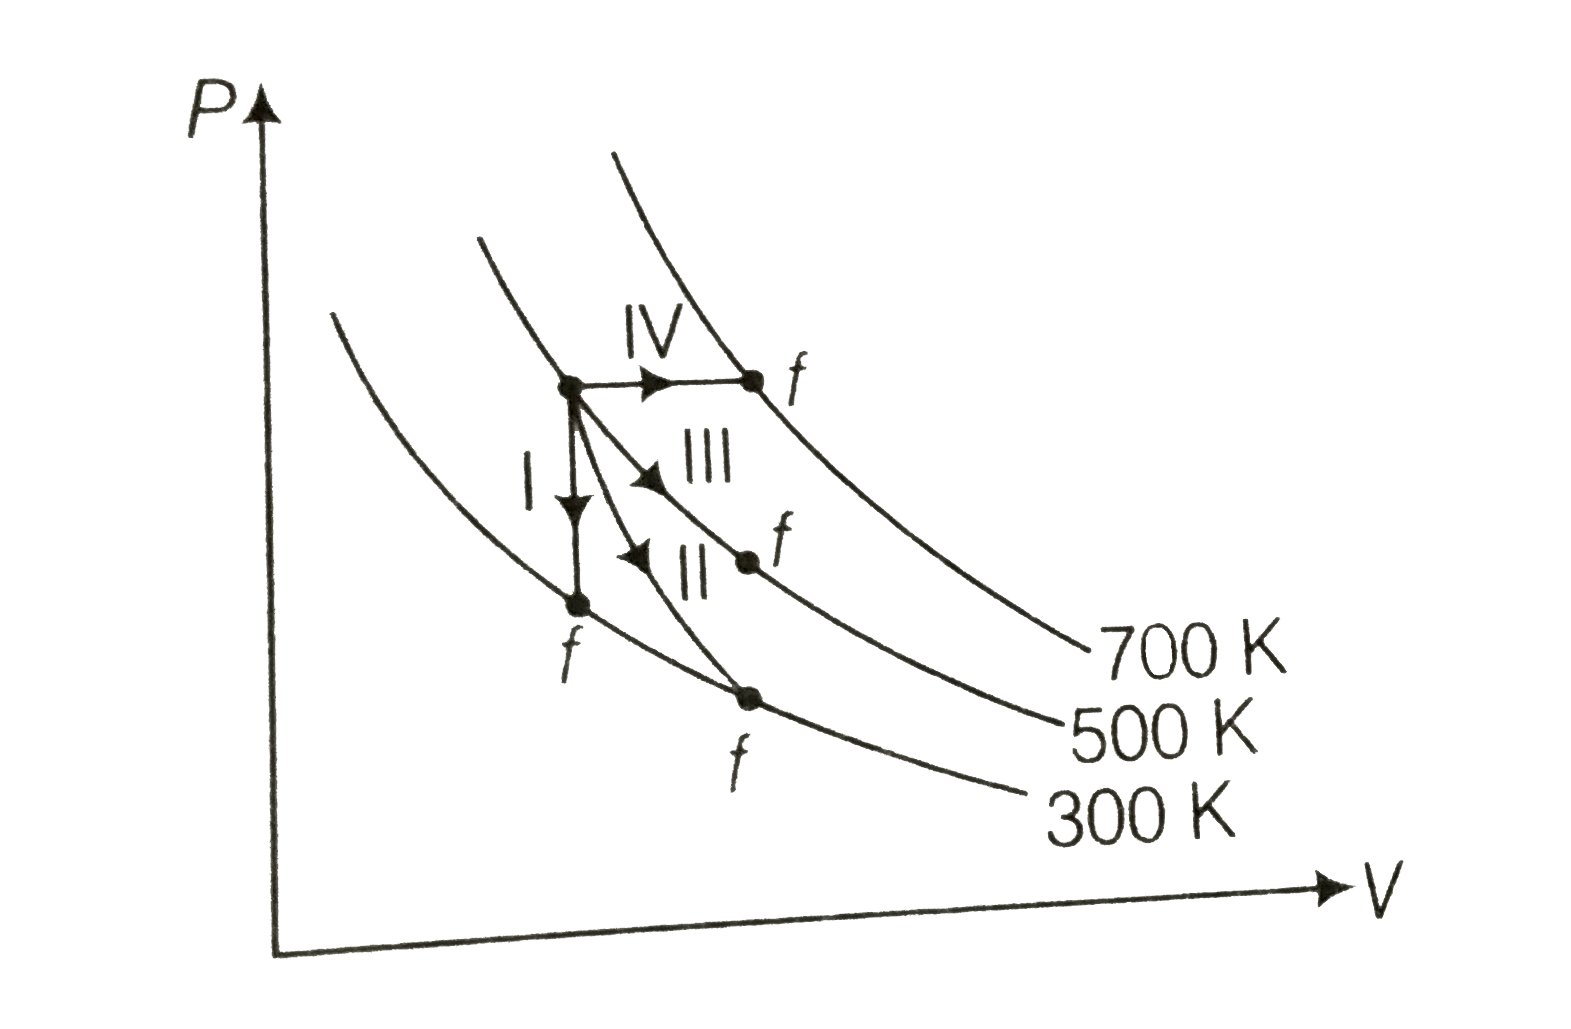
Match the following
Column - IColumn -IIPProcess IaAdiabaticQProcess IIbIsobaricRProcess IIIcIsochoricSProcess IVdIsothermal
View SolutionIf heat is supplied to an ideal gas in an isothermal process.
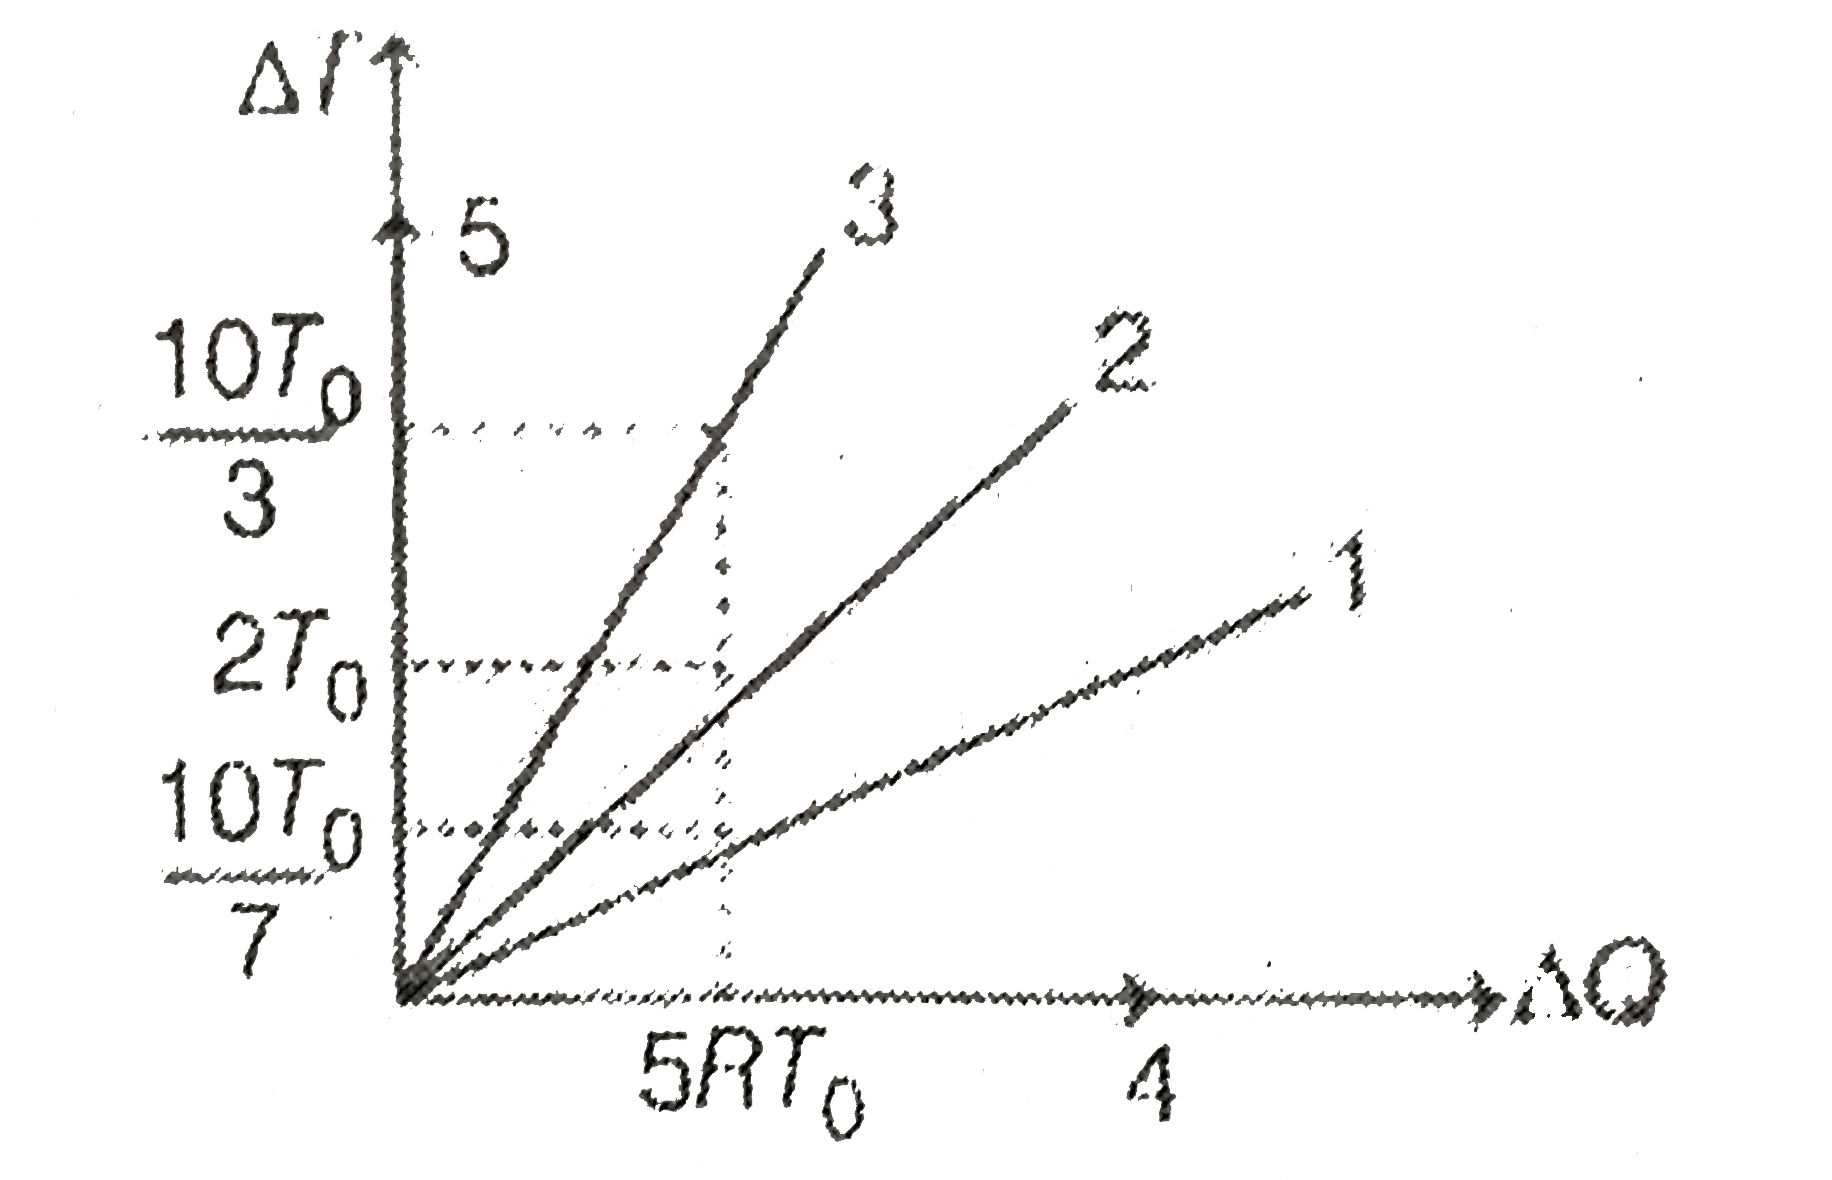
View SolutionFigure (Five straight line numbered 1, 2, 3, 4 and 5) shows graph of change in temperature ΔT verusus heat supplied ΔQ for different process performed on a gas of one mole.
View SolutionIn an isobaric process, heat is supplied to a monoatomic ideal gas. The fraction of heat that goes itno mechanical work is
View SolutionOne mole of a monoatomic ideal gas undergoes the process A→B in the given P-V diagram. What is the specific heat for this process?
View SolutionIn the process shown in the figure on an ideal diatomic gas, the value of q and ΔH respectively is
View Solution