Semilog of per minutes growing bacteria is plotted against time. What will be shape of graph?
Sigmoid
Hyperbola
Ascending straight line
Descending straight line
The correct Answer is:C
To determine the shape of the graph when the semilog of per minute growing bacteria is plotted against time, we can follow these steps:
1. Understanding the Variables:
- The x-axis represents time (in minutes).
- The y-axis represents the growth of bacteria per minute, which is plotted on a semilog scale.
2. Behavior of Bacterial Growth:
- Bacteria typically grow exponentially under ideal conditions. This means that the number of bacteria increases rapidly over time.
3. Plotting on a Semilog Scale:
- In a semilog graph, one axis (in this case, the y-axis) is on a logarithmic scale. This allows for better visualization of exponential growth.
- As bacteria multiply, their numbers will increase exponentially, meaning they will double over regular intervals of time.
4. Shape of the Graph:
- Since we are plotting the logarithm of the number of bacteria, the exponential growth will appear as a straight line on a semilog graph.
- Therefore, the graph will be an ascending straight line, indicating that as time increases, the growth of bacteria continues to increase in a linear fashion on the log scale.
5. Conclusion:
- The shape of the graph when semilog of per minute growing bacteria is plotted against time will be an ascending straight line.
Final Answer:
The shape of the graph will be an ascending straight line.
---
- The x-axis represents time (in minutes).
- The y-axis represents the growth of bacteria per minute, which is plotted on a semilog scale.
- Bacteria typically grow exponentially under ideal conditions. This means that the number of bacteria increases rapidly over time.
- In a semilog graph, one axis (in this case, the y-axis) is on a logarithmic scale. This allows for better visualization of exponential growth.
- As bacteria multiply, their numbers will increase exponentially, meaning they will double over regular intervals of time.
- Since we are plotting the logarithm of the number of bacteria, the exponential growth will appear as a straight line on a semilog graph.
- Therefore, the graph will be an ascending straight line, indicating that as time increases, the growth of bacteria continues to increase in a linear fashion on the log scale.
- The shape of the graph when semilog of per minute growing bacteria is plotted against time will be an ascending straight line.
The shape of the graph will be an ascending straight line.
Similar Questions
The growth curve of bacterial population is lab is plotted against time. What will be the shape of graph ?
View SolutionGrowth plotted against time gives a
View SolutionWhen pH or temperature is plotted against enzyme activity the shape of curve obtained is
View SolutionA hot liquid is kept in a big room. The logarithm of the numerical value of the temperature difference between the liquid and the room is plotted against time. the plot will be very nearly
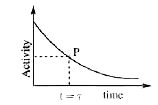
View SolutionThe activity of a certain radioactive sample is plotted against time in graph. If the initial slope of the curve is m, then find the slope of the curve at point P ?
 View Solution
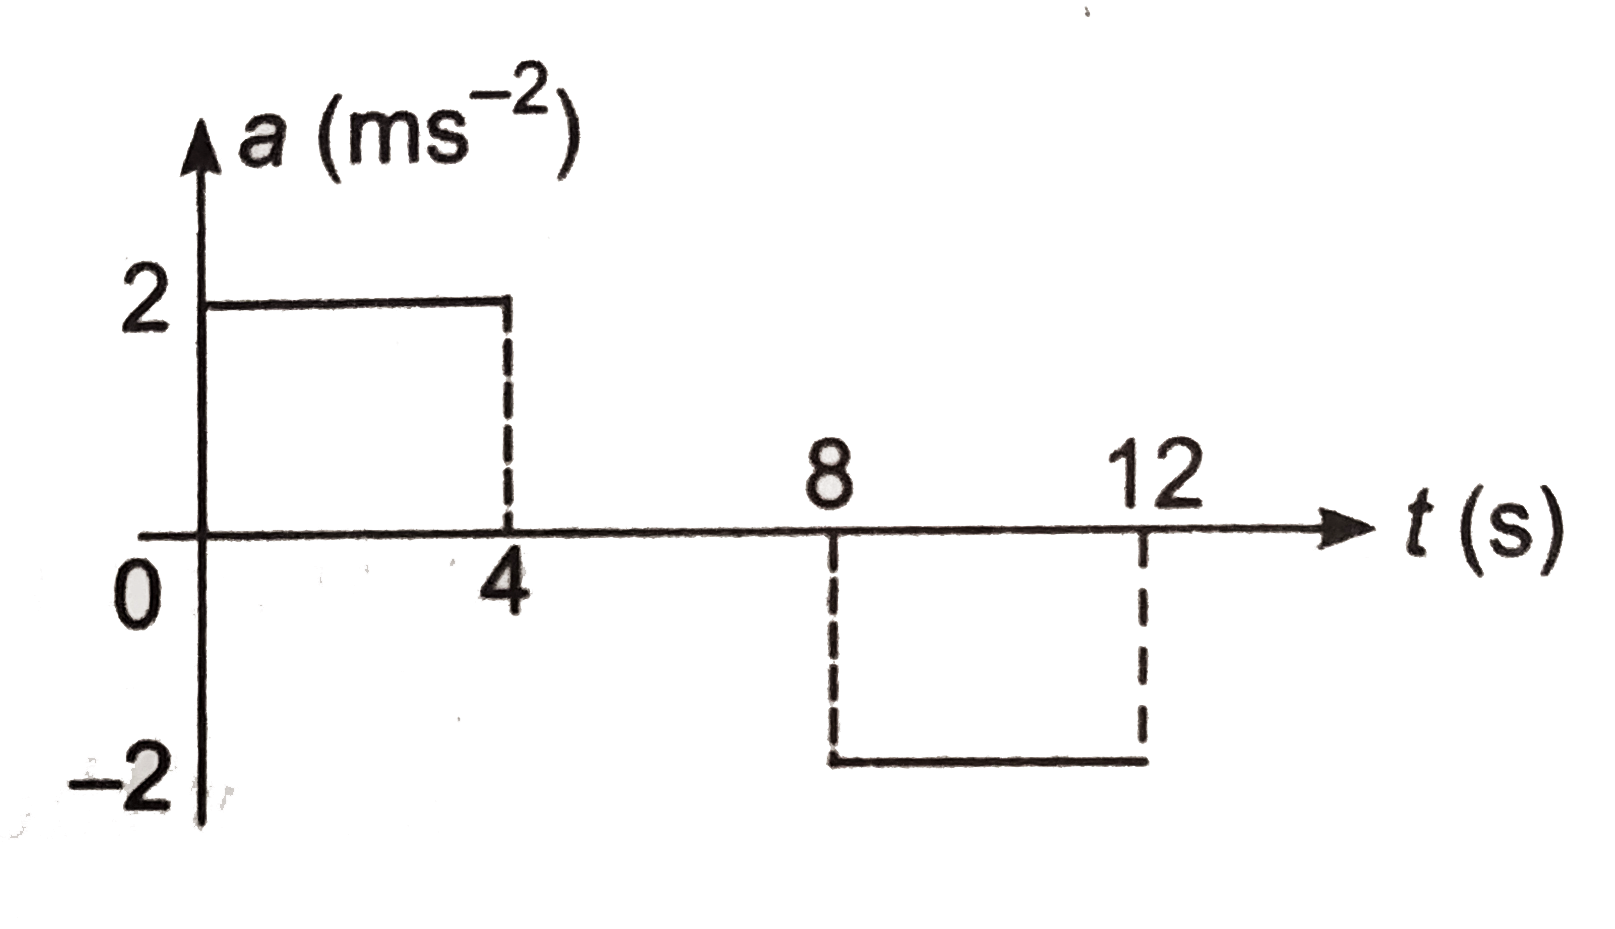
A lift starts from rest. Its acceleration is plotted against time. When it comes to rest its height above its starting point is
 View Solution
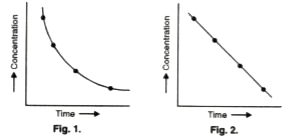
In the reaction A→ B , if the concentration of A is plotted against time, the curves obtained will be as shown in Fig. 1 and 2. Predict the order of the reactions.
 View Solution
In the reaction A→ B , if the concentration of A is plotted against time, the curves obtained will be as shown in Fig. 1 and 2. Predict the order of the reactions.
 View Solution
In the reaction A→ B , if the concentration of A is plotted against time, the curves obtained will be as shown in Fig. 1 and 2. Predict the order of the reactions.
 View Solution
The mass of argon adsorbed per unit mass of carbon surface is plotted against pressure. Which of the following plots is correct if x and m represent the masses of argon and carbon respectively ? (………. Represents extrapolated data)
View Solution

