The growth curve of bacterial population is lab is plotted against time. What will be the shape of graph ?
sigmoid
hyperbolic
ascending straight line
desending straight line
The correct Answer is:B
To solve the question regarding the shape of the growth curve of a bacterial population plotted against time, let’s break it down step by step:
Step 1: Understand Bacterial Growth Phases
Bacterial growth in a lab setting typically follows a specific pattern characterized by several phases:
- Lag Phase: This is the initial phase where bacteria adapt to the new environment. There is little to no cell division during this phase.
- Log Phase (Exponential Phase): In this phase, bacteria begin to divide at a constant and rapid rate, leading to exponential growth.
- Stationary Phase: Growth slows as the nutrients become limited and waste products accumulate. The number of new cells created is roughly equal to the number of cells dying.
- Decline Phase (Death Phase): Nutrient depletion and toxic accumulation lead to a decrease in the bacterial population.
Step 2: Identify the Shape of the Growth Curve
When plotted against time, the growth curve of bacterial populations in a lab setting typically exhibits a J-shaped curve during the log phase, which is hyperbolic in nature. This indicates rapid growth during the exponential phase.
Step 3: Conclusion
Thus, the overall shape of the growth curve of a bacterial population in a lab, when plotted against time, is hyperbolic due to the exponential growth observed during the log phase.
Final Answer:
The shape of the graph representing the growth curve of bacterial population in the lab is hyperbolic.
---
Bacterial growth in a lab setting typically follows a specific pattern characterized by several phases:
- Lag Phase: This is the initial phase where bacteria adapt to the new environment. There is little to no cell division during this phase.
- Log Phase (Exponential Phase): In this phase, bacteria begin to divide at a constant and rapid rate, leading to exponential growth.
- Stationary Phase: Growth slows as the nutrients become limited and waste products accumulate. The number of new cells created is roughly equal to the number of cells dying.
- Decline Phase (Death Phase): Nutrient depletion and toxic accumulation lead to a decrease in the bacterial population.
When plotted against time, the growth curve of bacterial populations in a lab setting typically exhibits a J-shaped curve during the log phase, which is hyperbolic in nature. This indicates rapid growth during the exponential phase.
Thus, the overall shape of the growth curve of a bacterial population in a lab, when plotted against time, is hyperbolic due to the exponential growth observed during the log phase.
The shape of the graph representing the growth curve of bacterial population in the lab is hyperbolic.
Similar Questions
Knowledge Check
The formula of growth rate for population in a given time is
Adt/dN= rNBdt/rN = dNCrn/dN=dtDdN/dt=rN
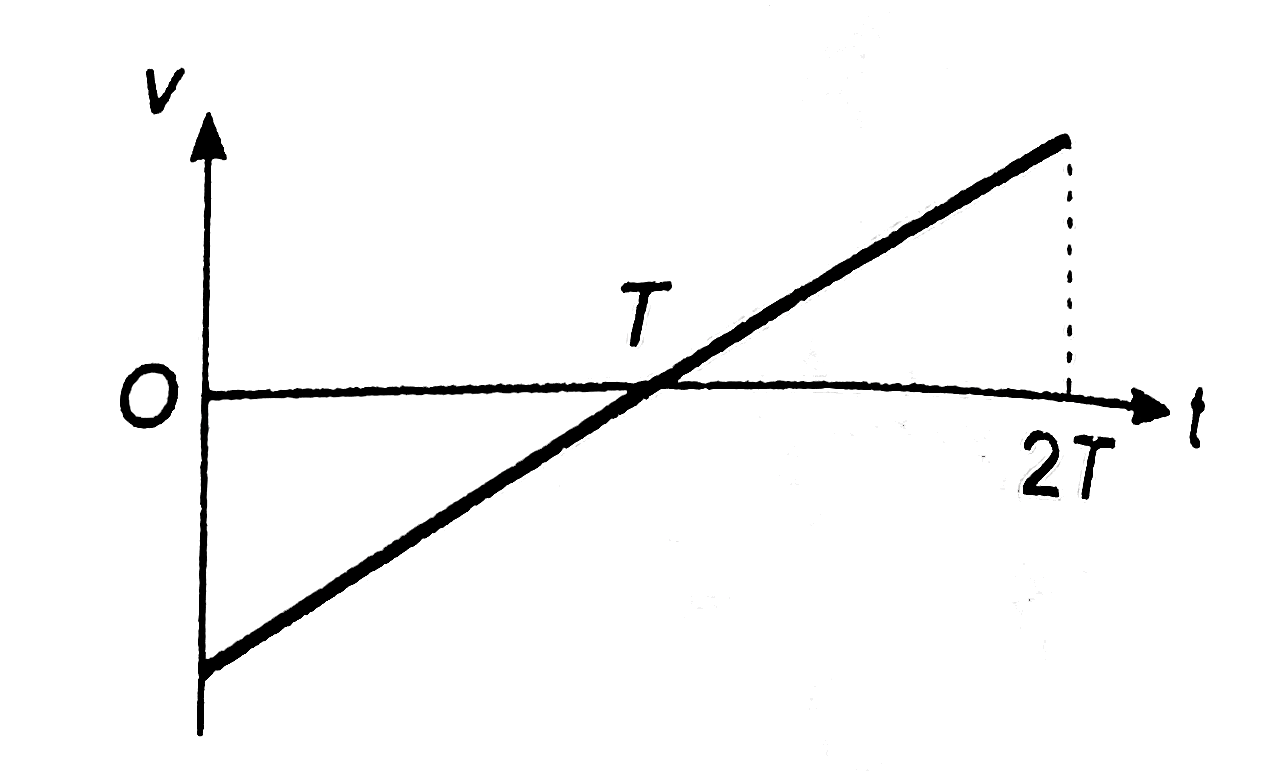
The figure shows the velocity (v) of a particle plotted against time (t).

View SolutionThe figure shows the velocity (v) of a particle plotted against time (t).

View SolutionThe Shape of growth curve obtained when the length of an organ is plotted against the time is
View SolutionThe J-shaped growth curve lacks
View SolutionWhen pH or temperature is plotted against enzyme activity the shape of curve obtained is
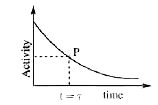
View SolutionThe activity of a certain radioactive sample is plotted against time in graph. If the initial slope of the curve is m, then find the slope of the curve at point P ?

View SolutionIn a population showing sigmoid growth form, the population has reached its carrying capacity. What will be the value of d N/dt in this population.
View Solution
