Which of the following could be the sketch graph of y=d(xlnx)dx
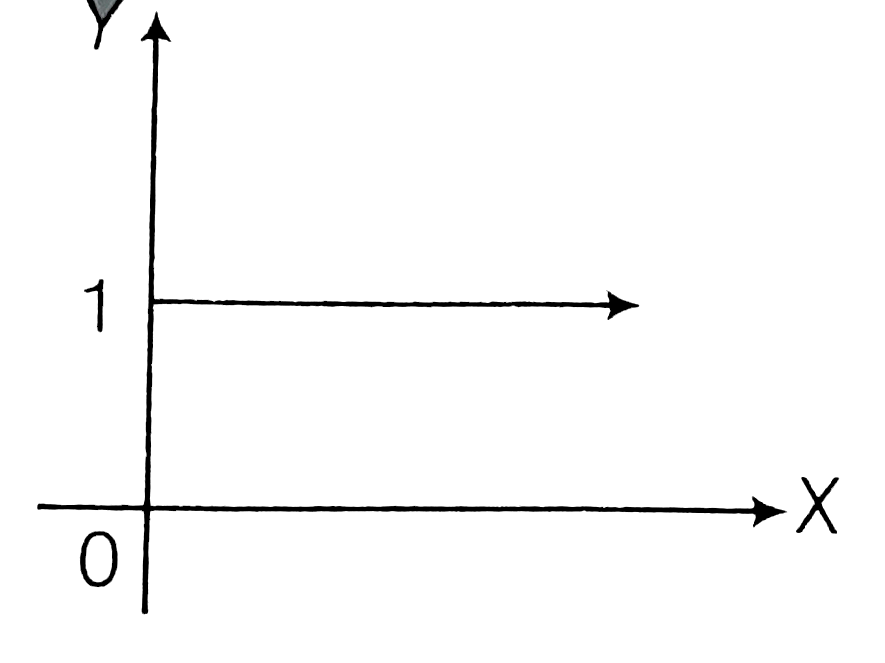
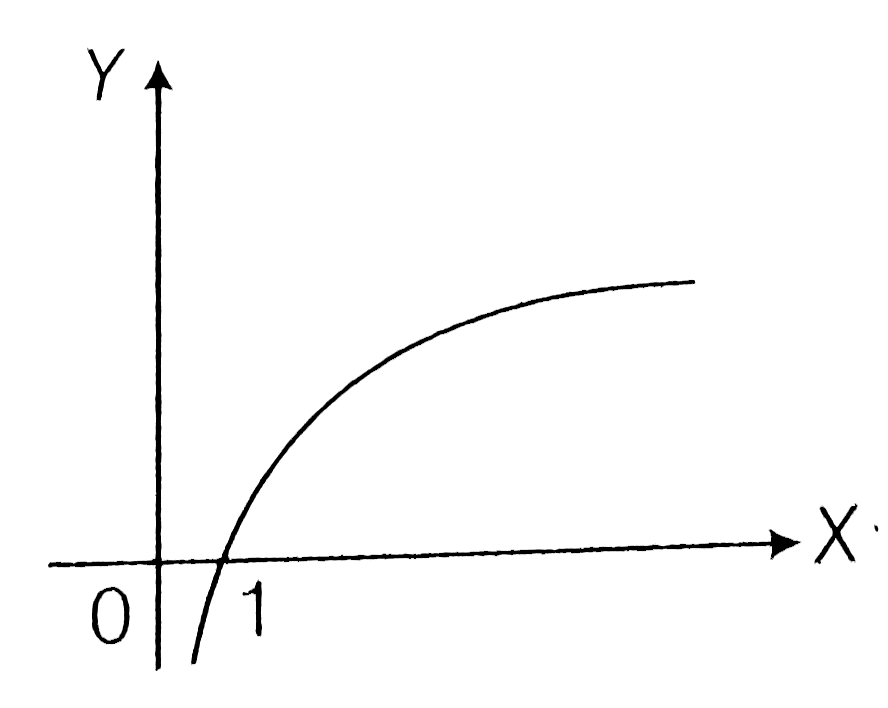
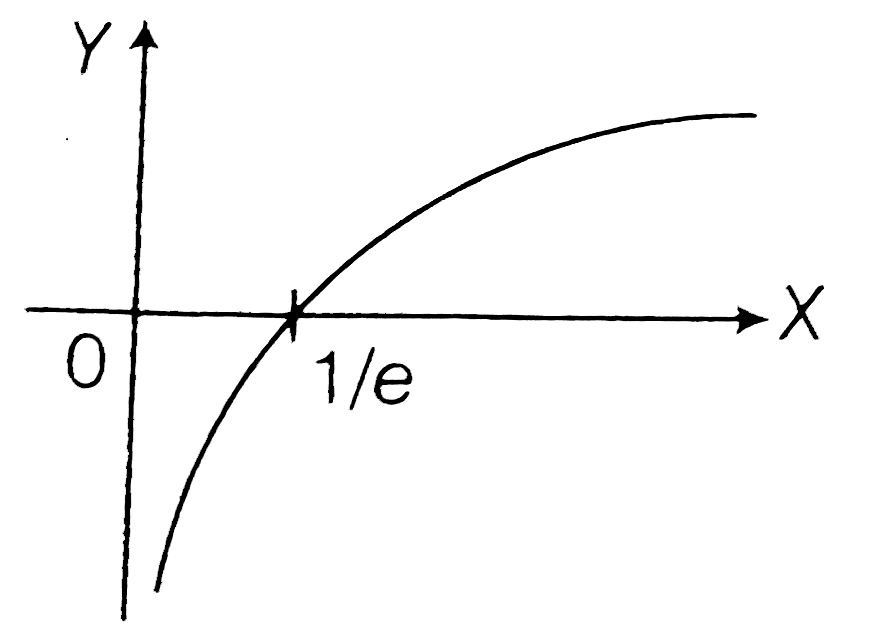
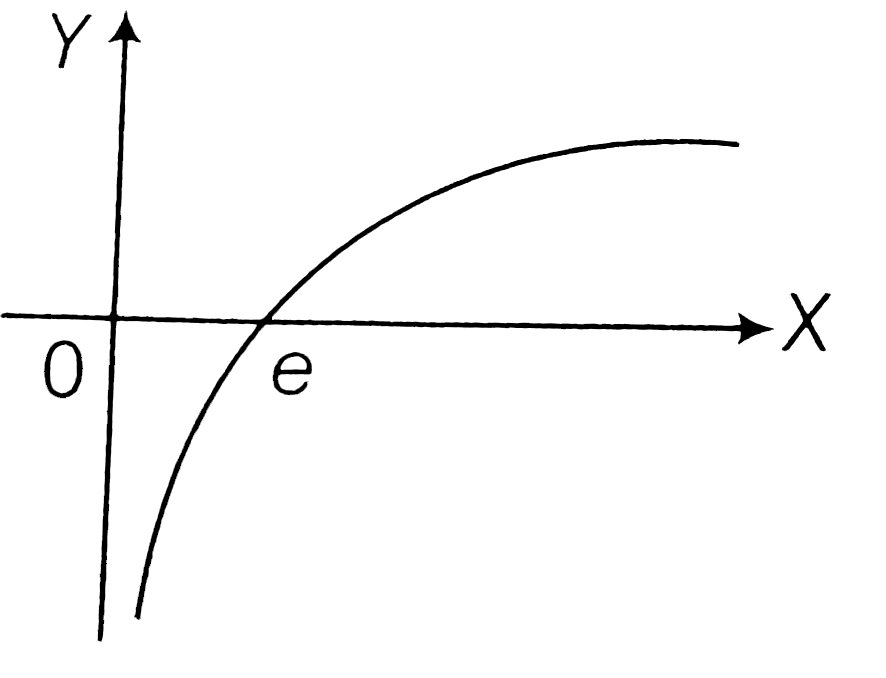
The correct Answer is:C
To solve the problem of finding the sketch graph of y=ddx(xlnx), we will follow these steps:
Step 1: Differentiate the function
We start with the function y=xlnx. To find dydx, we will use the product rule of differentiation.
The product rule states that if you have two functions u and v, then:
ddx(uv)=udvdx+vdudx
Here, let:
- u=x (which implies dudx=1)
- v=lnx (which implies dvdx=1x)
Applying the product rule:
dydx=x⋅1x+lnx⋅1
This simplifies to:
dydx=1+lnx
Step 2: Analyze the derivative
Now we have y=1+lnx. We need to analyze this function to understand its behavior.
1. Domain: The function lnx is defined for x>0.
2. Intercept: To find where y=0:
1+lnx=0⟹lnx=−1⟹x=e−1=1e
This means the graph intersects the x-axis at x=1e.
Step 3: Behavior of the function
- As x→0+, lnx→−∞ and hence y→−∞.
- At x=1, ln1=0 so y=1.
- As x→∞, lnx→∞ and hence y→∞.
Step 4: Sketch the graph
From the analysis:
- The graph starts from −∞ as x approaches 0.
- It crosses the x-axis at x=1e.
- It passes through the point (1,1).
- The graph approaches ∞ as x increases.
Thus, the sketch of the graph of y=1+lnx will look like this:
1. It will start from the bottom left (negative infinity).
2. It will cross the x-axis at x=1e.
3. It will rise and pass through the point (1,1).
4. It will continue to rise towards infinity as x increases.
Final Answer
The sketch graph of y=ddx(xlnx)=1+lnx is a curve that starts from −∞, crosses the x-axis at x=1e, passes through (1,1), and rises towards +∞.
We start with the function y=xlnx. To find dydx, we will use the product rule of differentiation.
ddx(uv)=udvdx+vdudx
- u=x (which implies dudx=1)
- v=lnx (which implies dvdx=1x)
dydx=x⋅1x+lnx⋅1
This simplifies to:
dydx=1+lnx
Now we have y=1+lnx. We need to analyze this function to understand its behavior.
2. Intercept: To find where y=0:
1+lnx=0⟹lnx=−1⟹x=e−1=1e
This means the graph intersects the x-axis at x=1e.
- As x→0+, lnx→−∞ and hence y→−∞.
- At x=1, ln1=0 so y=1.
- As x→∞, lnx→∞ and hence y→∞.
From the analysis:
- The graph starts from −∞ as x approaches 0.
- It crosses the x-axis at x=1e.
- It passes through the point (1,1).
- The graph approaches ∞ as x increases.
2. It will cross the x-axis at x=1e.
3. It will rise and pass through the point (1,1).
4. It will continue to rise towards infinity as x increases.
The sketch graph of y=ddx(xlnx)=1+lnx is a curve that starts from −∞, crosses the x-axis at x=1e, passes through (1,1), and rises towards +∞.
Topper's Solved these Questions
- DIFFERENTIATION BOOK - ARIHANT MATHS ENGLISHCHAPTER - DIFFERENTIATION EXERCISE - Exercise (Statement I And Ii Type Questions)
10 Videos
- DIFFERENTIATION BOOK - ARIHANT MATHS ENGLISHCHAPTER - DIFFERENTIATION EXERCISE - Exercise (Passage Based Questions)
16 Videos
- DIFFERENTIATION BOOK - ARIHANT MATHS ENGLISHCHAPTER - DIFFERENTIATION EXERCISE - SOLVED EXAMPLES
7 Videos
- DIFFERENTIAL EQUATION BOOK - ARIHANT MATHS ENGLISHCHAPTER - DIFFERENTIAL EQUATION EXERCISE - Exercise (Questions Asked In Previous 13 Years Exam)
26 Videos
- DY / DX AS A RATE MEASURER AND TANGENTS, NORMALS BOOK - ARIHANT MATHS ENGLISHCHAPTER - DY / DX AS A RATE MEASURER AND TANGENTS, NORMALS EXERCISE - Exercise (Questions Asked In Previous 13 Years Exam)
7 Videos
Similar Questions
Knowledge Check
Which of the following could be the graph of 2x+3y+12=0 ?
A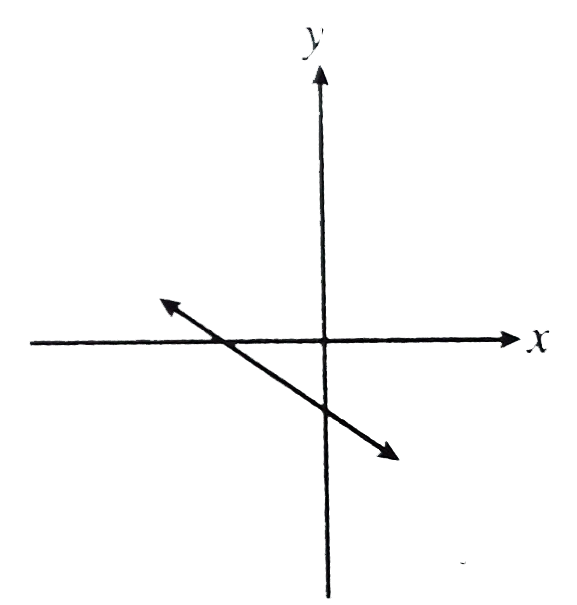 B
B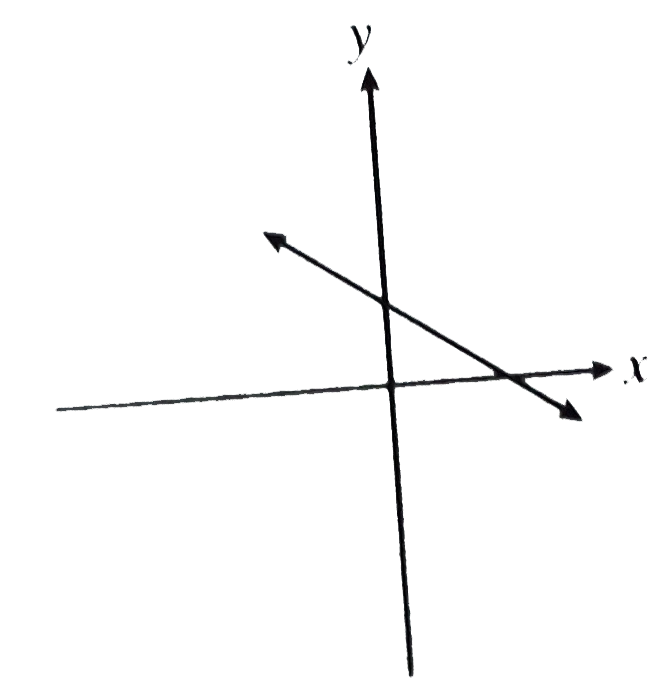 C
C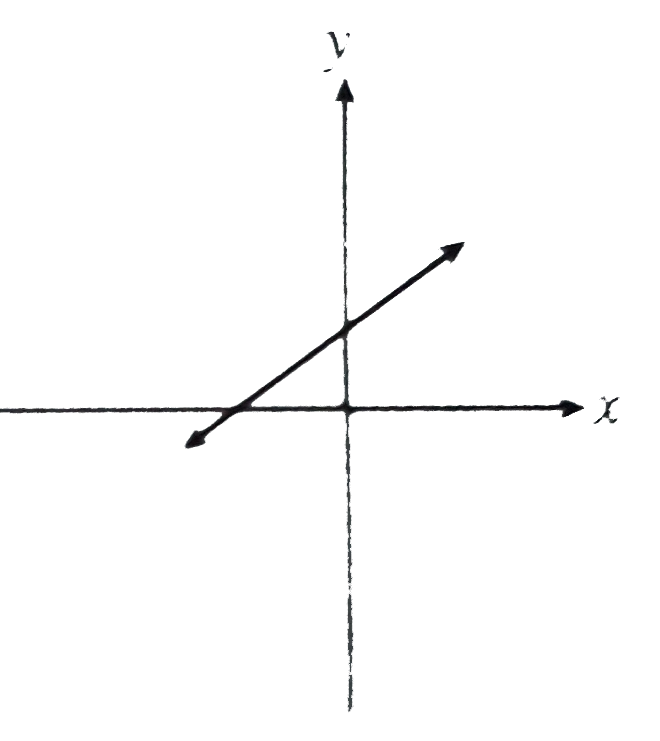 D
D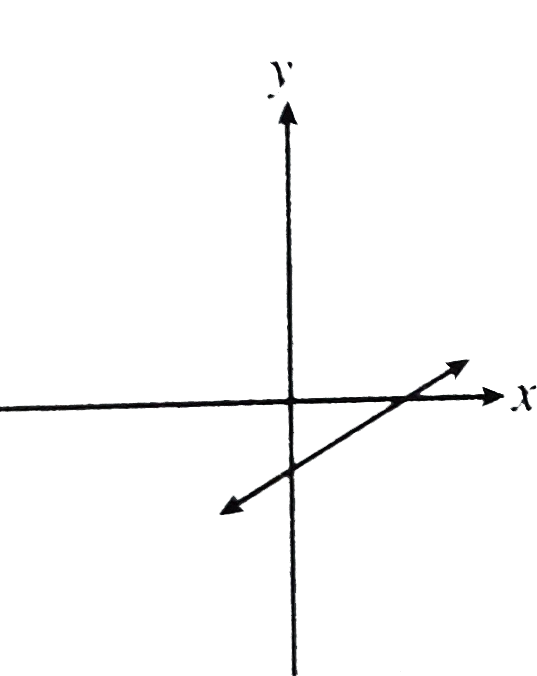
Which of the following could be the graph of 2x+3y+12=0 ?
A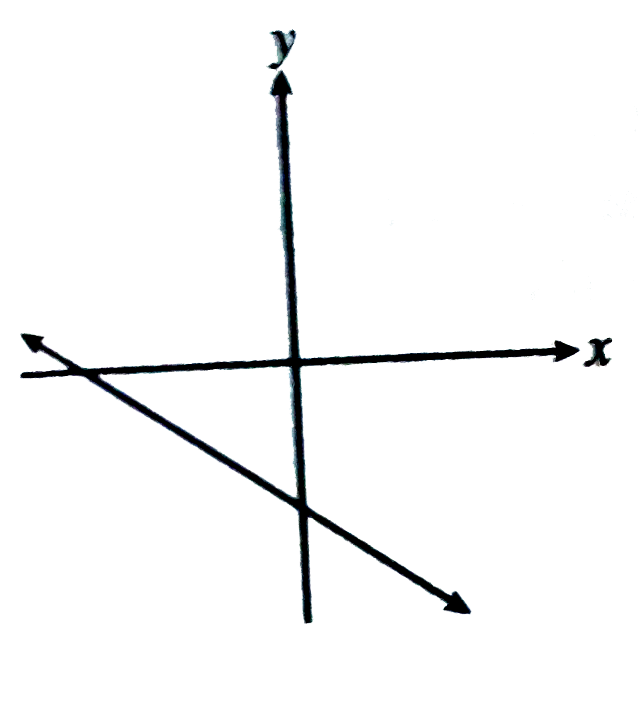 B
B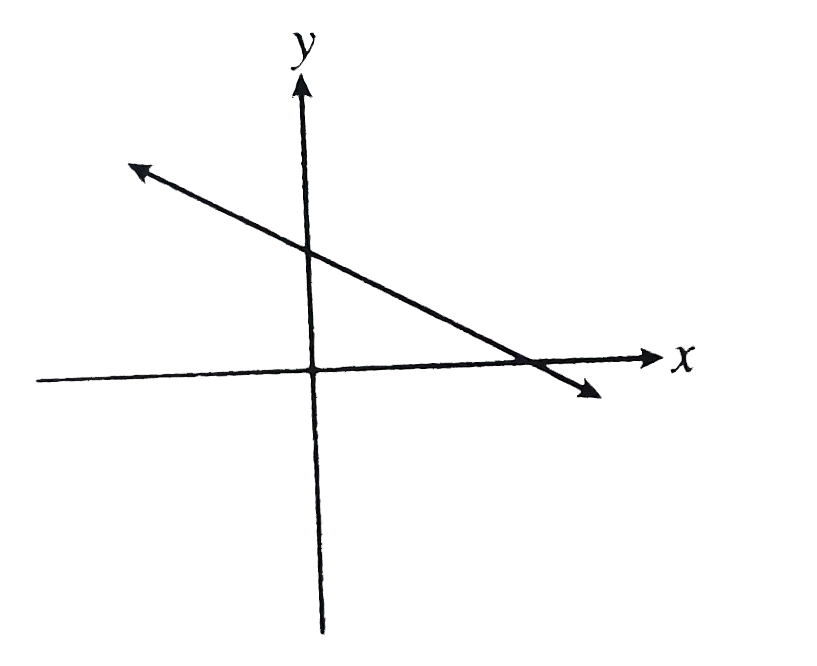 C
C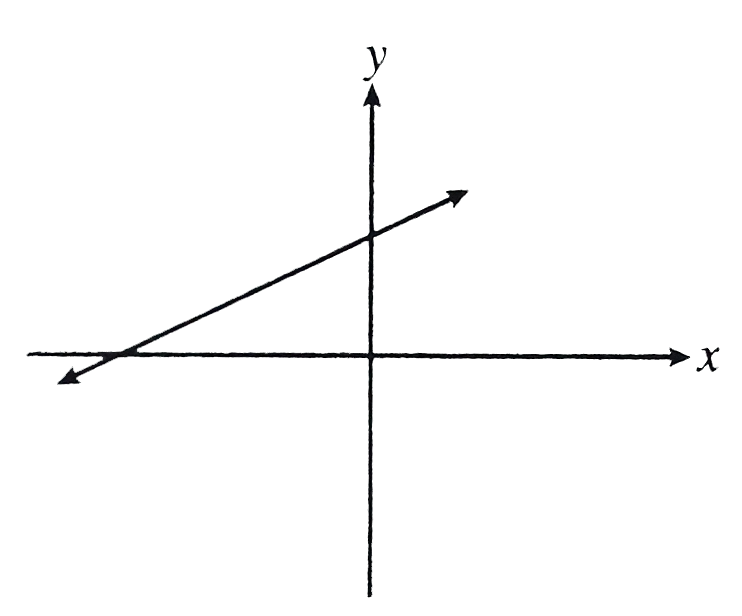 D
D
Which of the following could be the graph of y=3−2x ?
A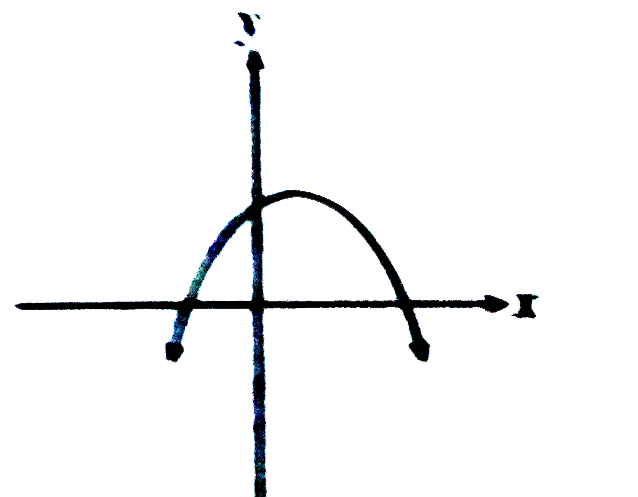 B
B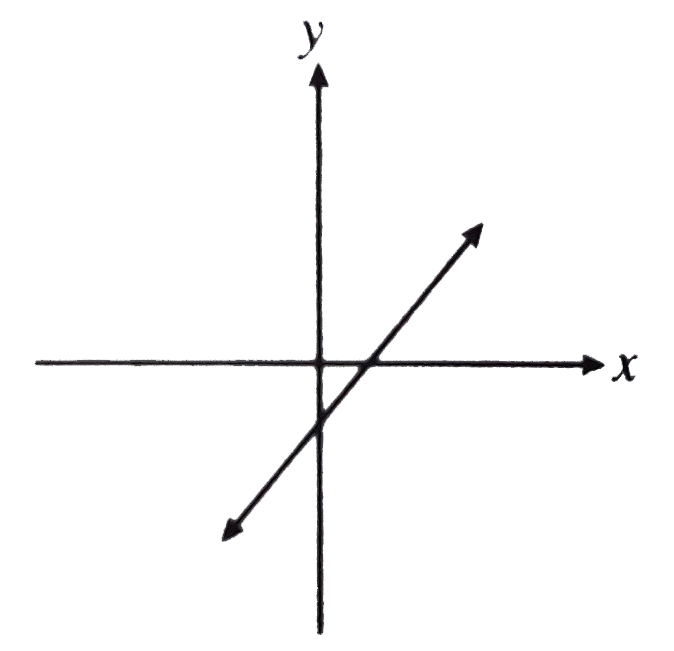 C
C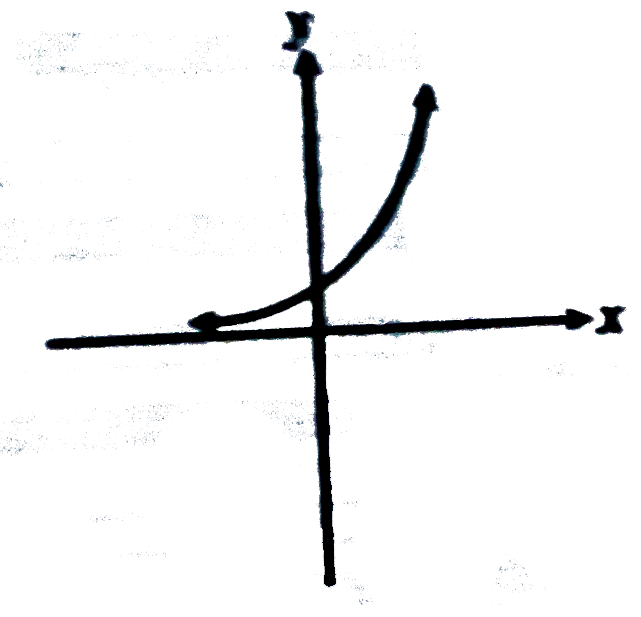 D
D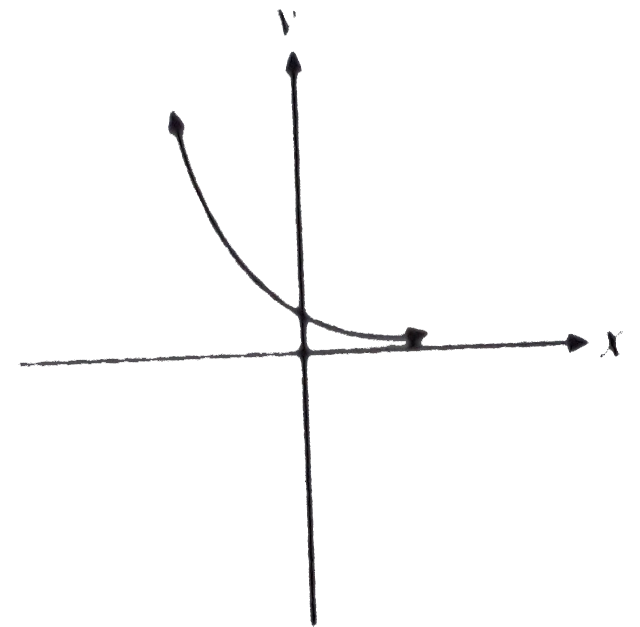
If k is a positive constant such that 0<k<1, which of the following could be the graph of y−x=k(x+y) ?
View Solution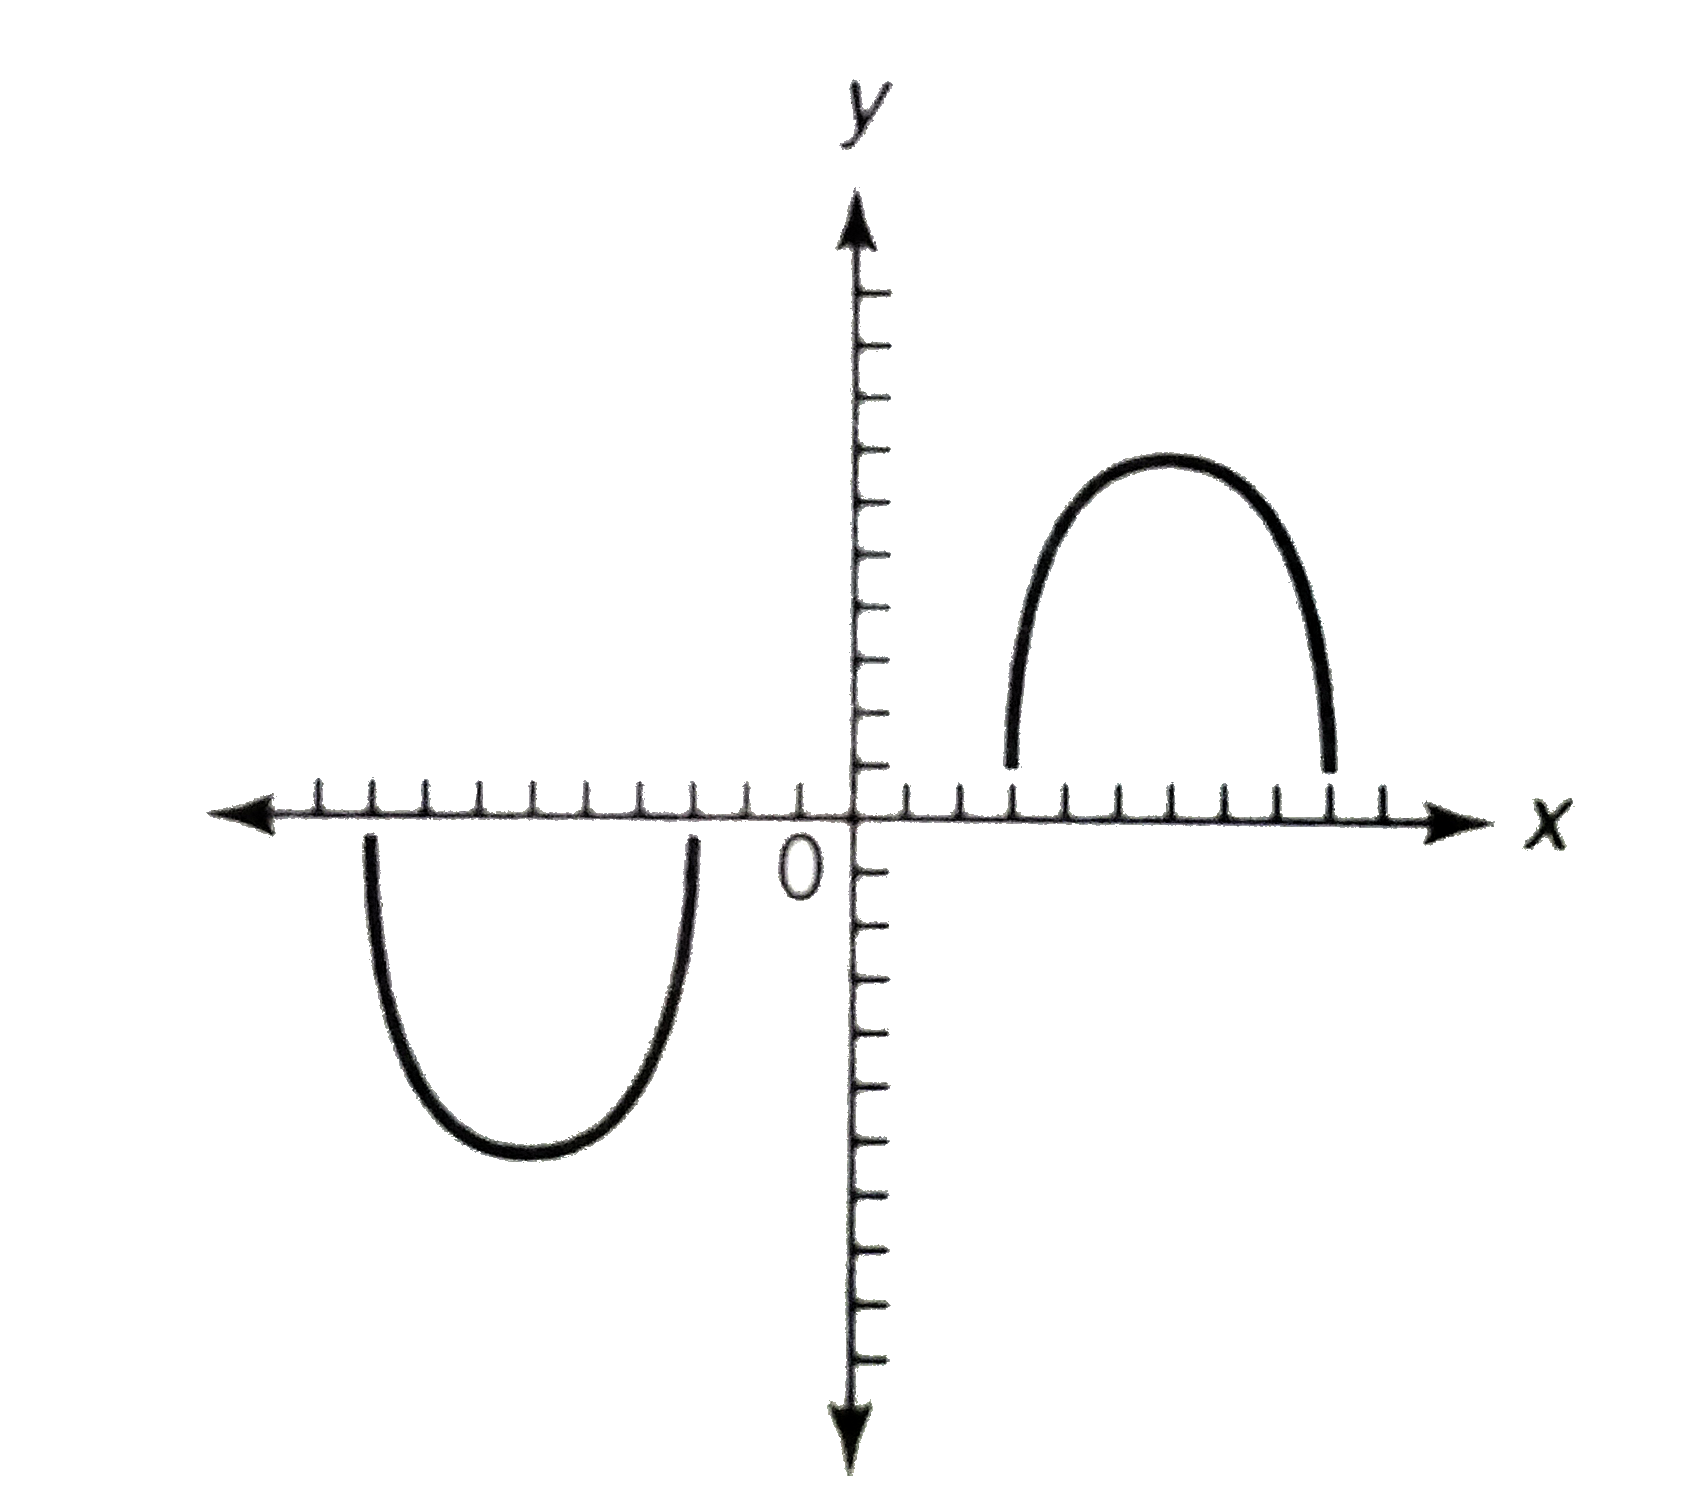
The graph of the function f is shown above. Which of the following could represent the graph of y=|f(x)|?
View SolutionThe graph of y=f(x) is shown below.
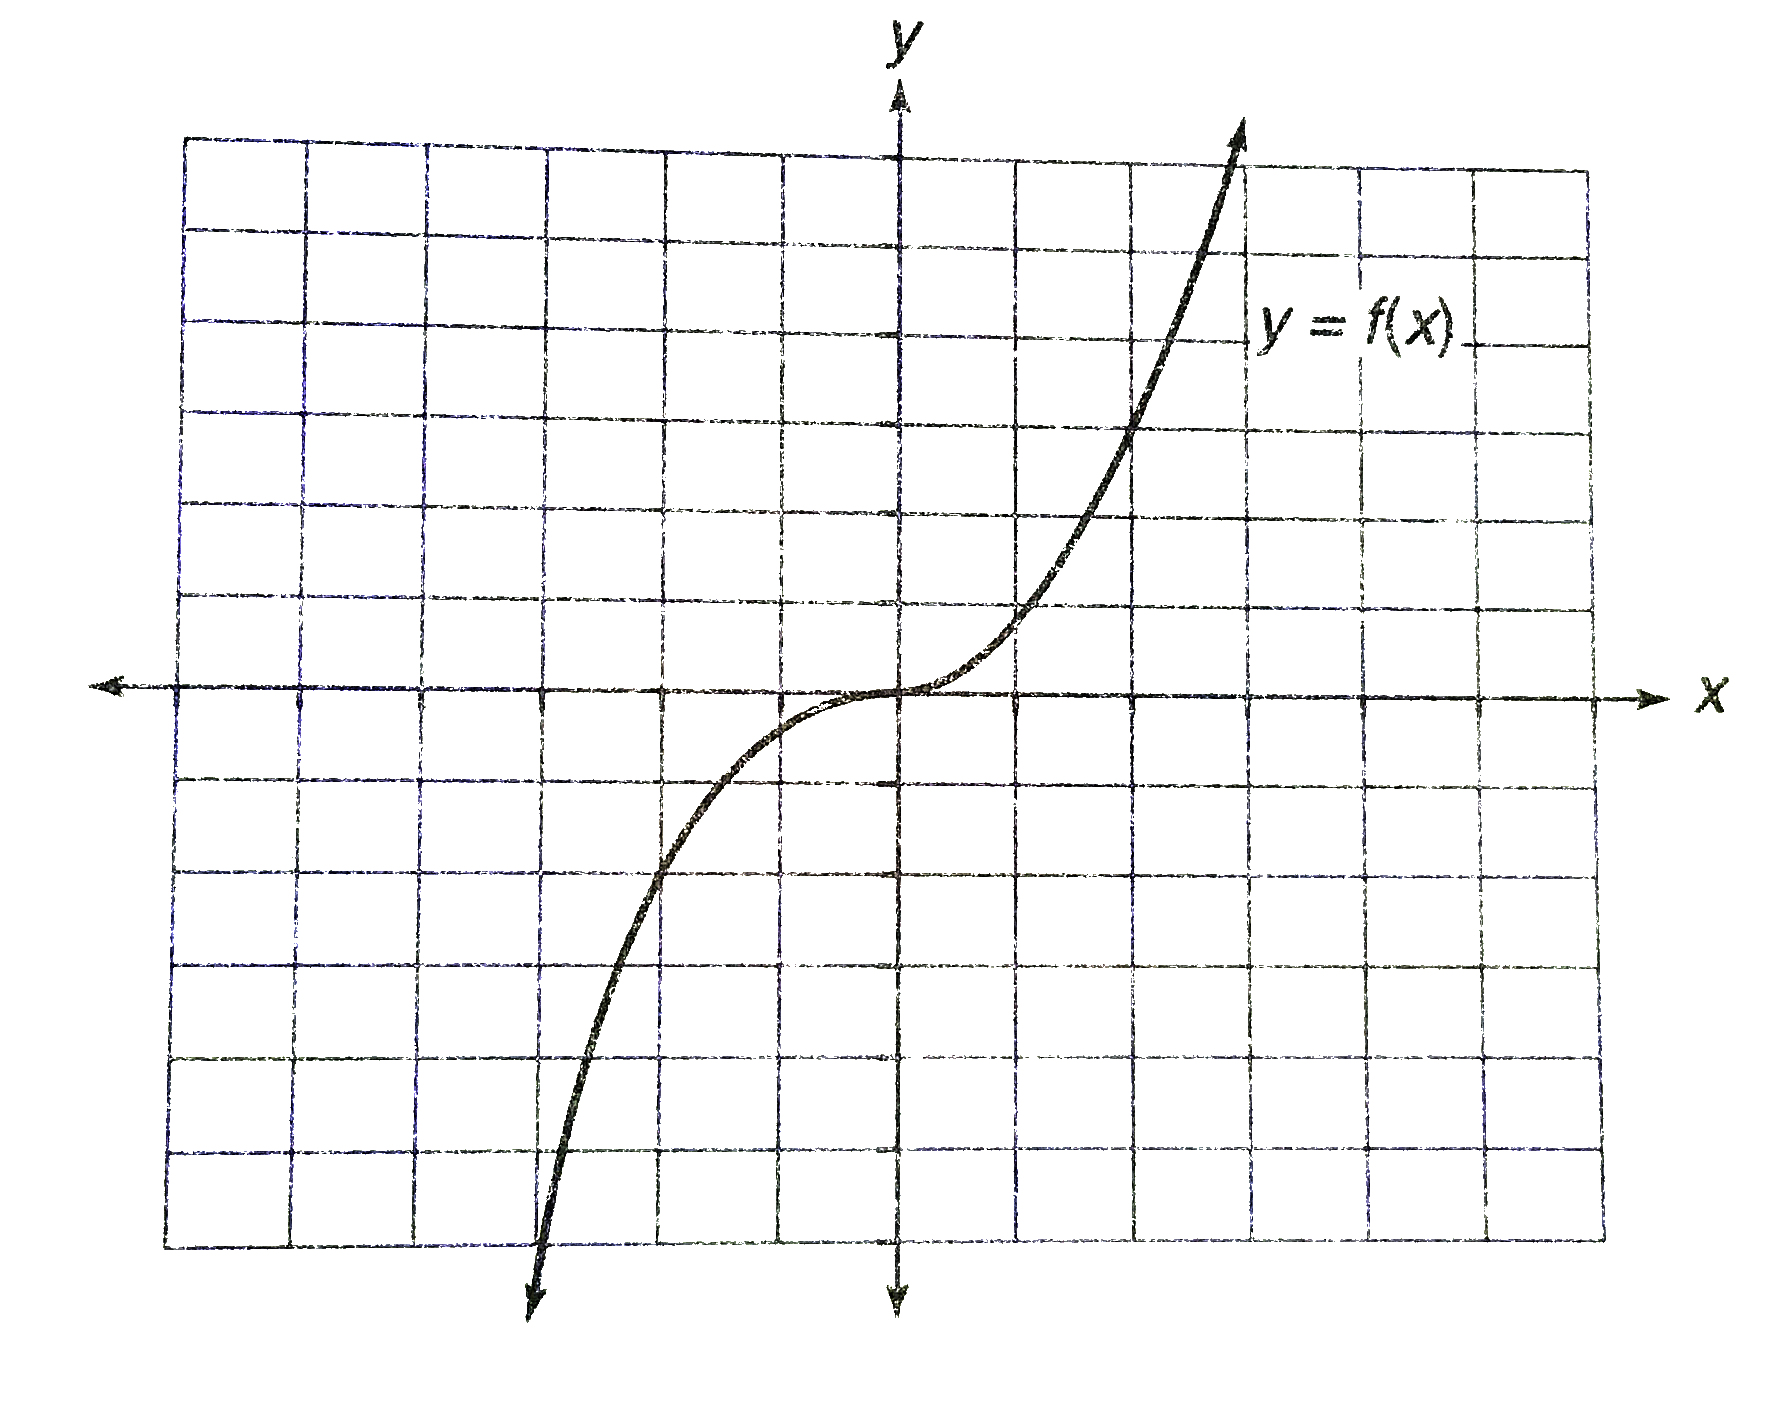
Which of the following could represents the graph of y=f(x−2)+1?
View Solution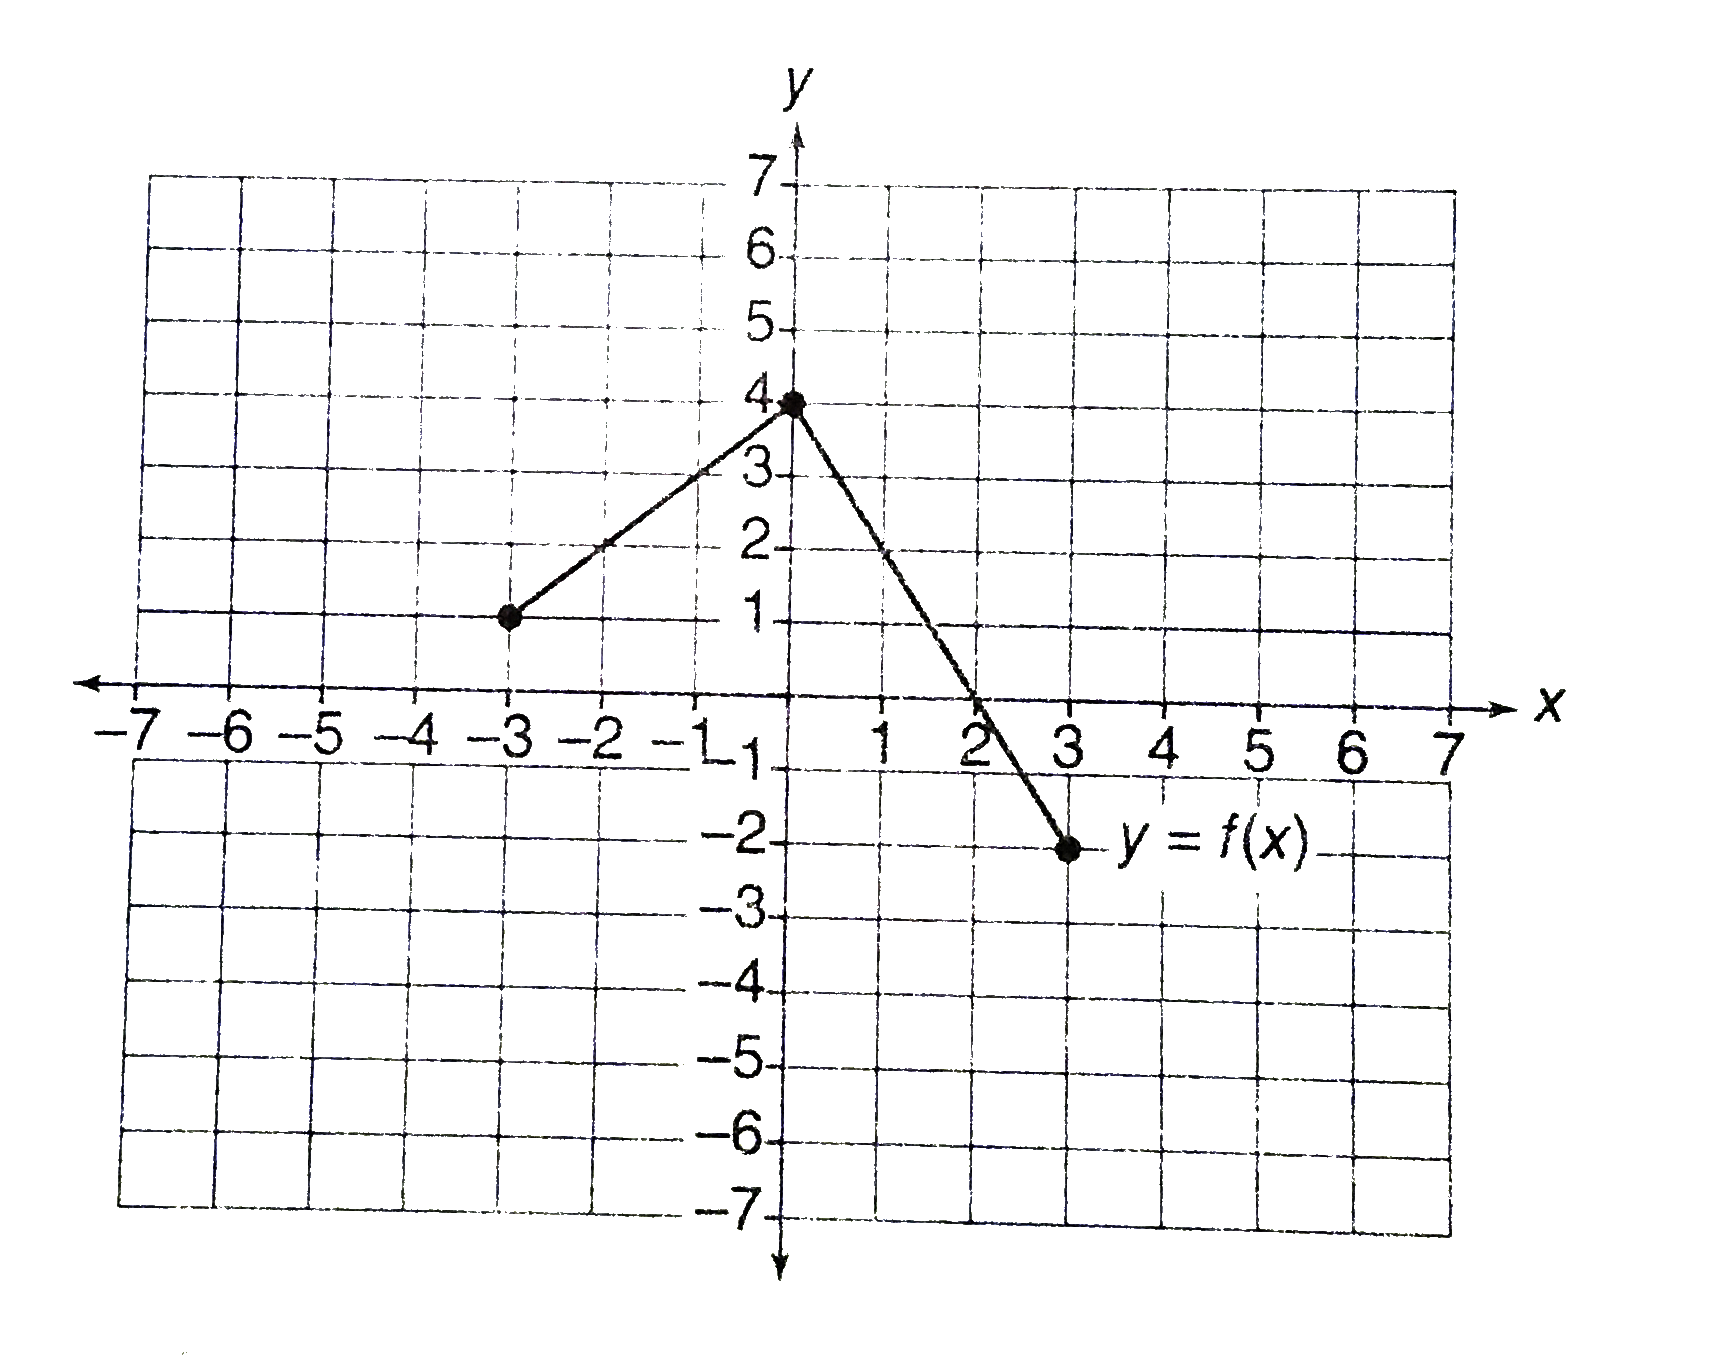
If the accomanying figure above shows the graph of function f, which of the following could represent the graph of y=f(x+1)?
View SolutionIf function f has exactly two distinct real zeros, which of the following graphs could be the complete graph of f (x) ?
View Solution
