(1) What is the shape of the curve obtained on plotting P against V at constant temperature for an ideal eas ?
(2) Which law is signified by the relation, V1T1=V2T2 ?
Step by step video & image solution for (1) What is the shape of the curve obtained on plotting P against V at constant temperature for an ideal eas ? (2) Which law is signified by the relation, V_(1)/T_(1) = V_(2)/T_(2) ? by Chemistry experts to help you in doubts & scoring excellent marks in Class 11 exams.
Updated on:21/07/2023Topper's Solved these Questions
Similar Questions
Knowledge Check
The voltage V and current I v graphs for a conductor at two different temperatures T1andT2 are shown in the figure. The relation between T1andT2 is
 AT1>T2BT1<T2CT1=T2DT1=1T2
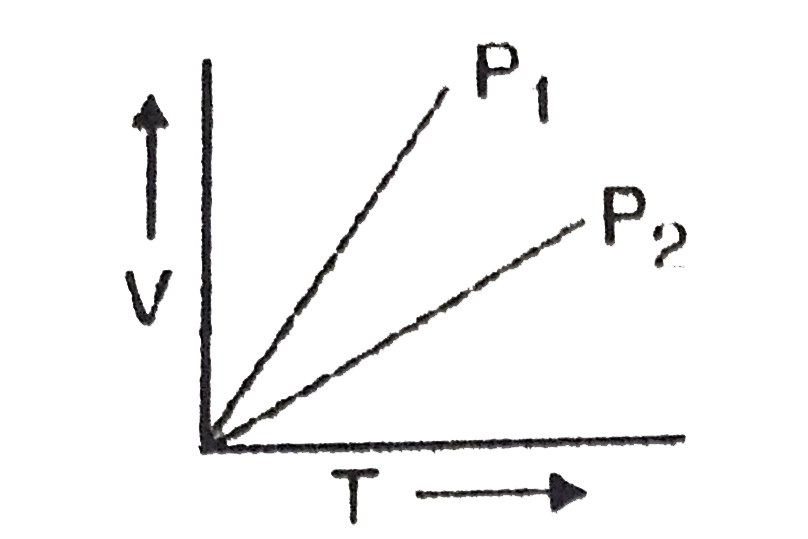
V vs T curves at constant pressure P1 and P2 for an ideal gas are shown below

Which is correct ?
View SolutionWhich law is signified by the equation :
Vt=V0(1+t273)
State the law in a different manner.
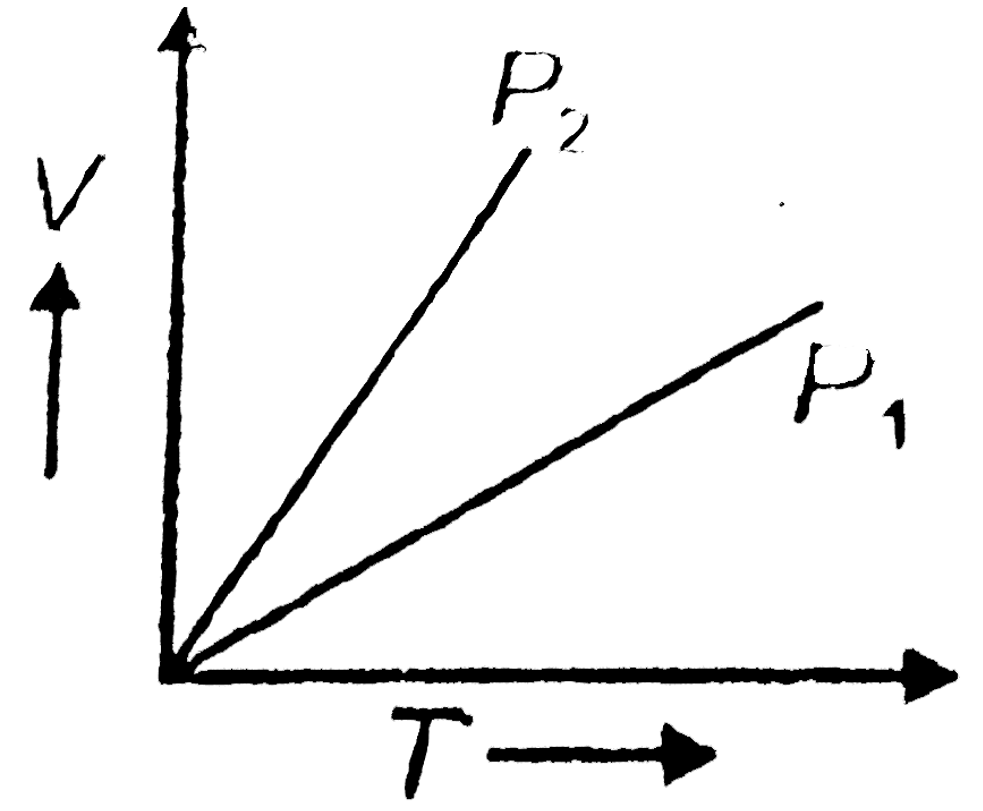
View SolutionFor an ideal gas V−T curves at constant pressure P1 & P2 are shown in figure, from the figure
_E01_061_Q01.png)
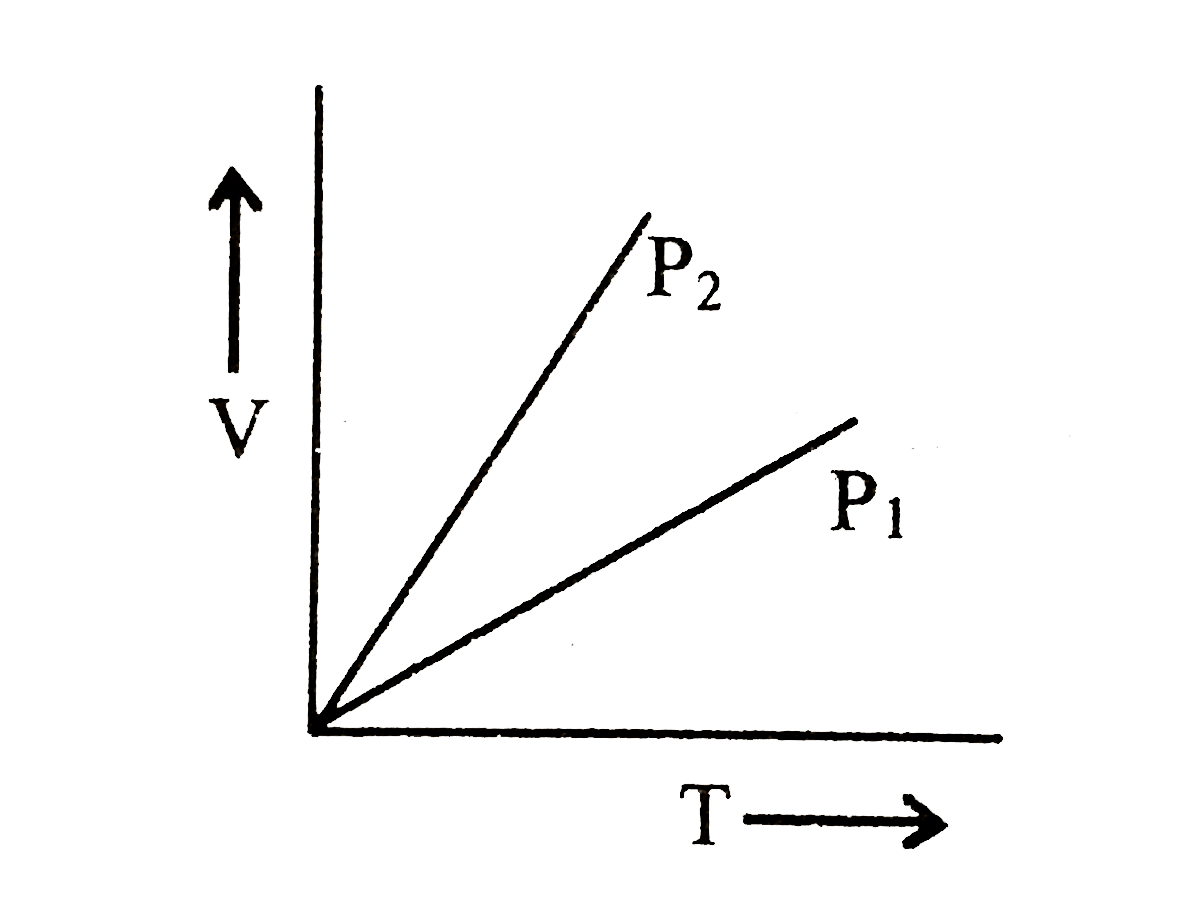
View SolutionFor V versus T curves at constant pressure P1andP2 for an ideal gas are shown in the figure given below

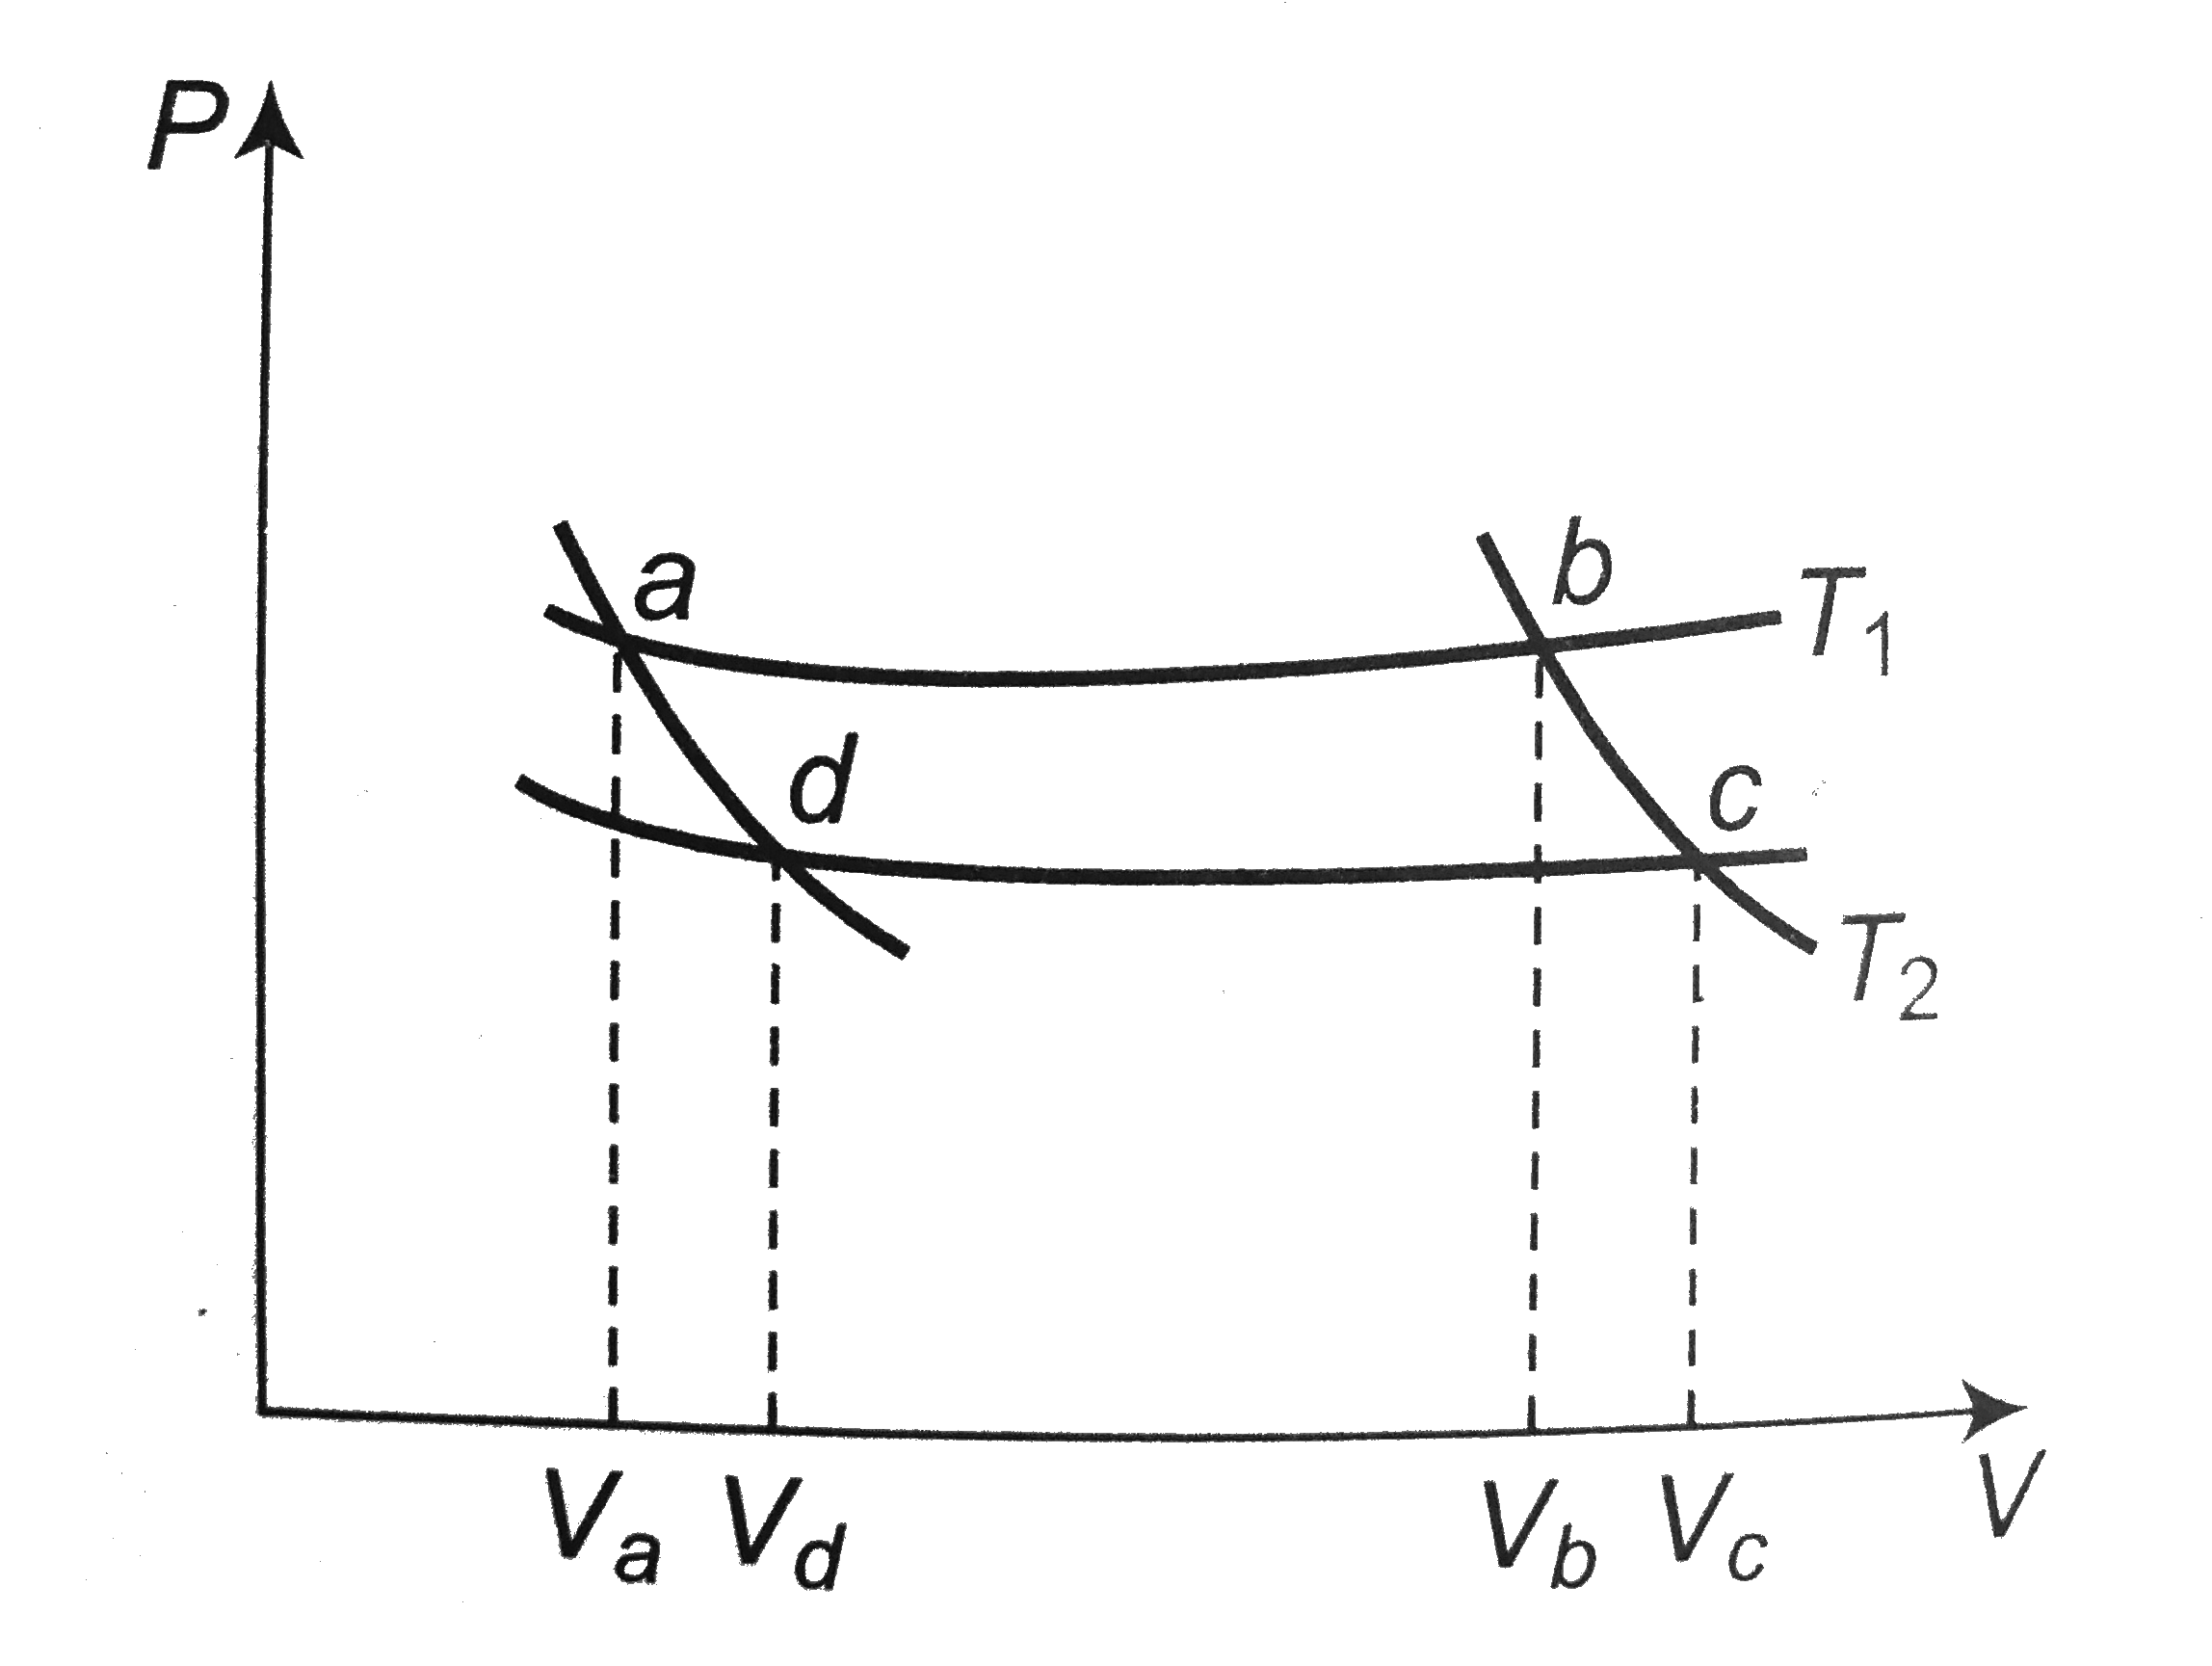
View SolutionIn the following P-V diagram two adiabatics cut two isothermals at temperature T1andT2 (fig). The value of VaVd will be

View SolutionAn ideal gas expands adiabatically from an initial temperature T1 to a final temperature T2. Prove that the work done by the gas is CV(T1−T2).
View SolutionThe p−V diagram of two different masses m1 and m2 are drawn (as shown) at constant temperature (T).
View Solution

