Plot a graph of terminnal velocity versus time.
Topper's Solved these Questions
- BOOK - ICSECHAPTER - SAMPLE QUESTION PAPER - 01 EXERCISE - SECTION - D12videos
SAMPLE QUESTION PAPER - 01
- BOOK - ICSECHAPTER - SAMPLE QUESTION PAPER - 01 EXERCISE - SECTION - B14videos
SAMPLE QUESTION PAPER - 01
- BOOK - ICSECHAPTER - PROPERTIES OF MATTEREXERCISE - MODULE 4 ( TEMPERATURE ) UNSOLVED PROBLEMS12videos
PROPERTIES OF MATTER
- BOOK - ICSECHAPTER - SAMPLE QUESTION PAPER 4EXERCISE - SECTION - D (Answer all questions.)7videos
SAMPLE QUESTION PAPER 4
Similar Questions
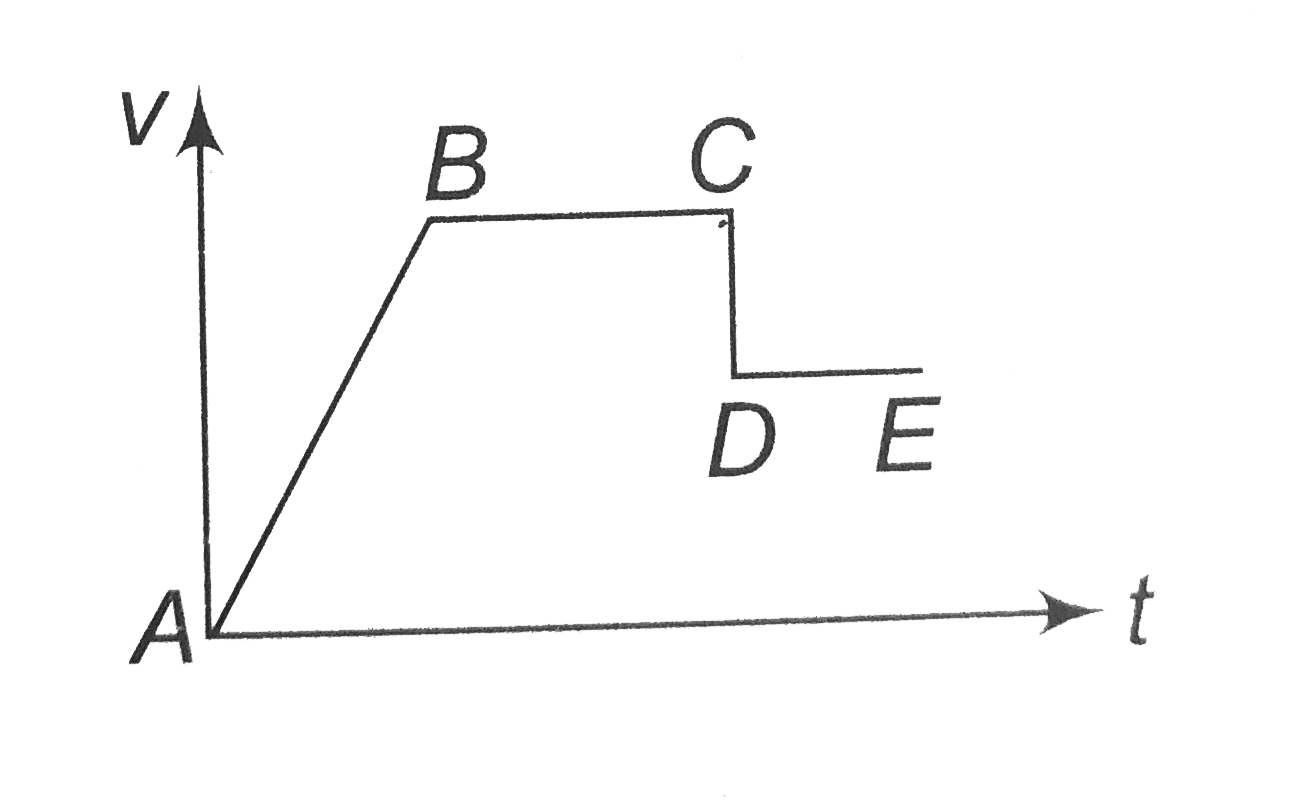
The adjoining diagram shows the velocity versus time plot for a particle . The work done by the force on the particel is positive from
 View Solution
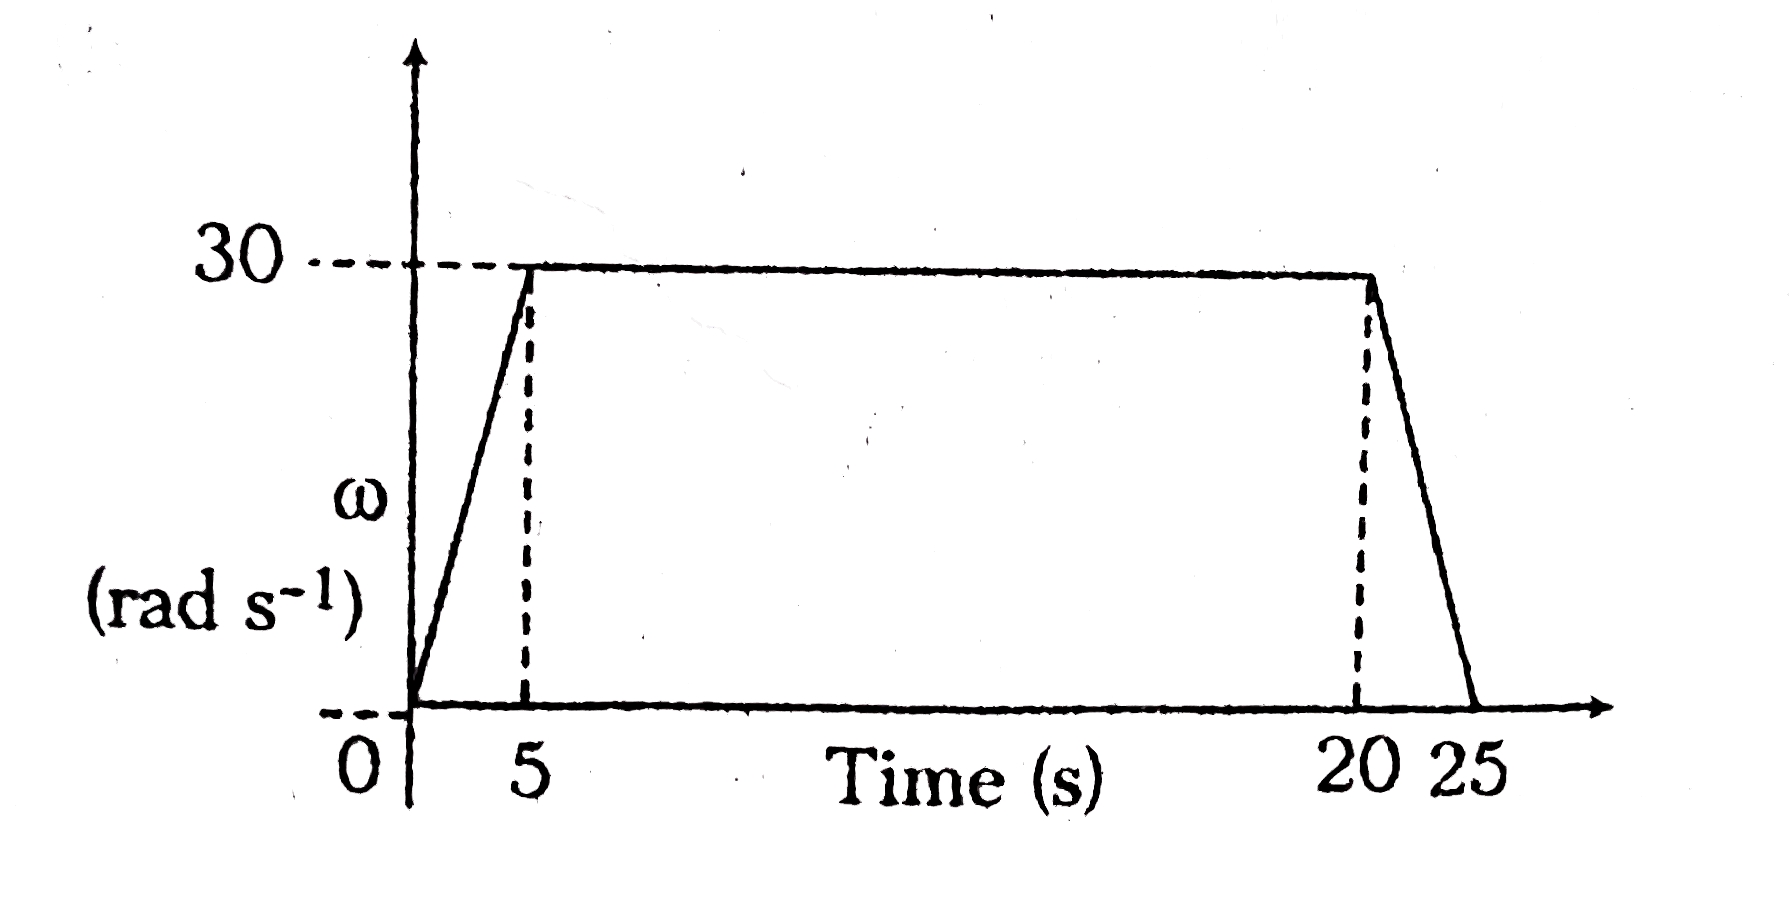
The figure shows the angular velocity versus time graph of a flywheel. The angle, in radians through which the flywheel turns during 25 s is
 View Solution
Which of the following best represents the graph of velocity (v) versus displacement (s) for a particle travelling with an acceleration (uniform) and some non zero initial velocity?
View SolutionIn the figure shown, F is in newton and t in seconds, Take g=10m/s2.
(a) Plot acceleration of the block versus time graph.
(b) Find force of friction at,t=2sandt=8s.
 View Solution
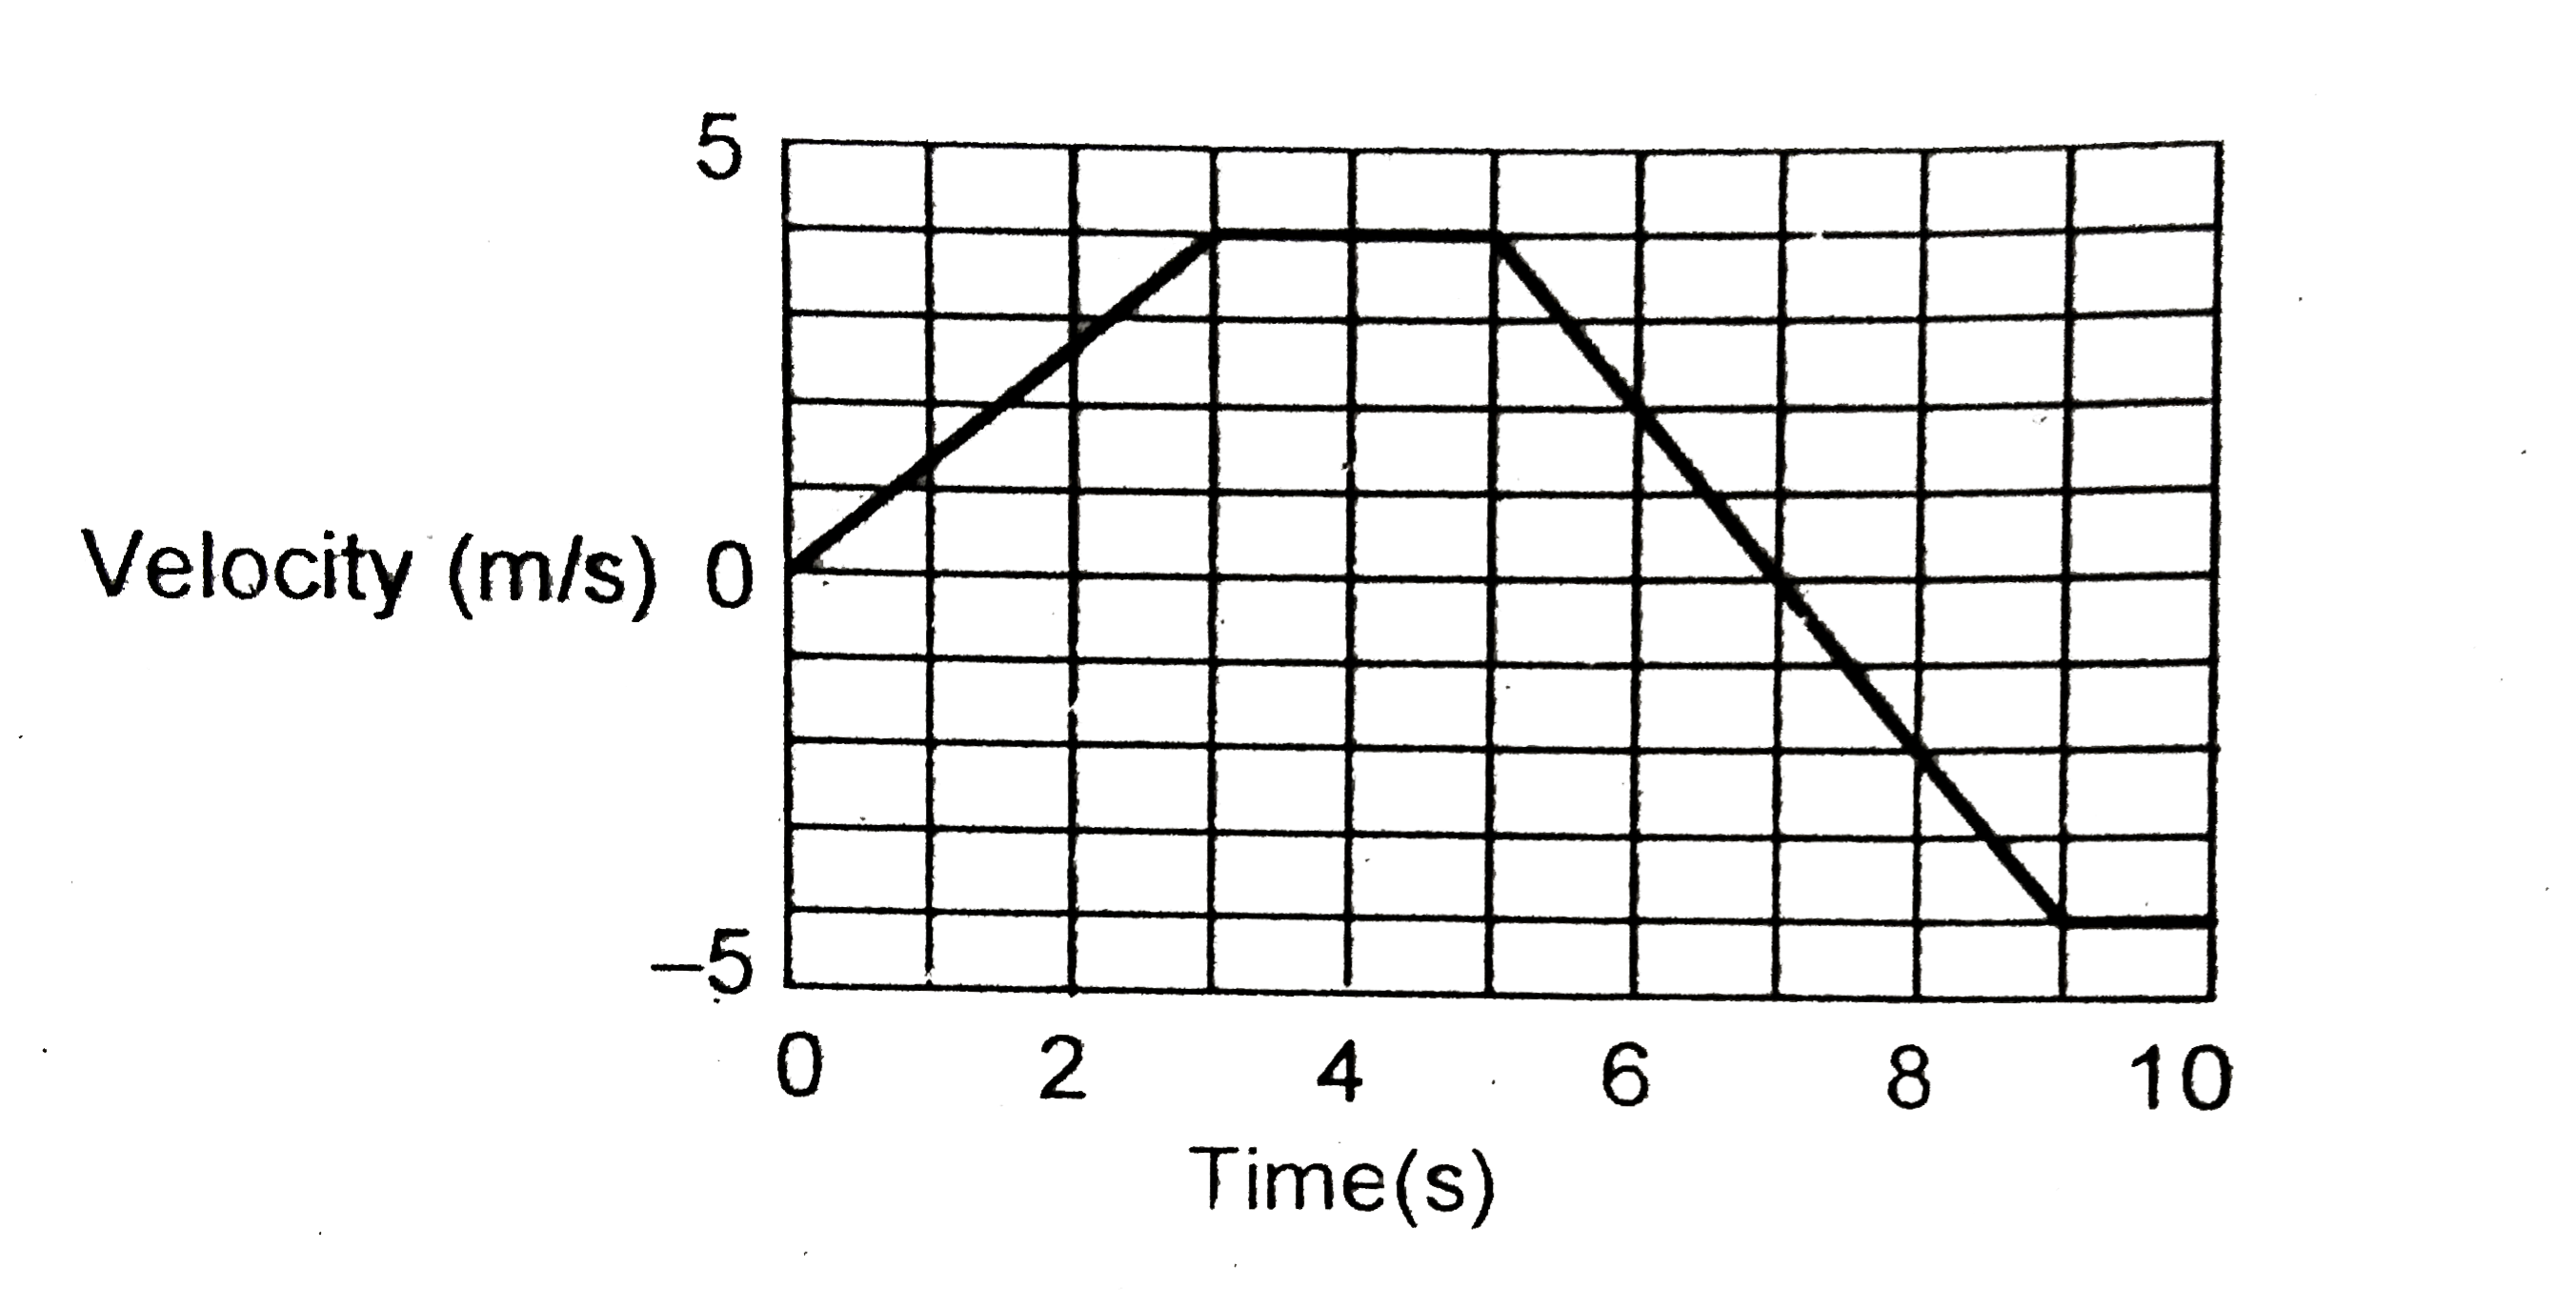
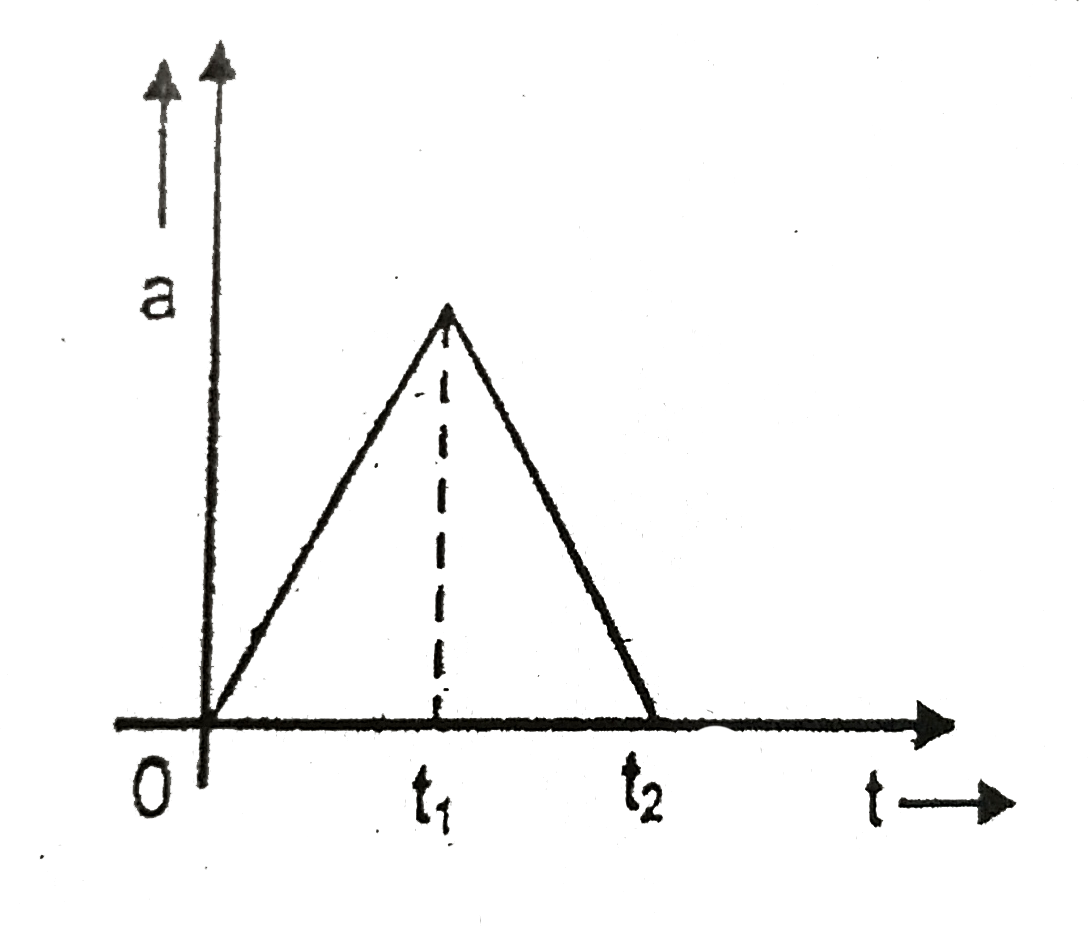
An object starts at the origin in a straight line. Its velocity versus time graph is shown in the figure. Which one of the following choices best gives the proper intervals (s) of time for which the object is moving away from the origin?View SolutionA particle starts to move along a straight line. The acceleration versus time graph of particle is as shown in figure. The correct velocity versus time graph is :
 View Solution
A car changes its velocity linearly from 10m/s to 20m/s in 5 seconds. Plot v-t graph and write velocity as a function of time.
View SolutionThe graph below shws the velocity versus time graph for a body
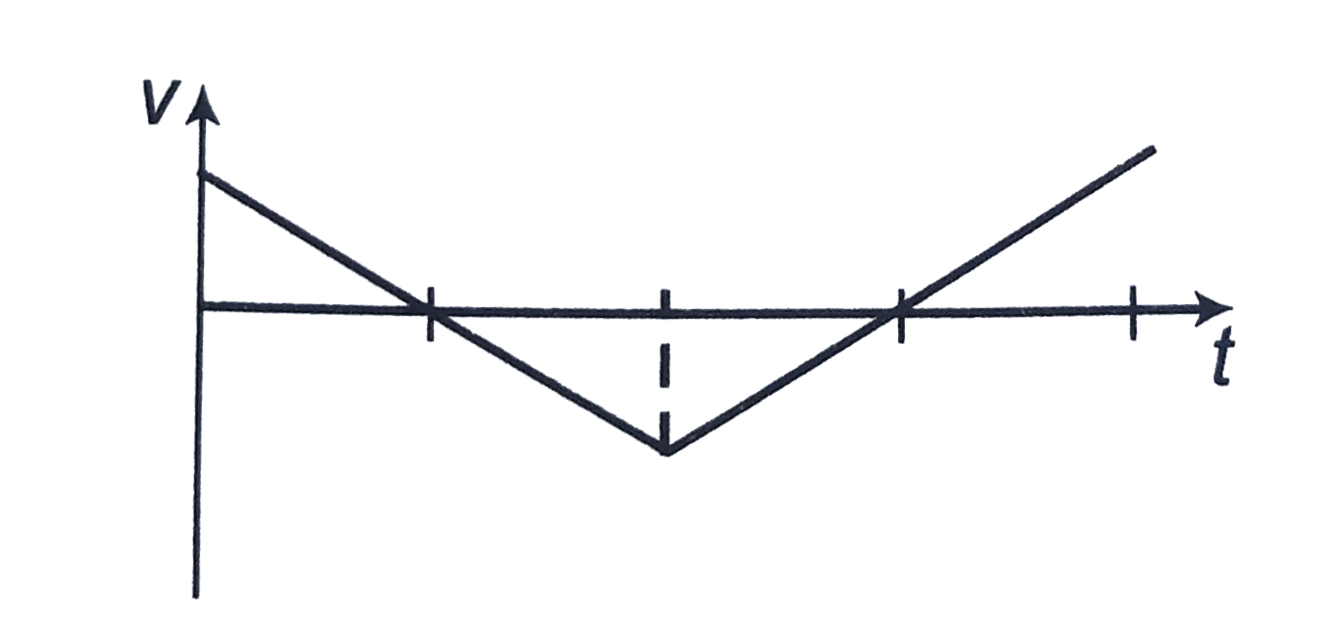
Which of the following graph represents the corresponding acceleration v//s time graph?View SolutionPlot a graph showing variation of current versus voltage for the material Ga.
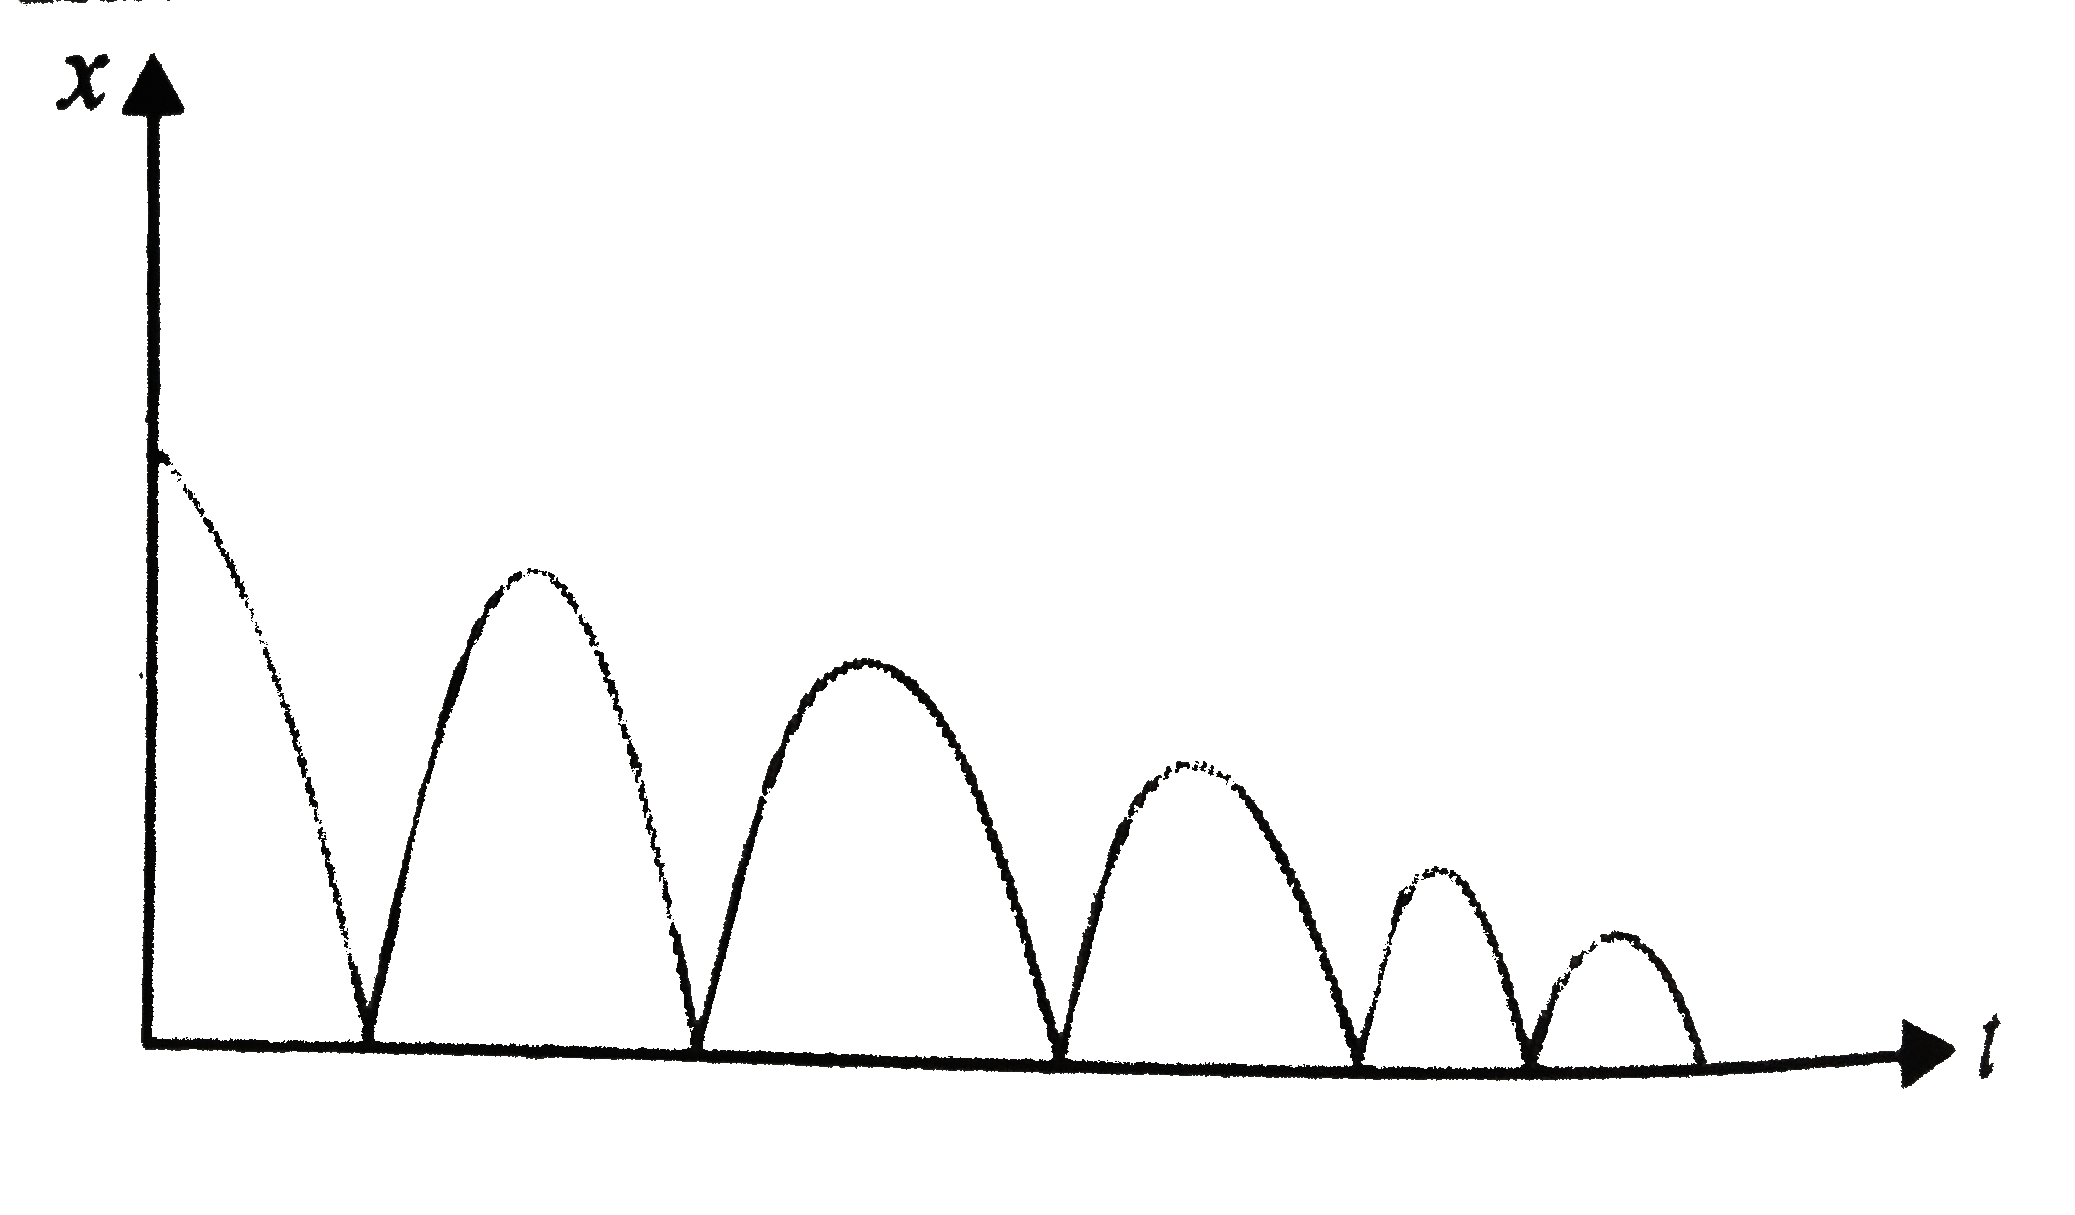
View SolutionA ball is dropped and its displacement vs time graph is as shown in Fig. 2 (EP) .7 displacement (x) is from ground and all quantities are +ve upwards. (a) Plot qualitatively velocity vs time graph. (b) plot qualitatively acceleration vs time graph .
 View Solution


