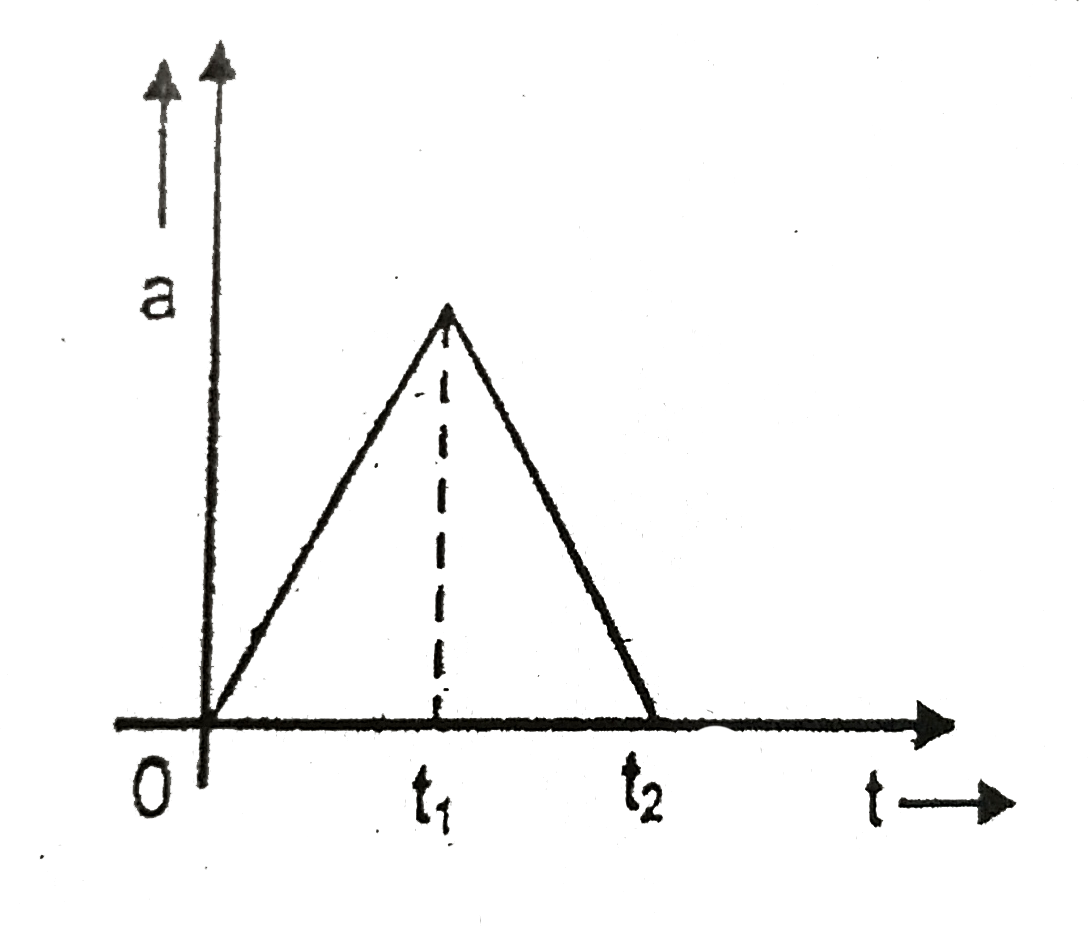
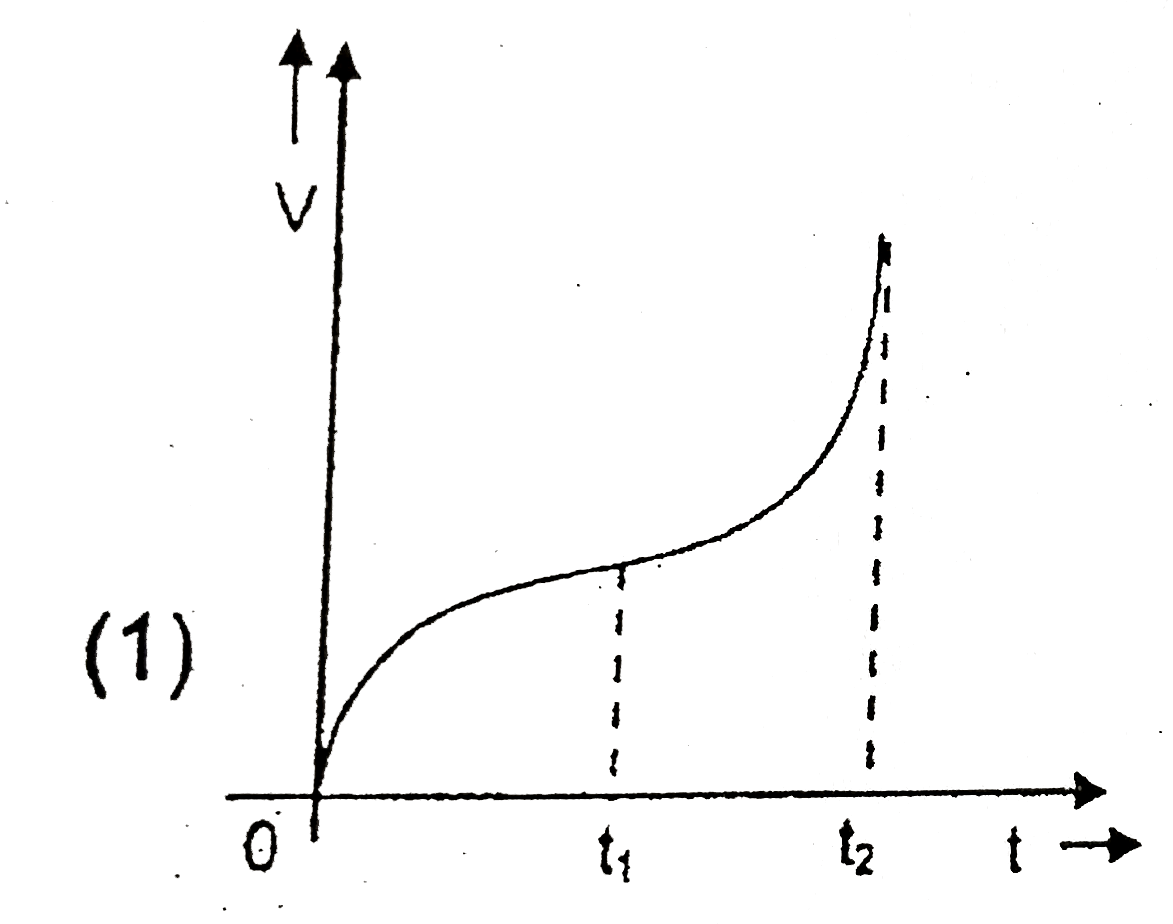
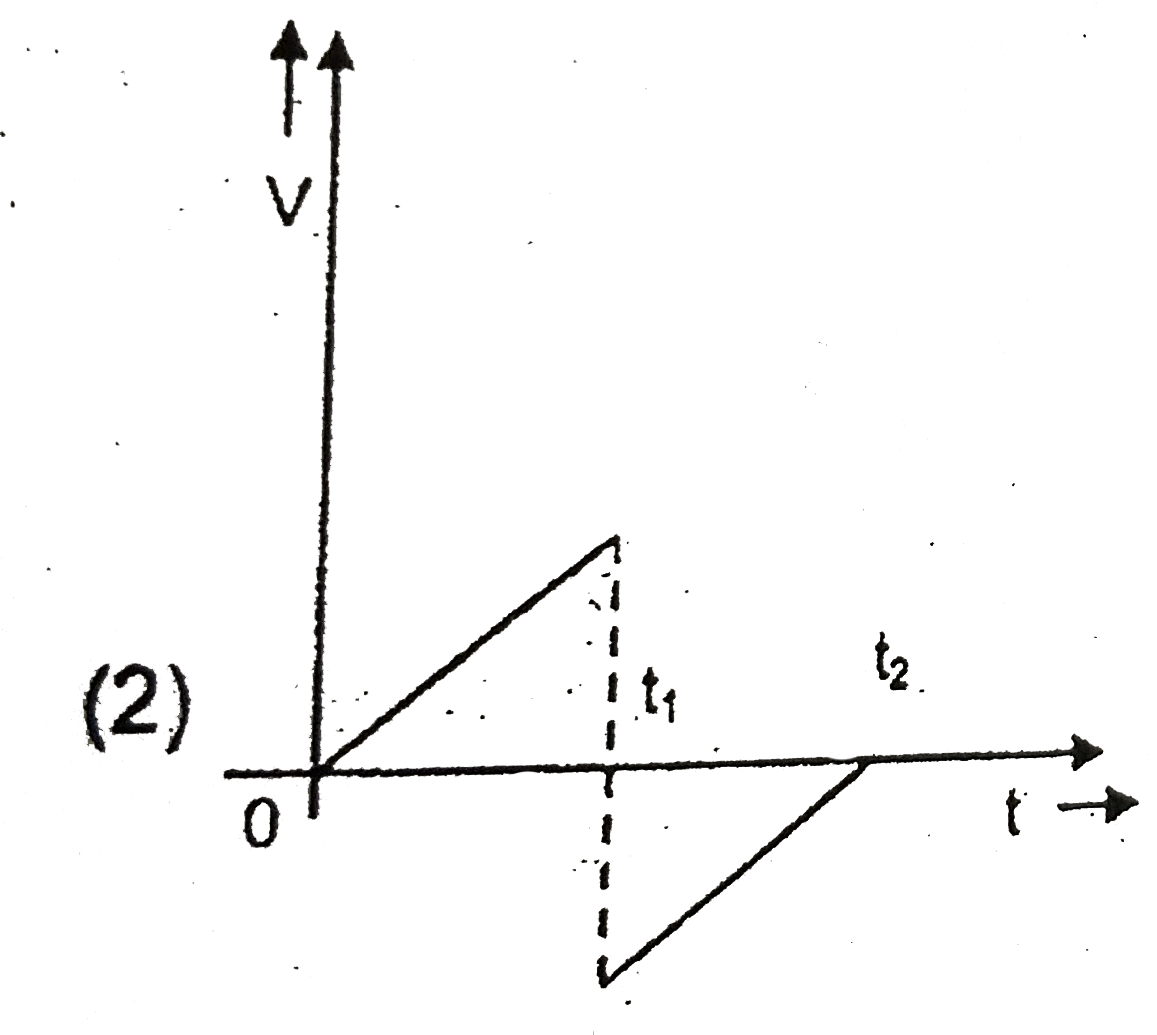
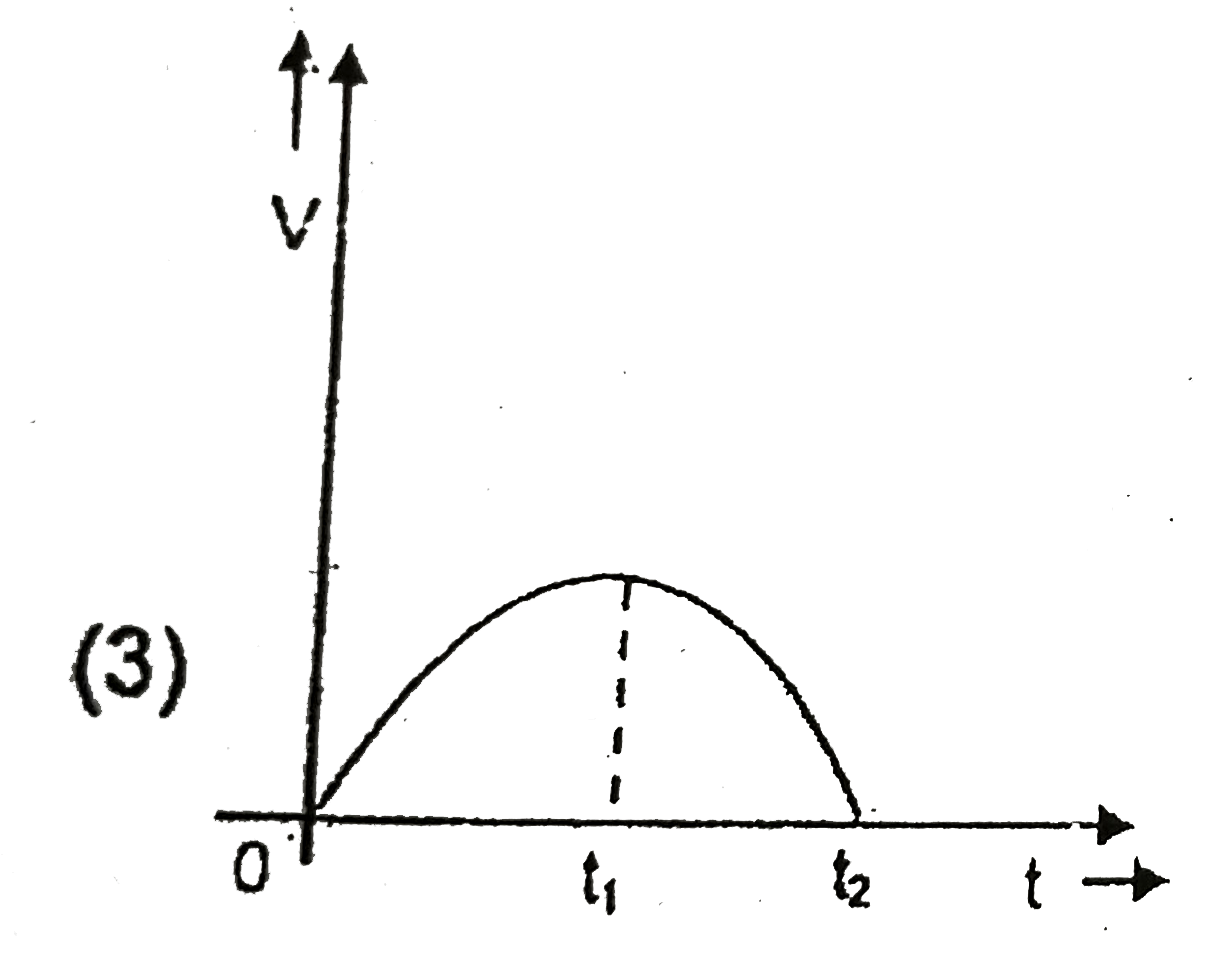
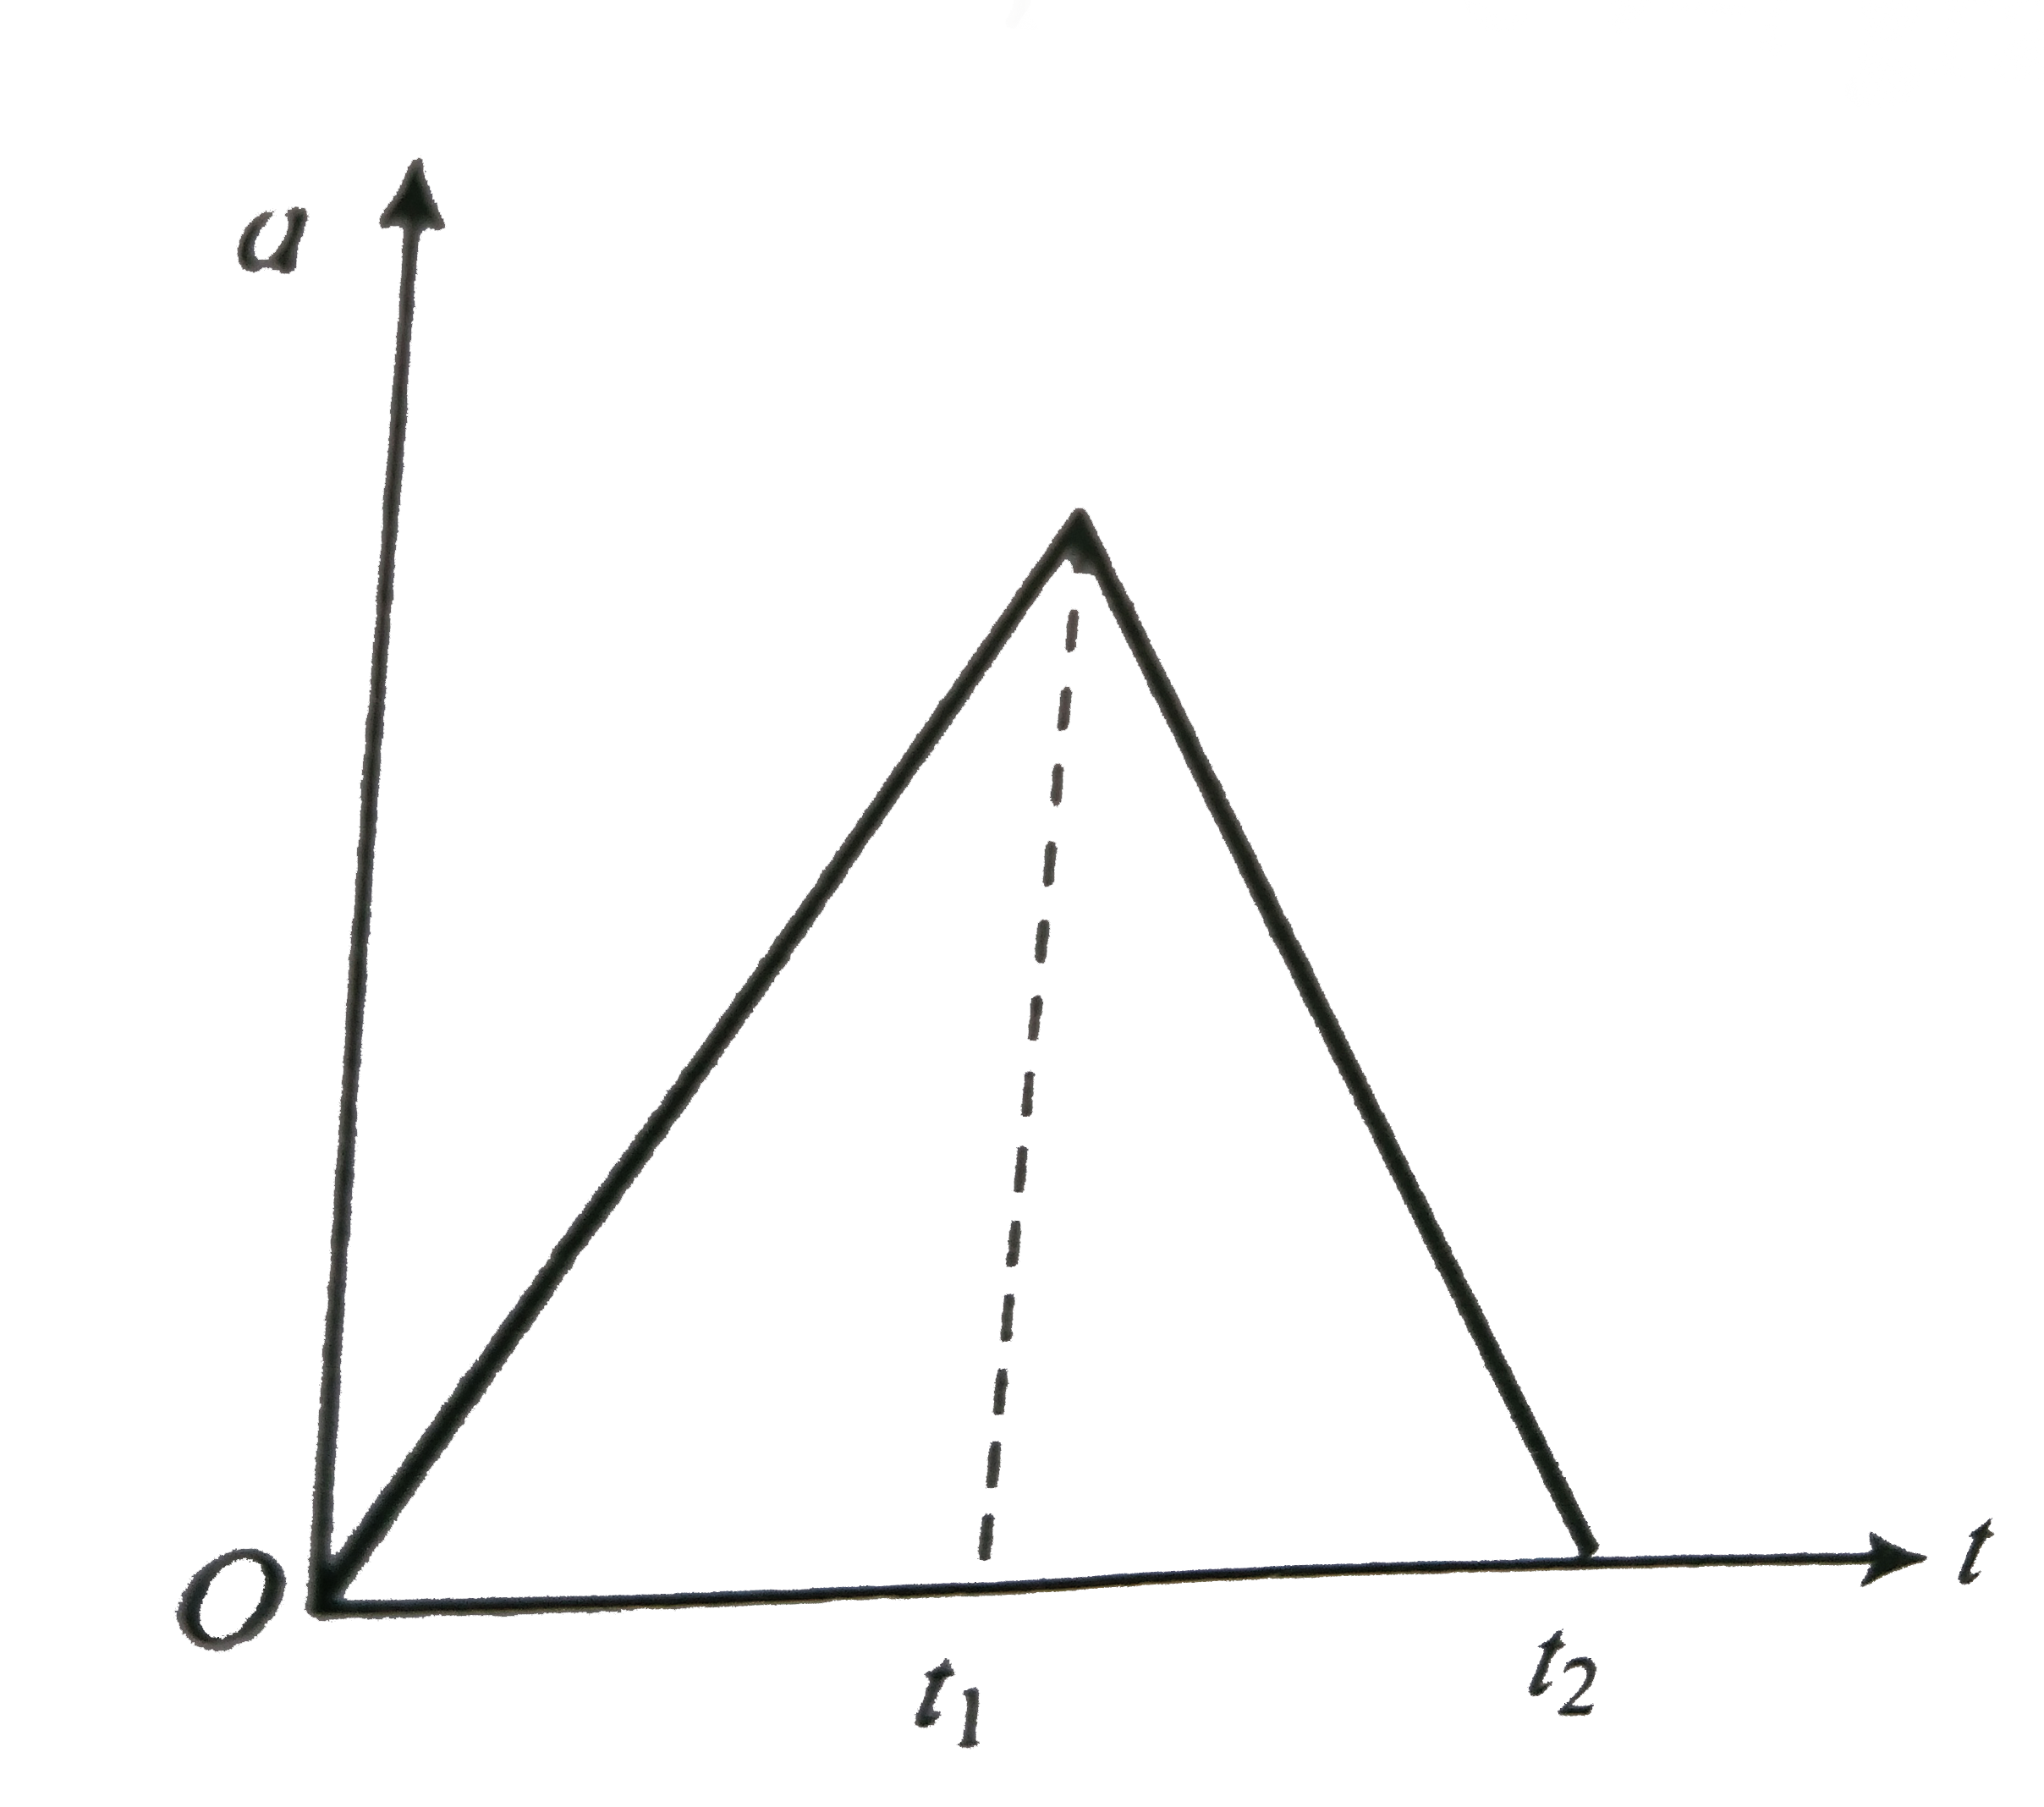
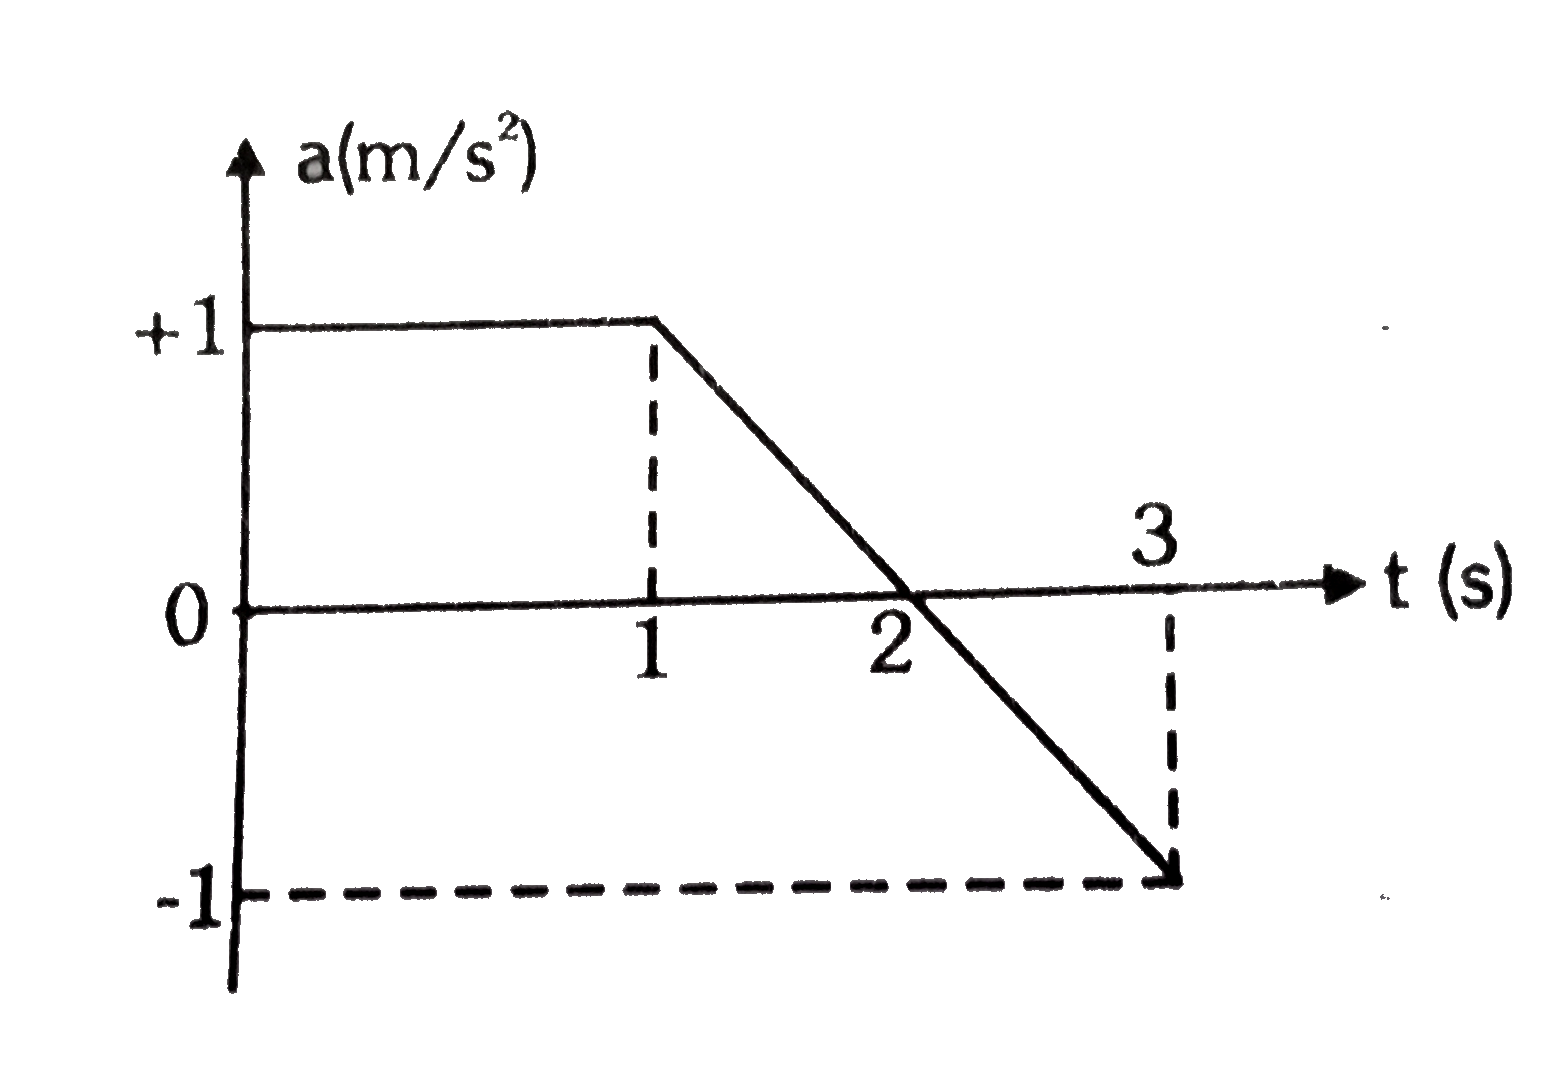
A particle starts to move along a straight line. The acceleration versus time graph of particle is as shown in figure. The correct velocity versus time graph is :

The correct Answer is:D
A particle ………….
for t graph ∵slope>0 ltbgt For 0<t<t1,dvdt⇒ increasing
for t1<t<t2,dvdt⇒ "decreasing"
Topper's Solved these Questions
- TEST PAPERSBOOK - RESONANCE ENGLISHCHAPTER - TEST PAPERSEXERCISE - PART - II PHYSICS
106 Videos
- SIMPLE HARMONIC MOTION BOOK - RESONANCE ENGLISHCHAPTER - SIMPLE HARMONIC MOTION EXERCISE - Advanced Level Problems
13 Videos
- TEST SERIESBOOK - RESONANCE ENGLISHCHAPTER - TEST SERIESEXERCISE - PHYSICS
130 Videos
Similar Questions
The velocity − time graph of a particle is as shown in figure

View SolutionThe acceleration versus time graph of a particle is shown in. The respective v−t graph of the particle is .
 .
.
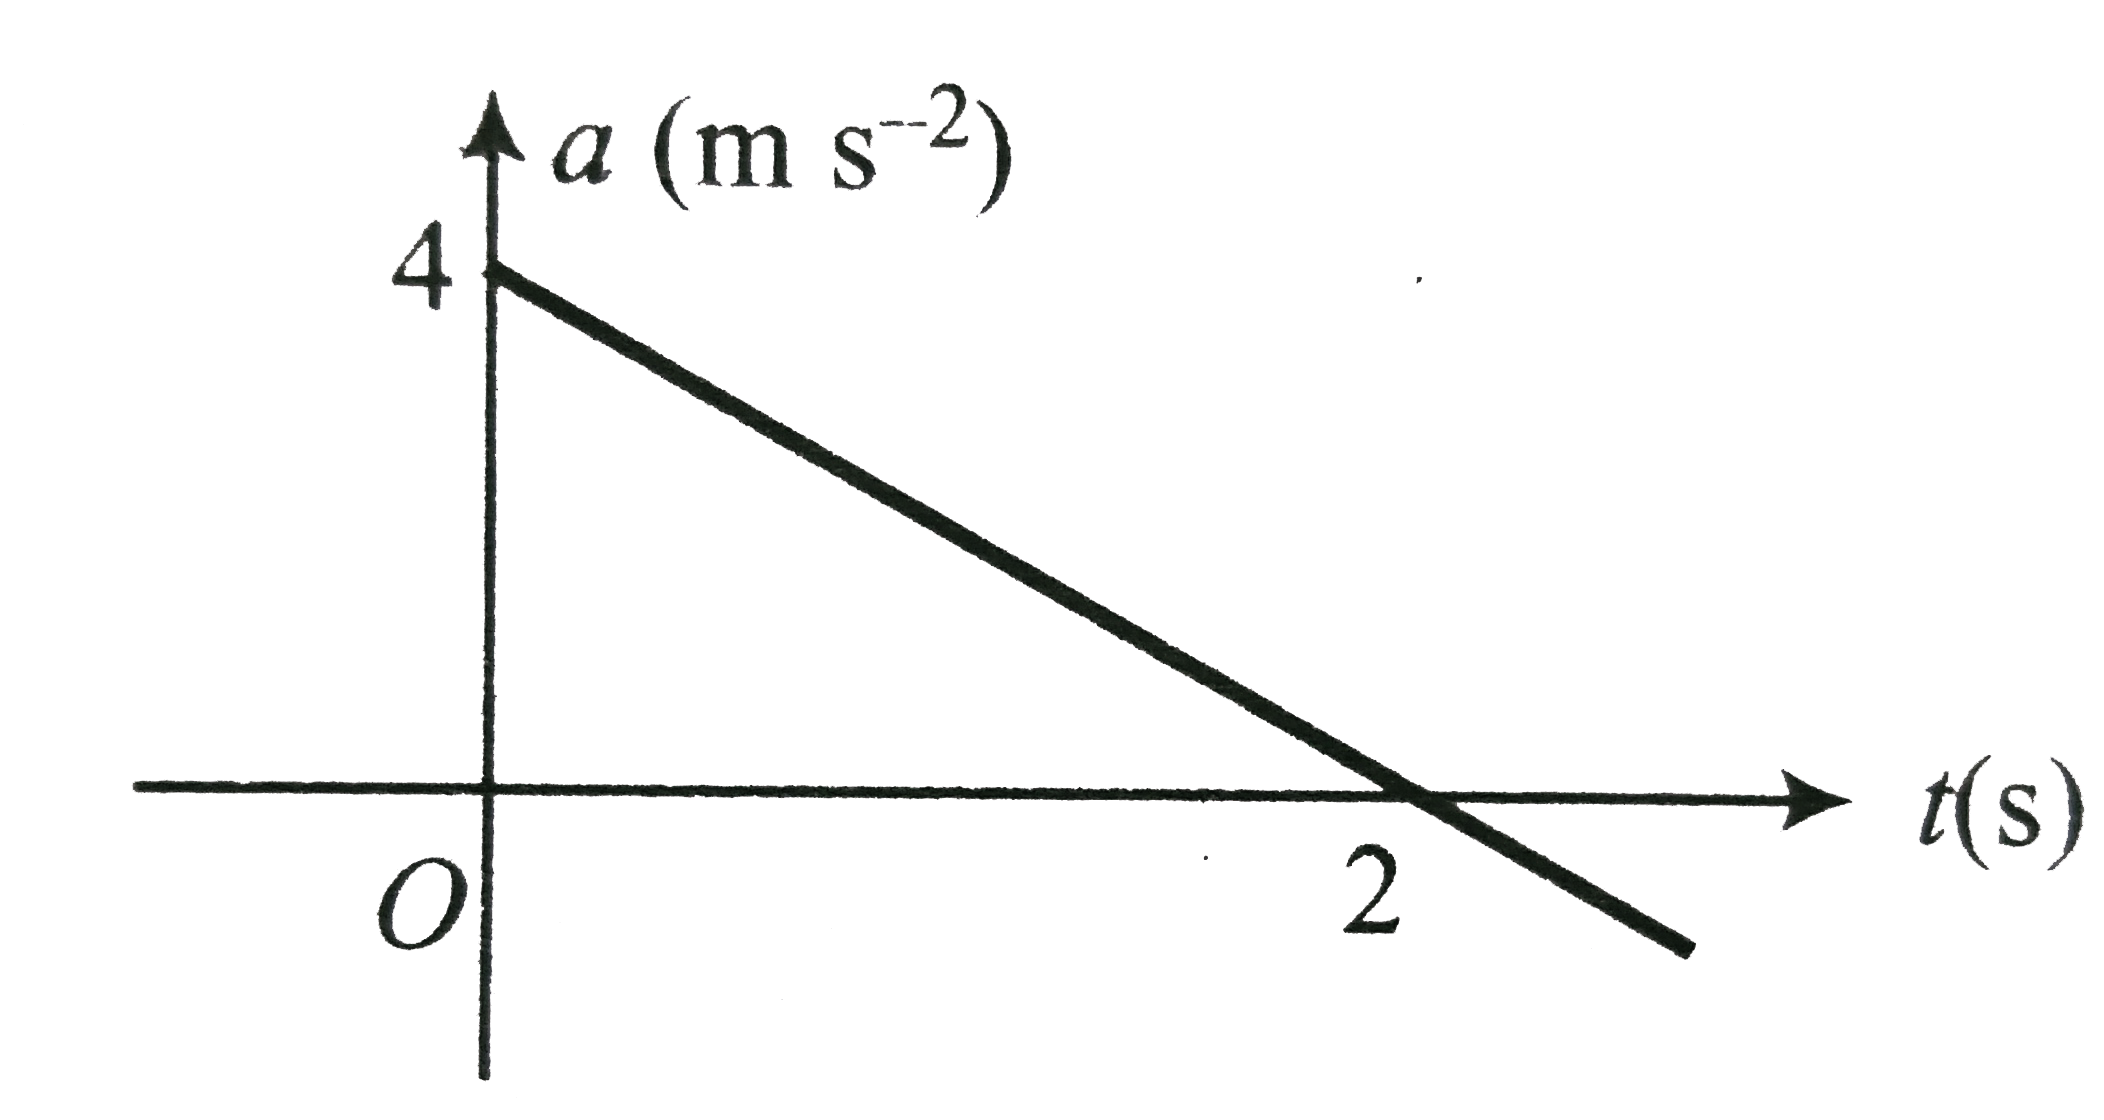
View SolutionThe acceleration versus time graph of a particle moving in a straight line is show in. The velocity-time graph of the particle would be
 .
.
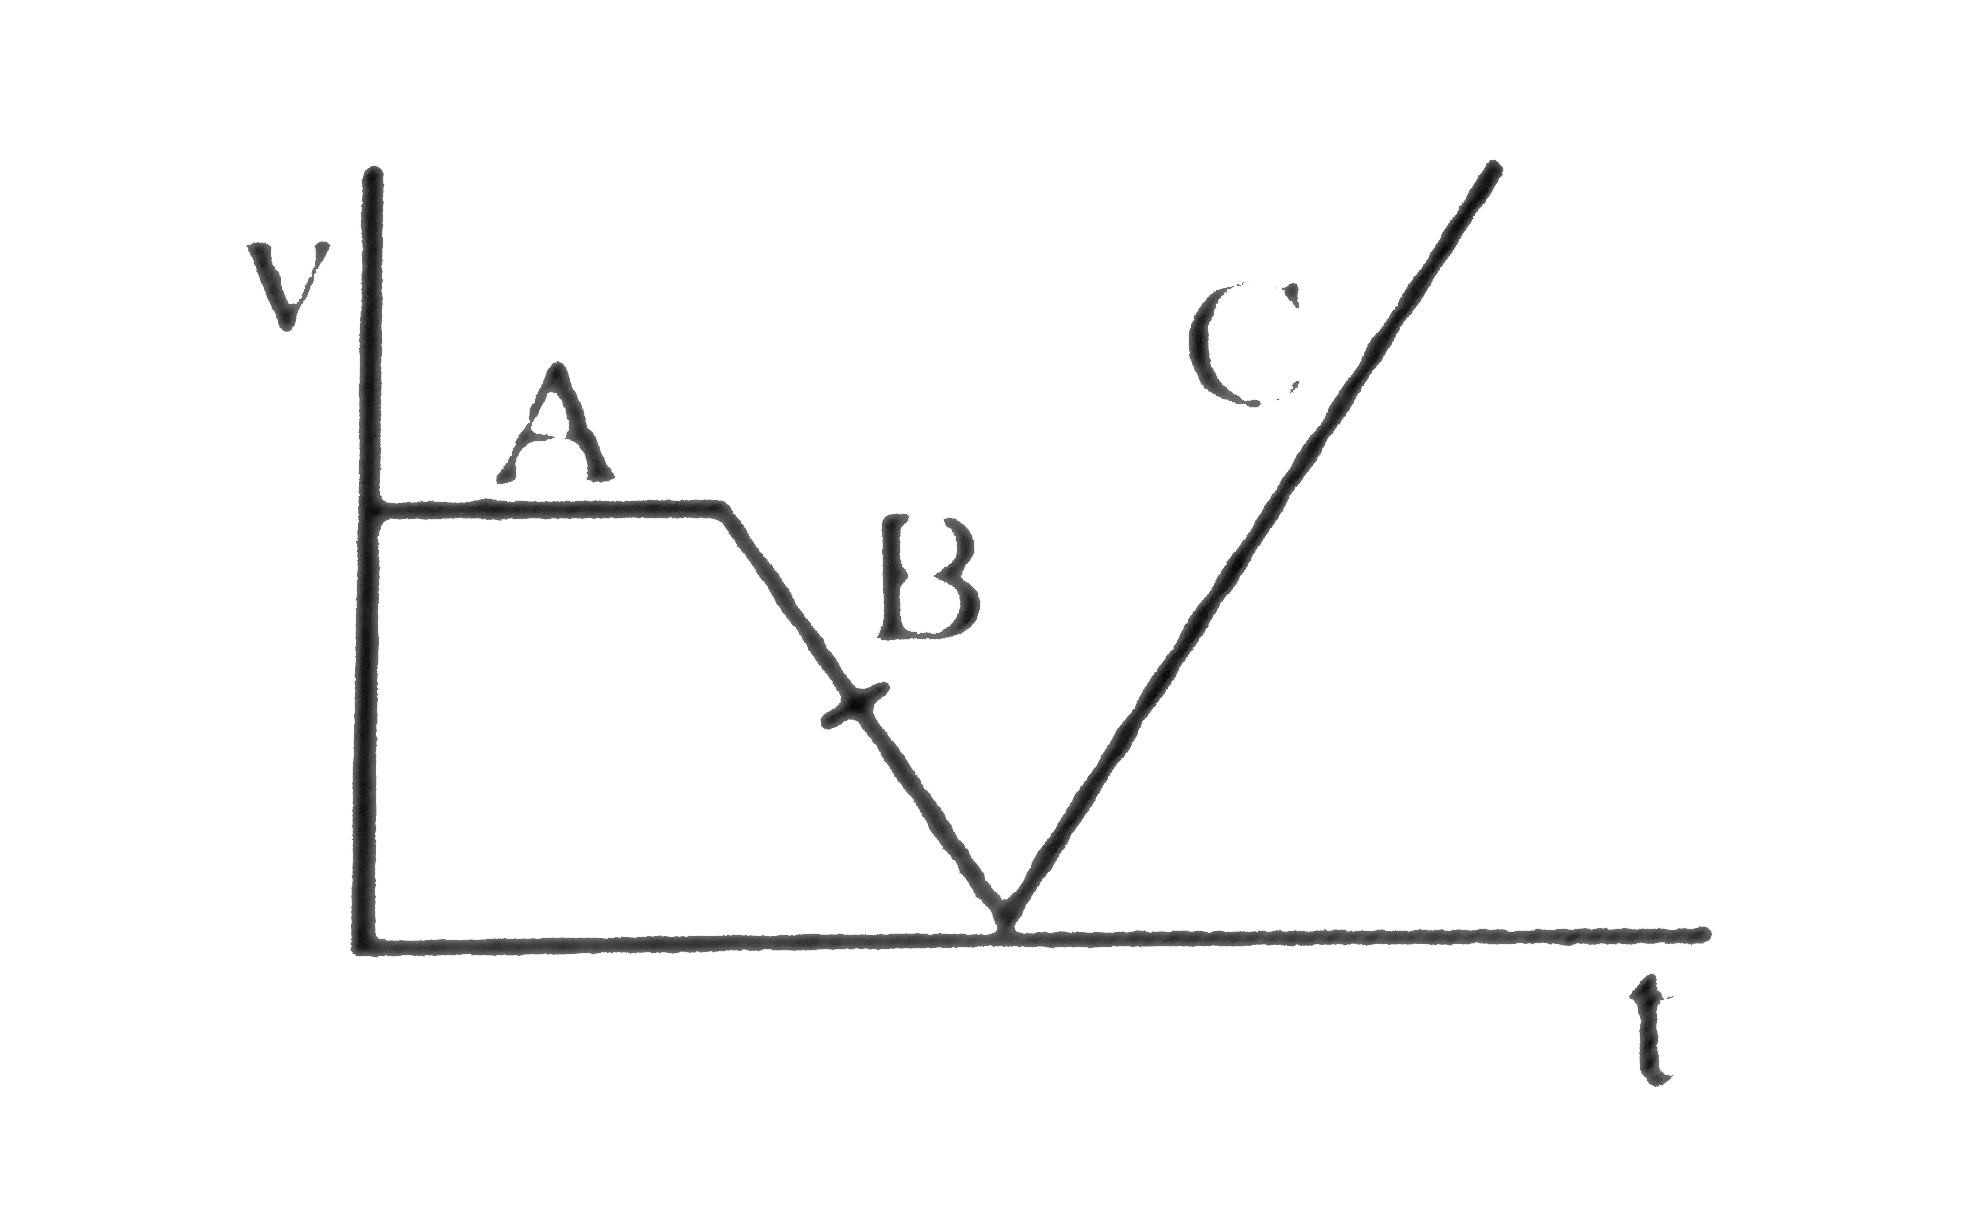
View SolutionVelocity versus time graph of a body is shown in figure. It explains that
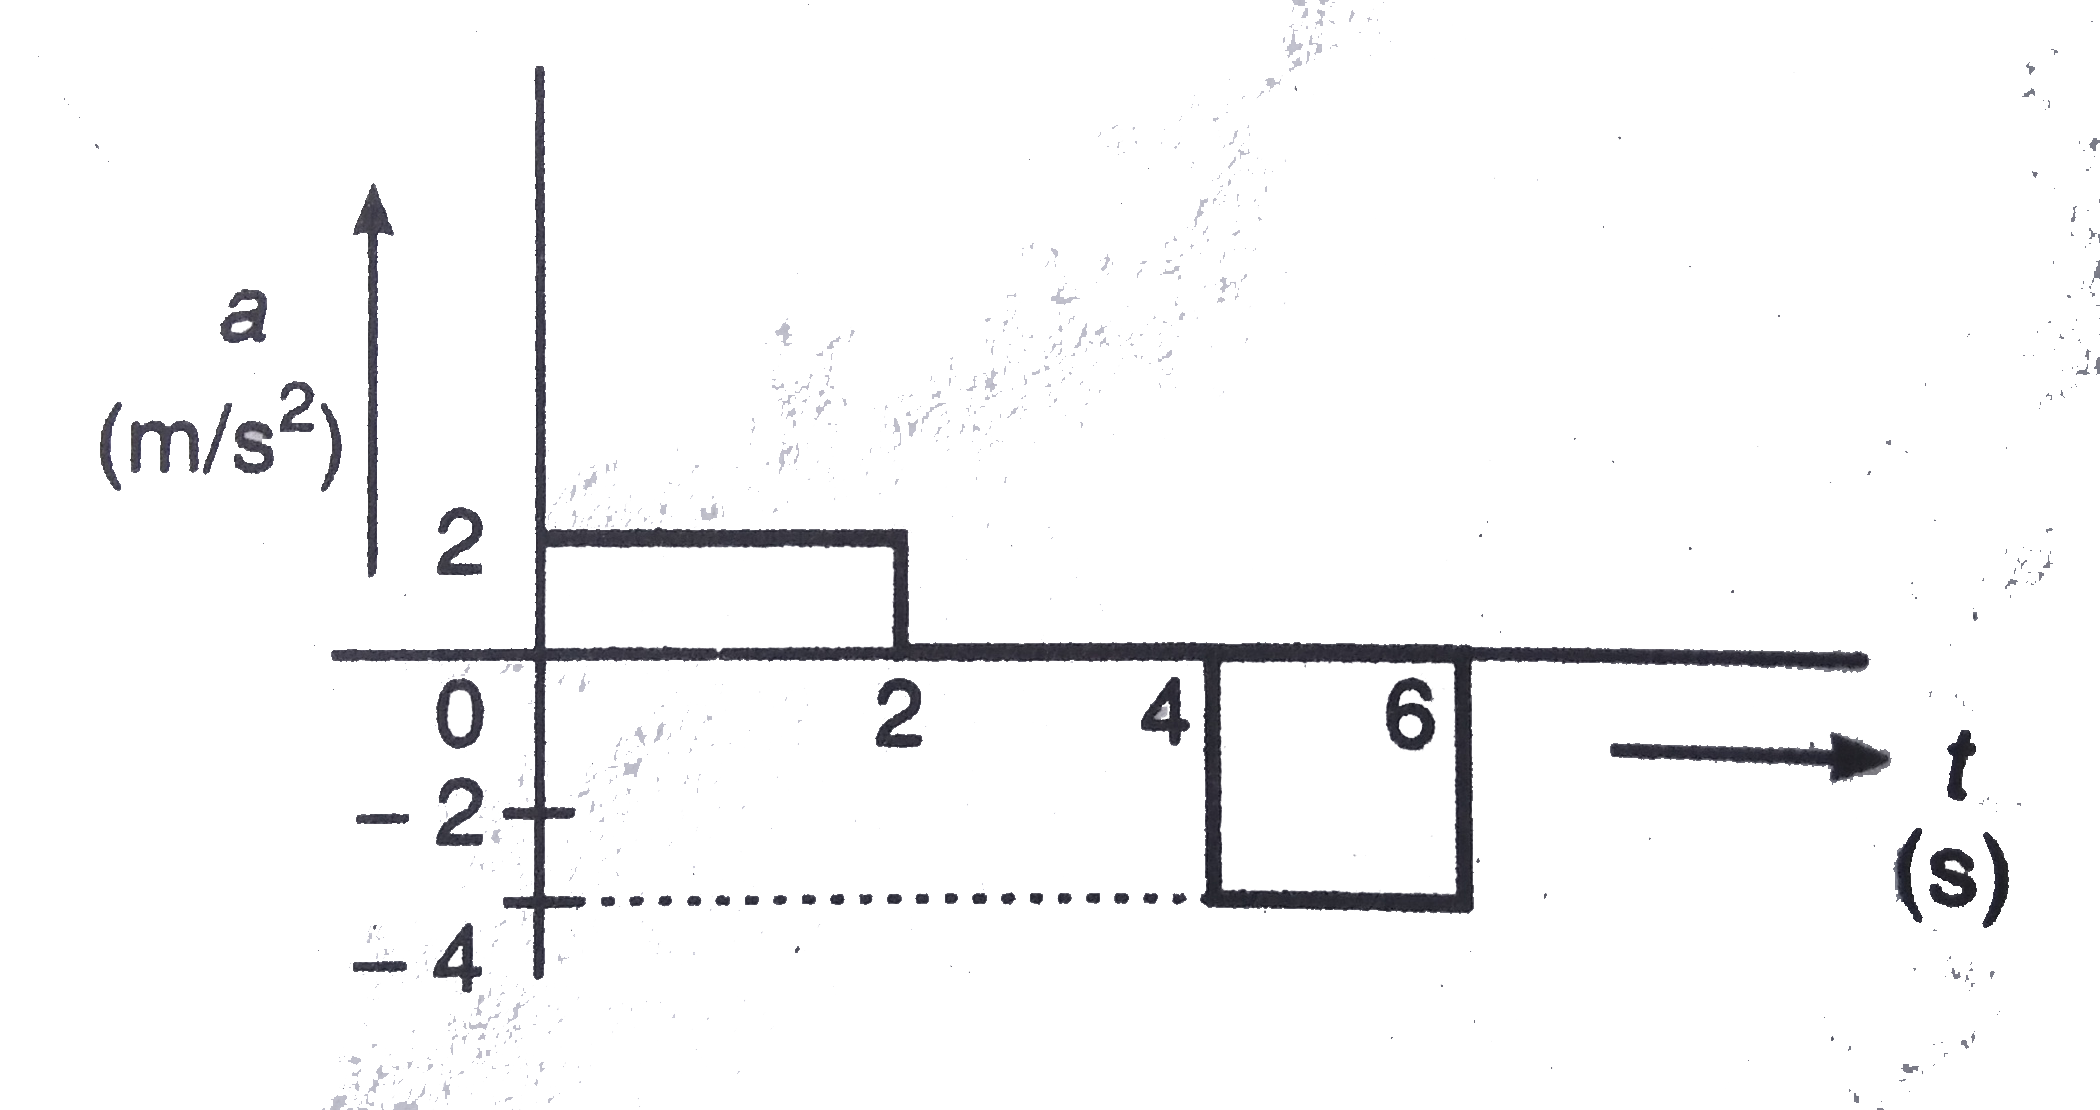
View SolutionThe acceleration versus time graph of a particle moving along a straight line is shown in the figure. Draw the respective velocity-time graph Given v=0 at t=0.
View SolutionA particle starts motion from rest and moves along a straight line. Its acceleration-time graph is shown. Find out speed of particle at t=2s and at t=3s.
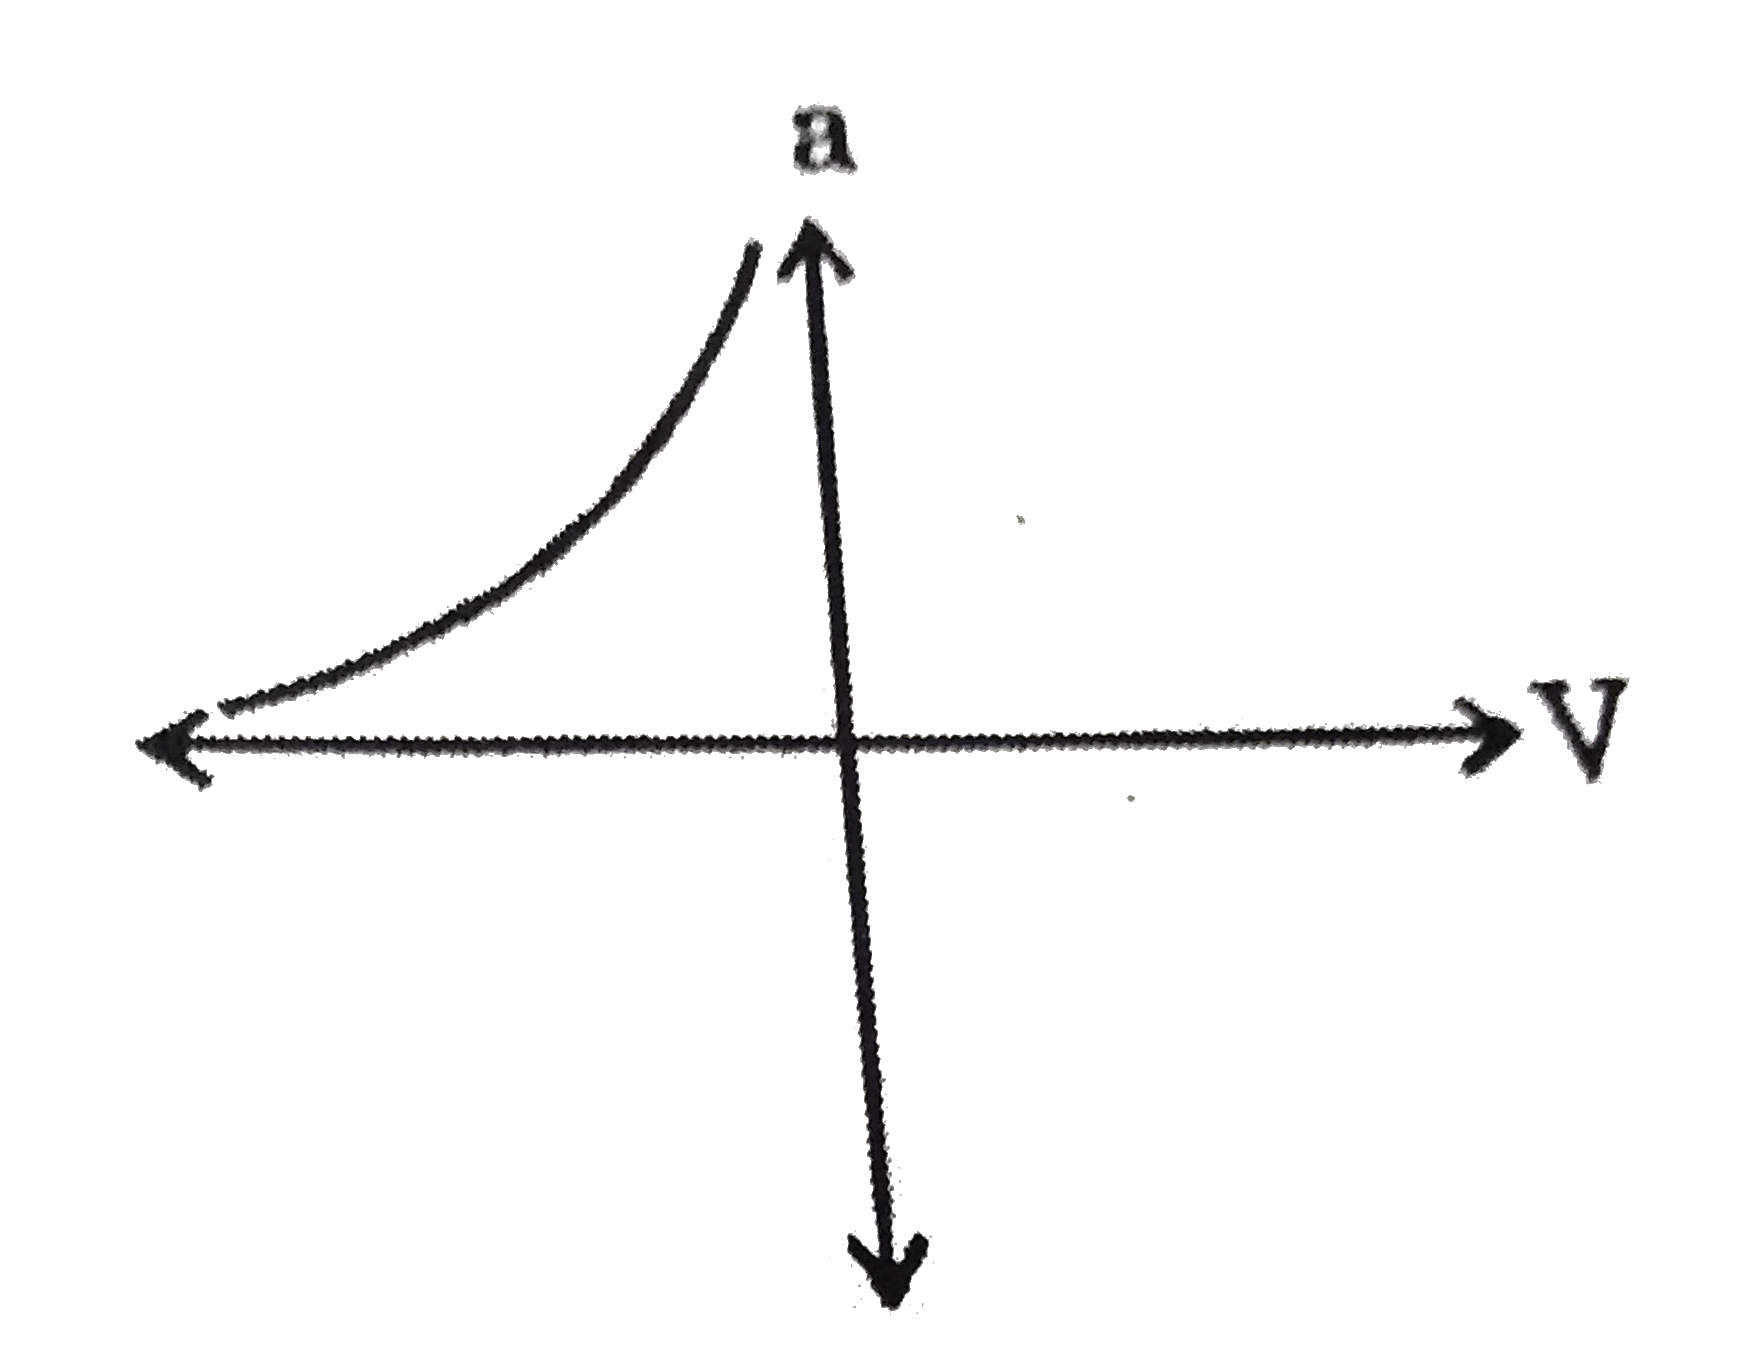
View SolutionA particle moves in straight line. Acceleration of particle changes with velocity as showns in graph:
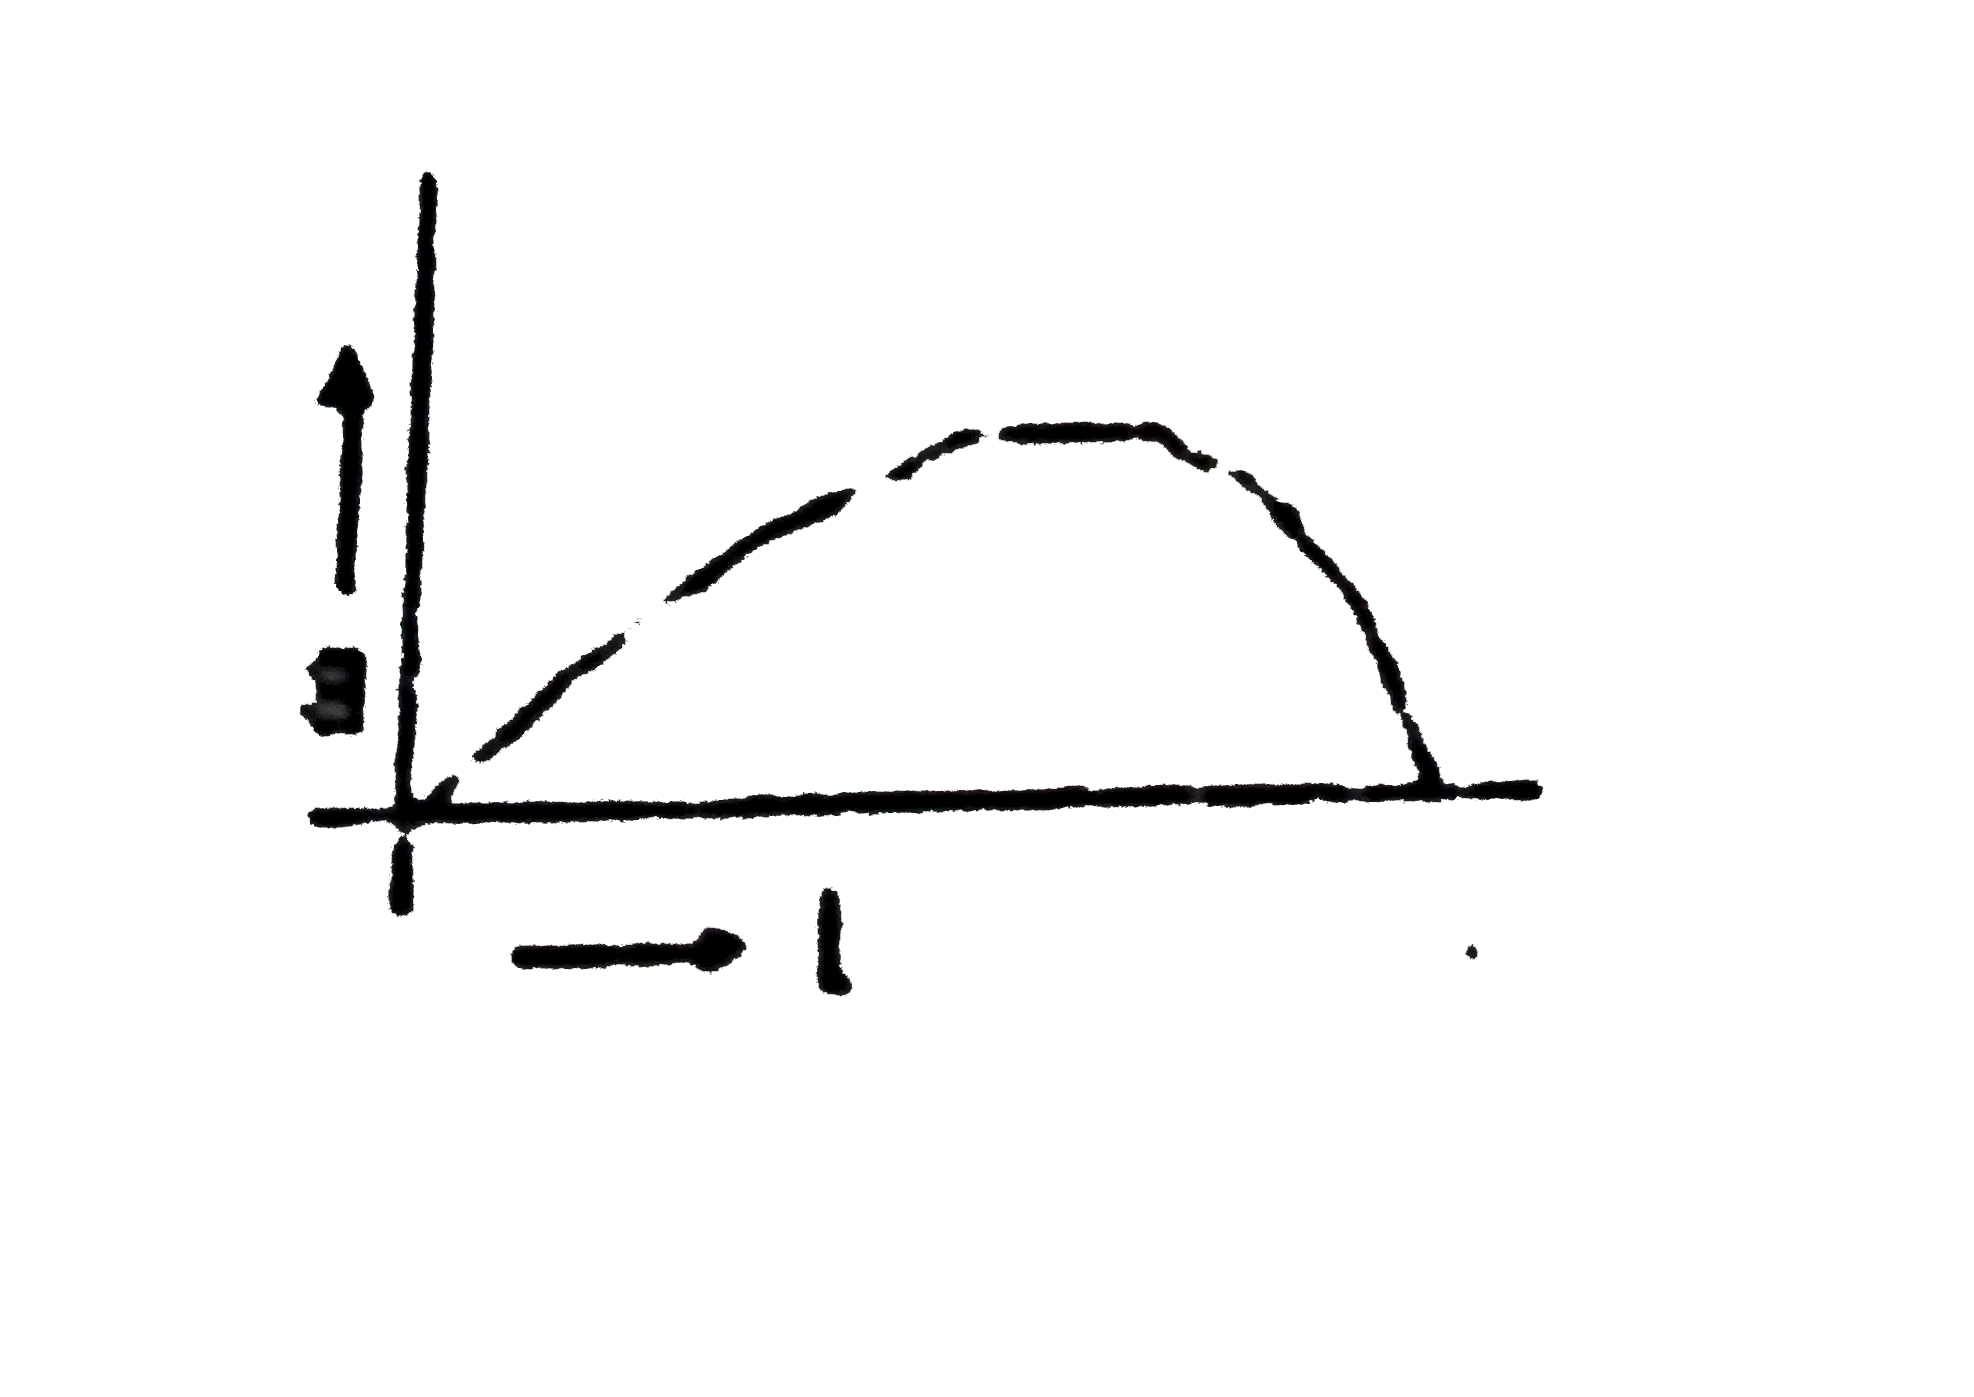
View SolutionA particle is moving in a straight line whose acceleration versus time graph is given. Assume that initial velocity is in the direction of acceleration. Then
which of the statement is correct between time t=0 to t=t0.
 .
.
View SolutionA particle is moving in a straight line. Particle was initially at rest. Acceleration versus time graph is shown in figure. Acceleration of particle is given by a=3sinπt in m/s2. The time (in s) when the particle comes to rest is

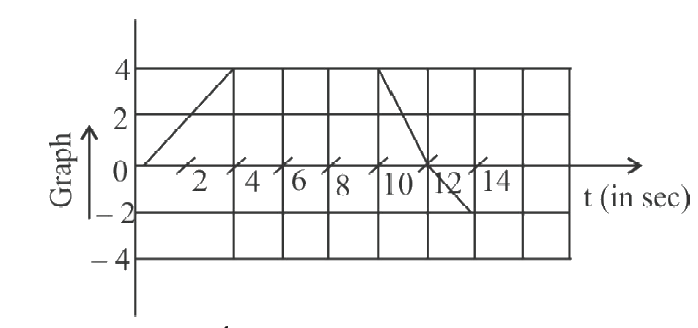
View SolutionA graph of acceleration versus time of a particle starting from rest at t=0 is as shown in figure. The speed of the particle at t=14s is
View Solution
