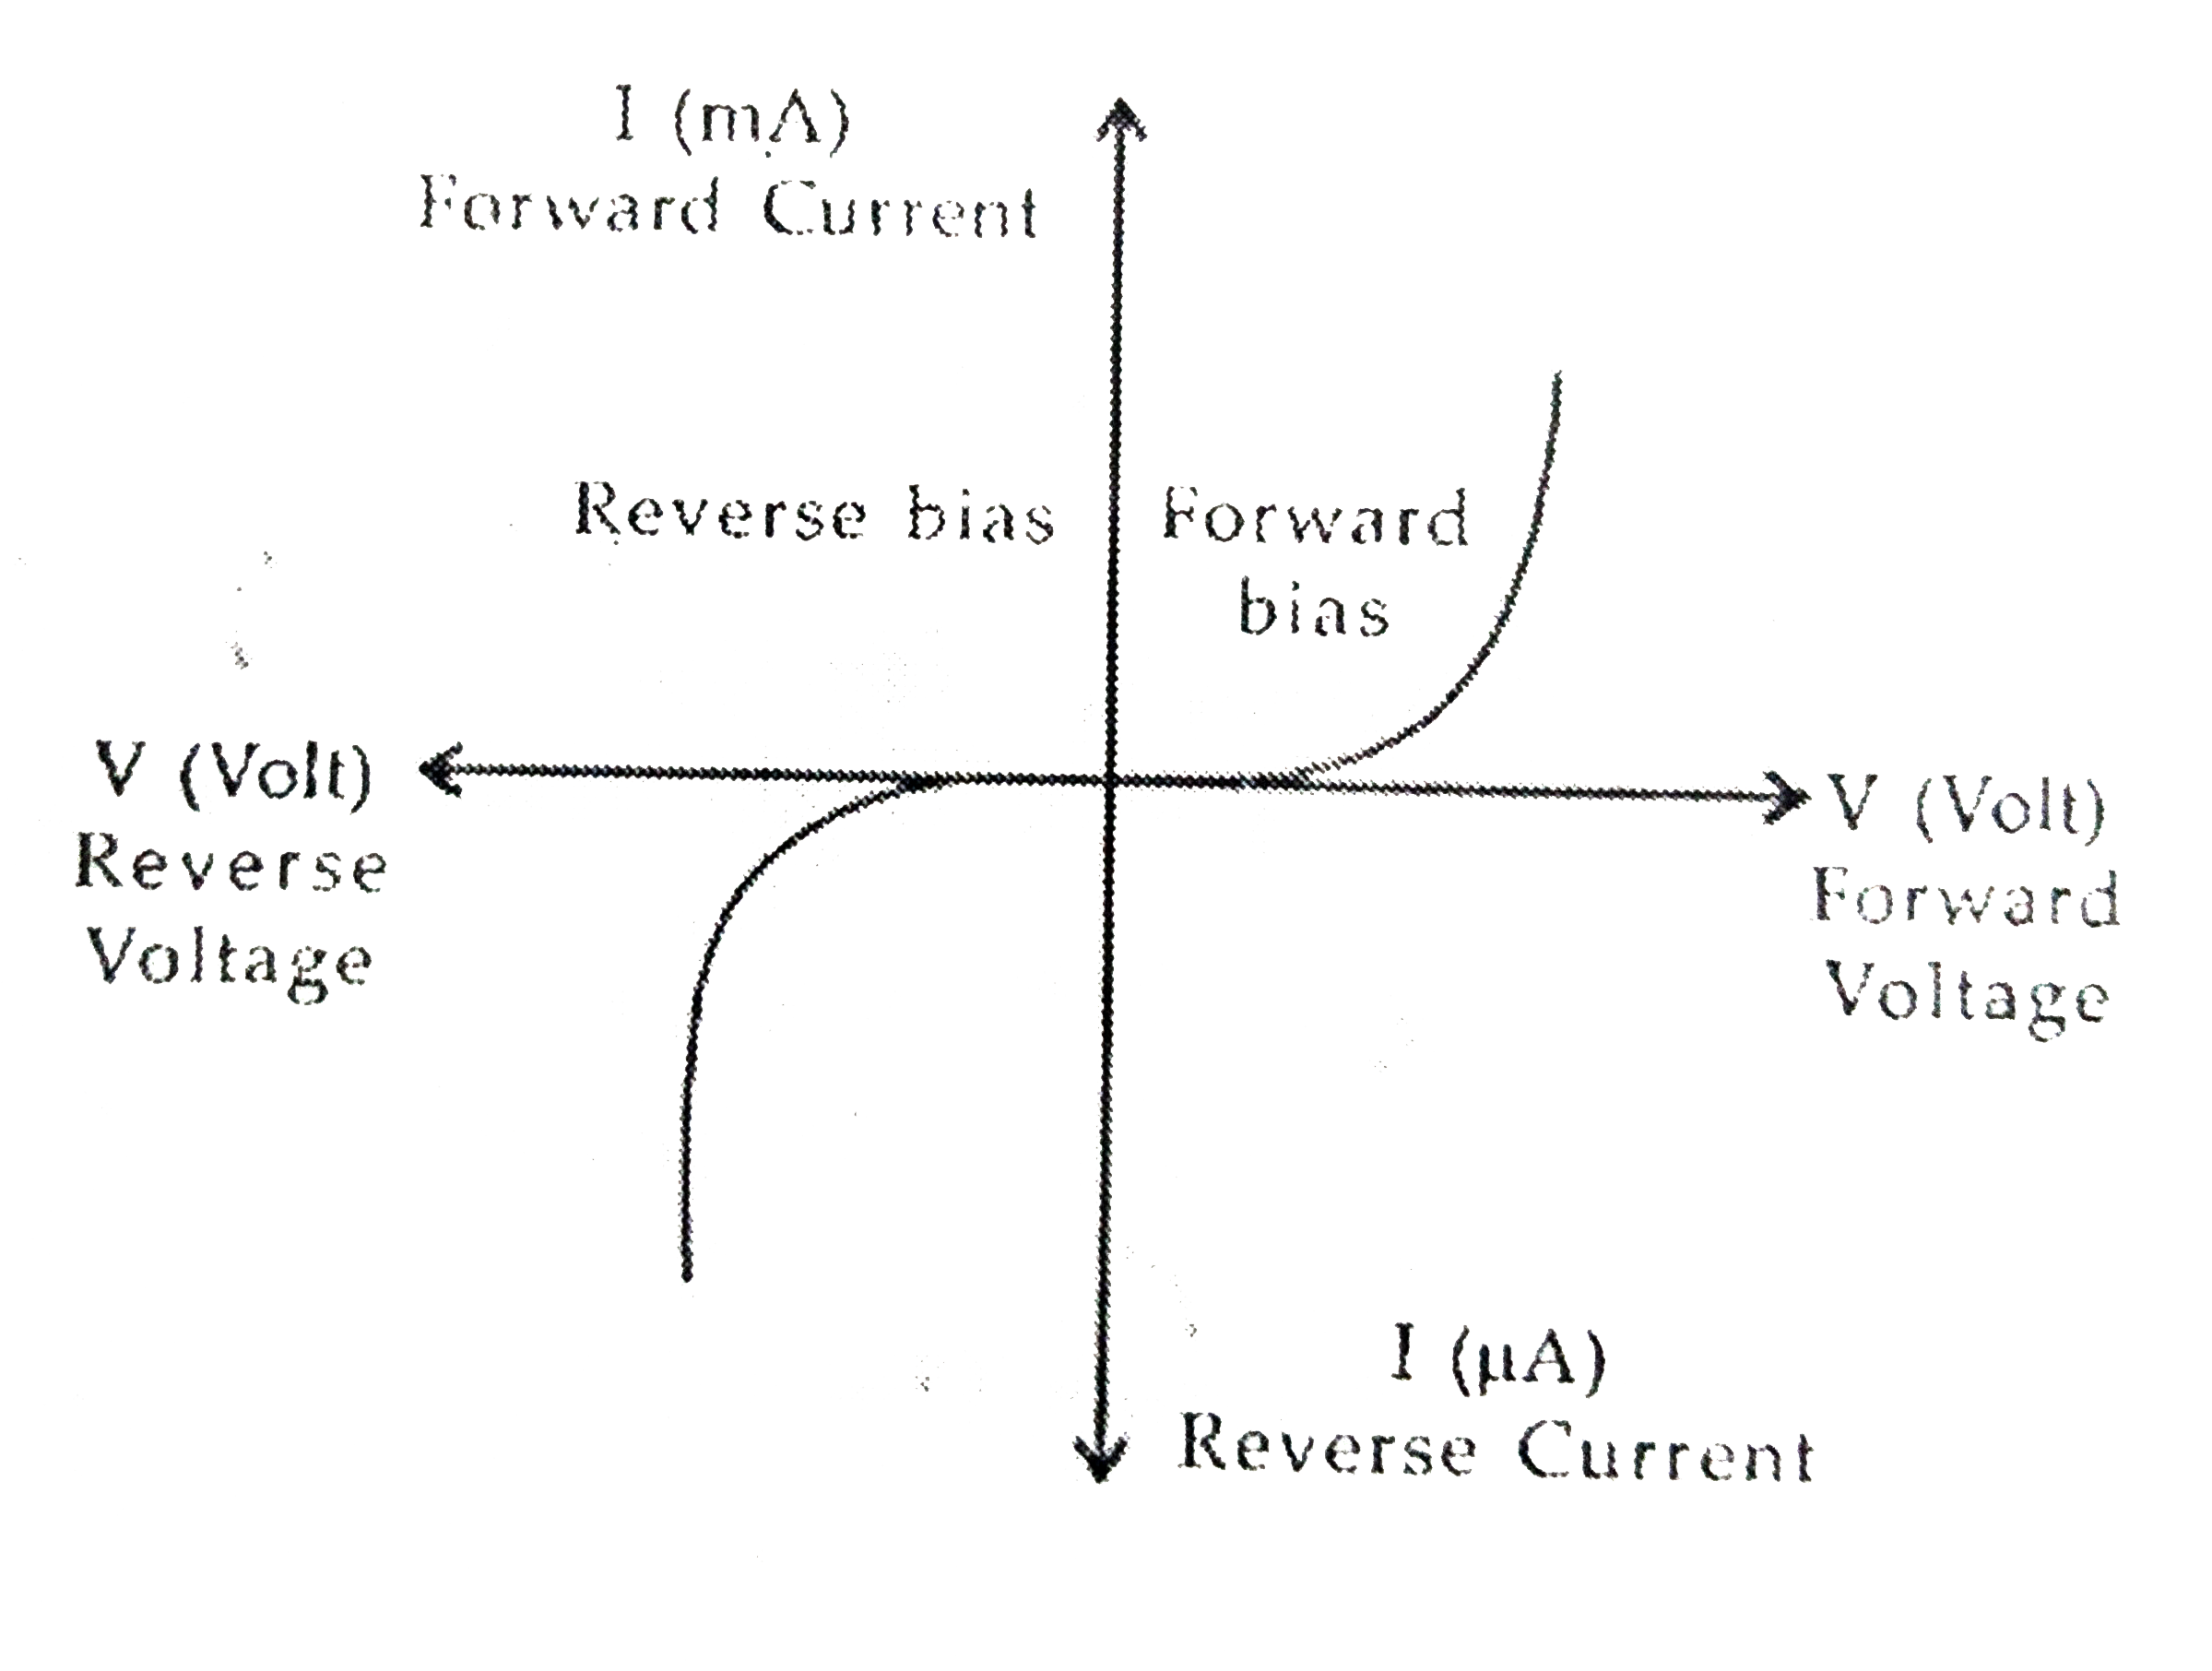
Plot a graph showing variation of current versus voltage for the material Ga.
Current - Voltage characteristics graph for GaAs:

Topper's Solved these Questions
- BOOK - XII BOARD PREVIOUS YEAR PAPER ENGLISHCHAPTER - XII BOARDSEXERCISE - section A2videos
XII BOARDS
- BOOK - XII BOARD PREVIOUS YEAR PAPER ENGLISHCHAPTER - XII BOARDSEXERCISE - section B4videos
XII BOARDS
- BOOK - XII BOARD PREVIOUS YEAR PAPER ENGLISHCHAPTER - XII BOARDSEXERCISE - [SET - II DELHI BOARD]5videos
XII BOARDS
- BOOK - XII BOARD PREVIOUS YEAR PAPER ENGLISHCHAPTER - SAMPLE PAPER 2019EXERCISE - SECTION D6videos
SAMPLE PAPER 2019
Similar Questions
(a) Draw graph showing the variation of current versus voltage in an electroyte when an external resistance is also connceted.
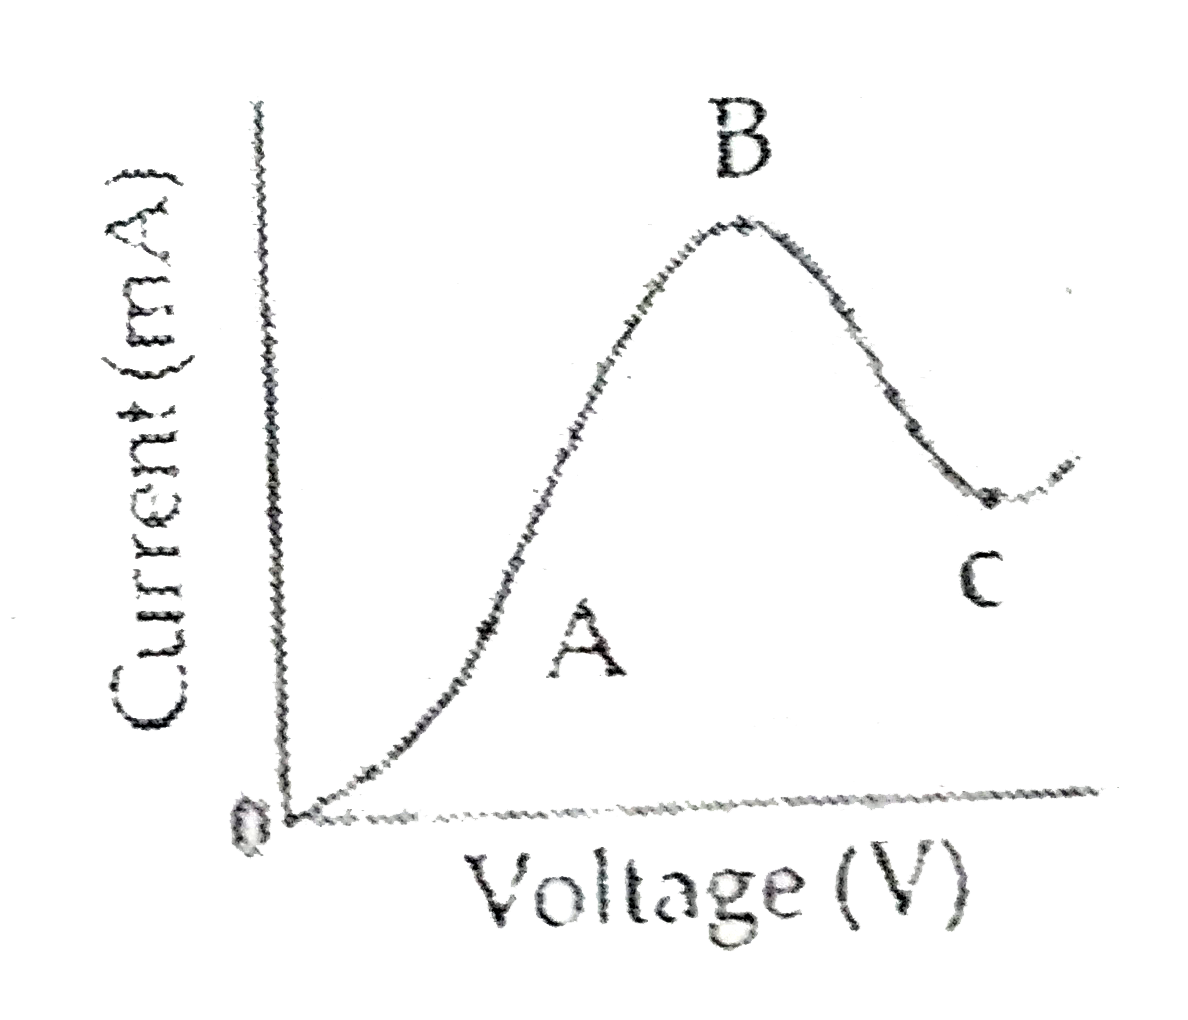
(b) (i) The graph between resistance (R ) and temperature (T) for Hg is shown in the figure (a). Explain the behaviour of Hg near 4k.
(ii) In which region of the graph shown in the figure (b) is the resistance negative and why?
 View Solution
A cell of emf ε and internal resistance r is connected across a variable resistor R. Plot a graph showing variation of terminal voltage V of the cell versus the current I. Using the plot, show how the emf of the cell and its internal resistance can be determined.
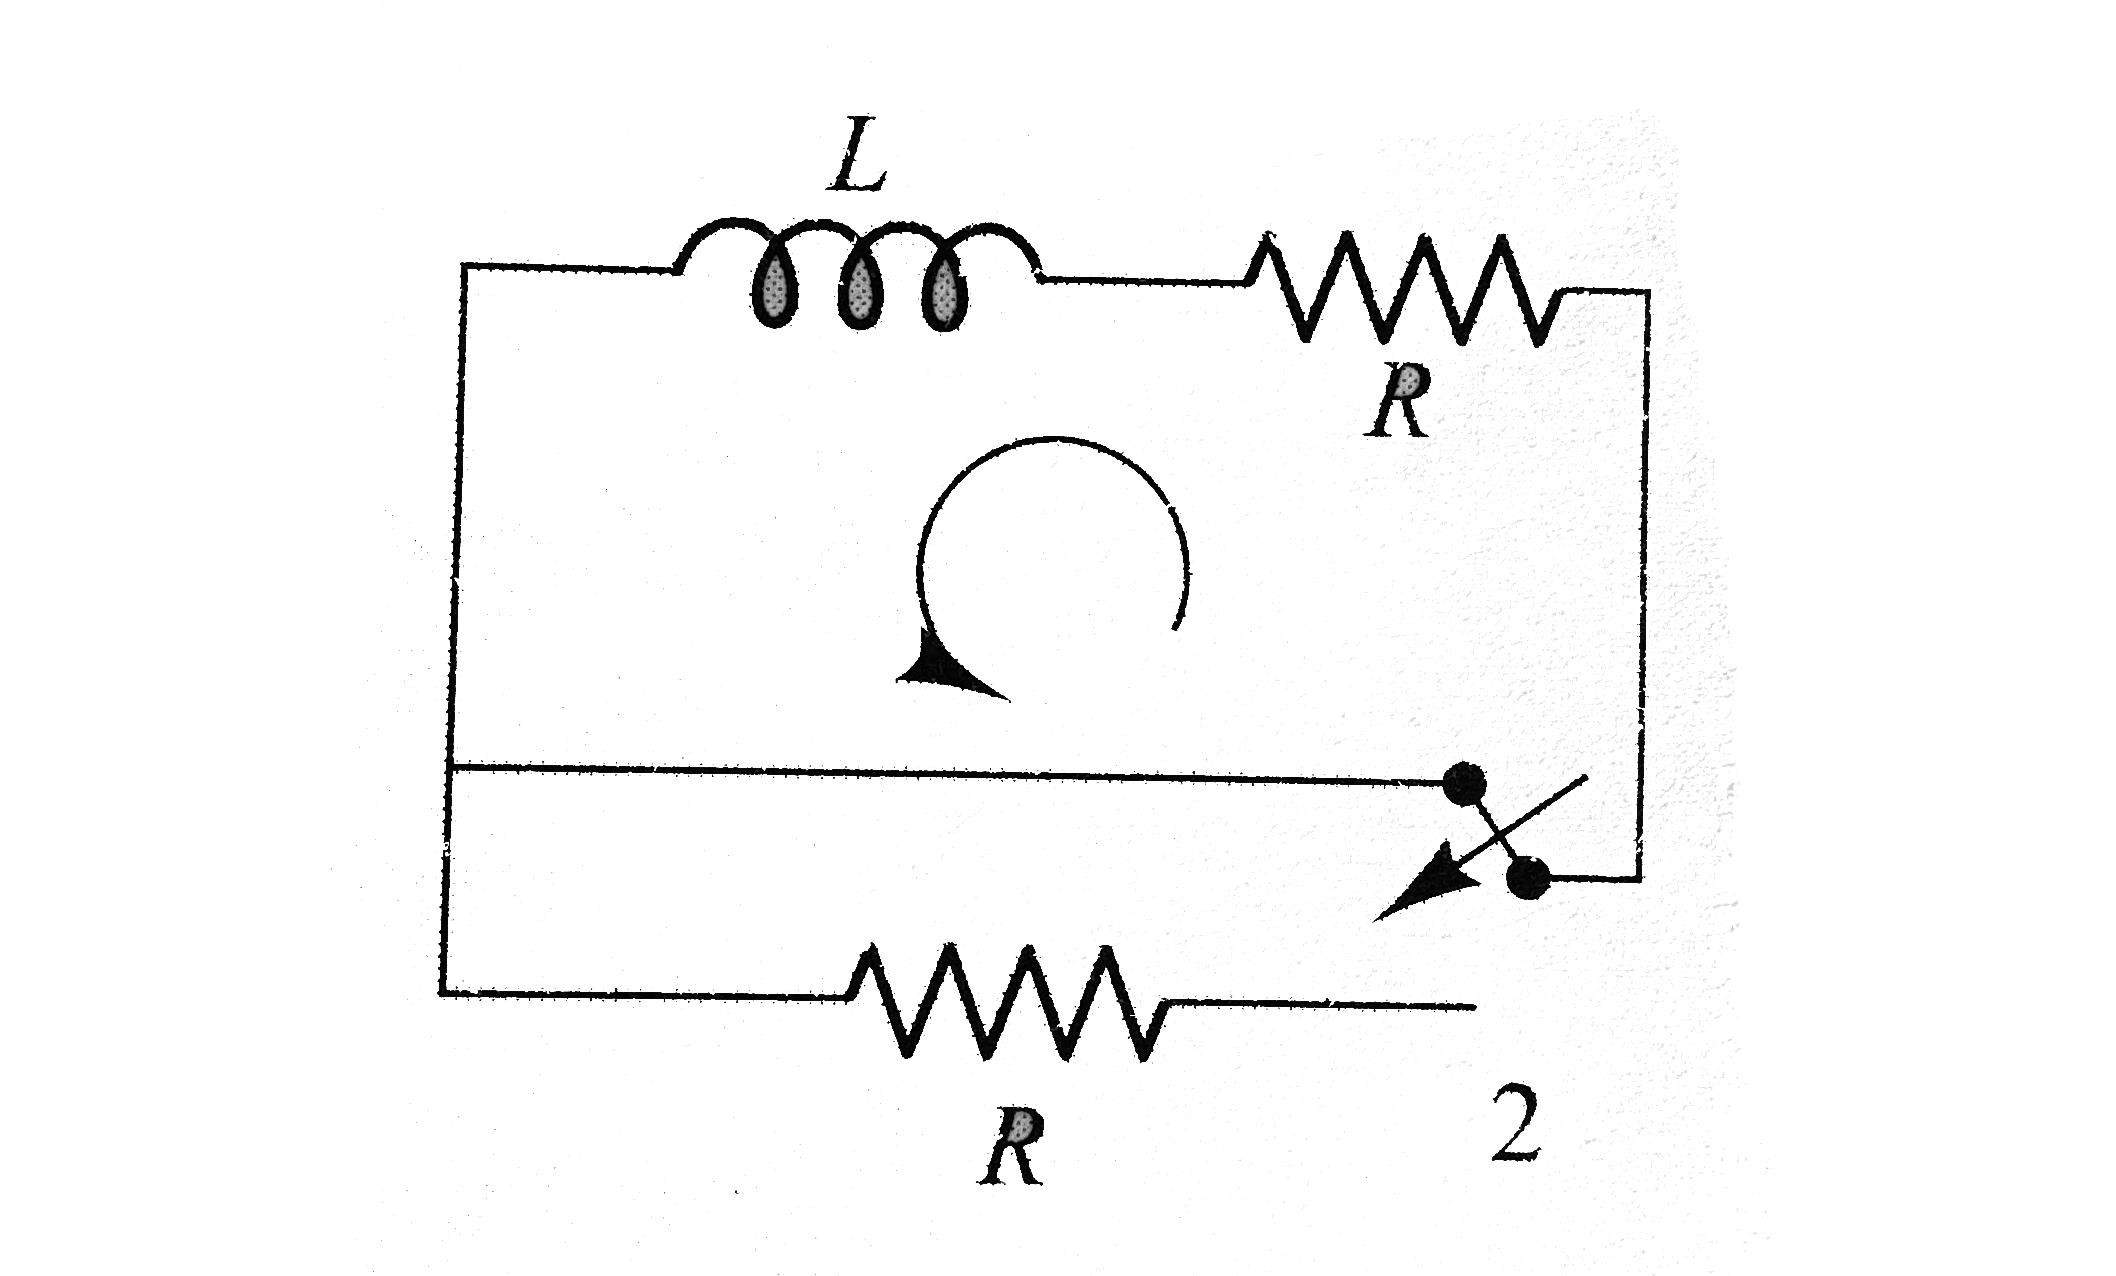
View SolutionIn the circuit shows in Fig. the initail current through the inductor at t=0 is I0. After a time t=L/R, the switch is quickly shifted to position 2.
a. Plot a graph showing the variation of current with time.
b. Calculate the value of current in the inductor at t=32LR.
 View Solution
Define resistivity of a conductor. Plot a graph showing the variation of resistivity with temperature for a metallic conductor. How does one explain such a behaviour, using the mathematical expression of the resistivity of a material
View Solution(a) Describe a simple experiment (or activity) to show that the polarity of emf induced in a coil is always such that it tends to produce a current which opposes the change of magnetic flux that produces it.
(b) The current flowing through an inductor of self inductance L is continuously increasing. Plot a graph showing the variation of
(i) Magnetic flux versus the current
(ii) Induced emf versus dI/Dt
(iii) Magnetic potential energy stored versus the current.View SolutionDarw graphs showing variation of photoelctric current with applied voltage for two incident radiations of equal frequecny and different intensities. Mark the graph for the radiaiton of higher intensity.
View SolutionA graph showing variation of osmotic pressure (π) versus molar concentration 'C' of an aqueous solution at temperature T is given below

The slope of the line representsView SolutionDefine refractive index of a transparent medium. A ray of light passes through a triangular prism. Plot a graph showing the variation of angle of deviation with the angle of incidence.
View SolutionThe graph shown in the figure represents a plot of current versus voltage for a given semi-conductor. Identify the region, if any, over which the semicondutor has a negative resistance.
 View Solution
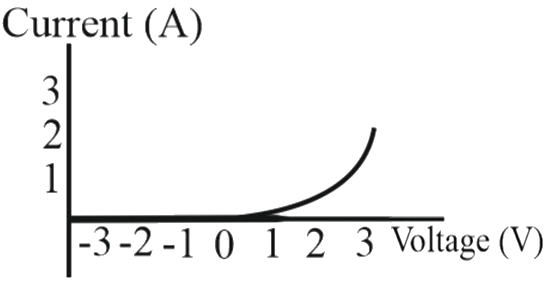
Shown below is a graph of current versus applied voltage for a diode . Approximately , what is the resistance of the diode for an applied voltage of – 1 V ?
 View Solution

