If the potential difference applied across a variable resistor is constant, draw a graph between the current in the resistor and the resistance.
To solve the problem of drawing a graph between the current in a variable resistor and its resistance when a constant potential difference is applied, we can follow these steps:
Step 1: Understand Ohm's Law
Ohm's Law states that the relationship between voltage (V), current (I), and resistance (R) is given by the equation:
V=I×R
where V is the potential difference, I is the current, and R is the resistance.
Hint: Remember that Ohm's Law is fundamental for understanding the relationship between voltage, current, and resistance.
Step 2: Set Up the Conditions
In this problem, we are given that the potential difference (V) across the variable resistor is constant. This means that as we change the resistance (R), the current (I) will change accordingly.
Hint: Keep in mind that since V is constant, any change in R will directly affect I.
Step 3: Rearrange the Equation
From Ohm's Law, we can rearrange the equation to express current (I) in terms of resistance (R):
I=VR
This shows that current is inversely proportional to resistance when voltage is constant.
Hint: Inverse relationships indicate that as one quantity increases, the other decreases.
Step 4: Analyze the Relationship
Since I is inversely proportional to R, we can conclude:
- If resistance (R) increases, current (I) decreases.
- If resistance (R) decreases, current (I) increases.
Hint: Think about how changing the resistance affects the flow of current in the circuit.
Step 5: Draw the Graph
To graph this relationship:
- Place current (I) on the x-axis and resistance (R) on the y-axis.
- The graph will be a hyperbola, indicating that as resistance increases, current decreases.
The graph will look like this:
- As R approaches zero, I approaches infinity (theoretically).
- As R increases, I approaches zero.
Hint: Remember that the shape of the graph reflects the inverse relationship between current and resistance.
Step 6: Label the Graph
Make sure to label the axes:
- X-axis: Current (I)
- Y-axis: Resistance (R)
Hint: Clear labeling helps in understanding the graph better.
Conclusion
The graph between the current in the resistor and the resistance, when a constant potential difference is applied, is a rectangular hyperbola, illustrating the inverse relationship between current and resistance.
---
Ohm's Law states that the relationship between voltage (V), current (I), and resistance (R) is given by the equation:
V=I×R
where V is the potential difference, I is the current, and R is the resistance.
In this problem, we are given that the potential difference (V) across the variable resistor is constant. This means that as we change the resistance (R), the current (I) will change accordingly.
From Ohm's Law, we can rearrange the equation to express current (I) in terms of resistance (R):
I=VR
This shows that current is inversely proportional to resistance when voltage is constant.
Since I is inversely proportional to R, we can conclude:
- If resistance (R) increases, current (I) decreases.
- If resistance (R) decreases, current (I) increases.
To graph this relationship:
- Place current (I) on the x-axis and resistance (R) on the y-axis.
- The graph will be a hyperbola, indicating that as resistance increases, current decreases.
- As R approaches zero, I approaches infinity (theoretically).
- As R increases, I approaches zero.
Make sure to label the axes:
- X-axis: Current (I)
- Y-axis: Resistance (R)
The graph between the current in the resistor and the resistance, when a constant potential difference is applied, is a rectangular hyperbola, illustrating the inverse relationship between current and resistance.
Similar Questions
When a potential difference is applied across, the current passing through
View SolutionThe values of current (I) flowng through a given resistor of resistance (R ), for the corresponding values of potential difference (V) across the resistor are as given below :

Plot a graph between current (I) and potential difference (V) and determine the resistance (R ) of the resistor.
View SolutionWhile stud dying the dependence of potential difference (V) across a resistor on the current
(I) passing through it, in order to determine the resistance of the resistor, a student took
5 readings for different values of current and plotted a graph between V and I. He got a
straight line graph passing through the origin. What does the straight line signify? Write
the method of determining resistance of the resistor using this graph.
View SolutionA cell of e.m.f. 'E' and internal resistance 'r' is connected across a variable resistor 'R'. Plot a graph showing the variation of terminal potential 'V' with resistance R.
Predict from the graph the condition under which 'V' becomes equal of 'E'

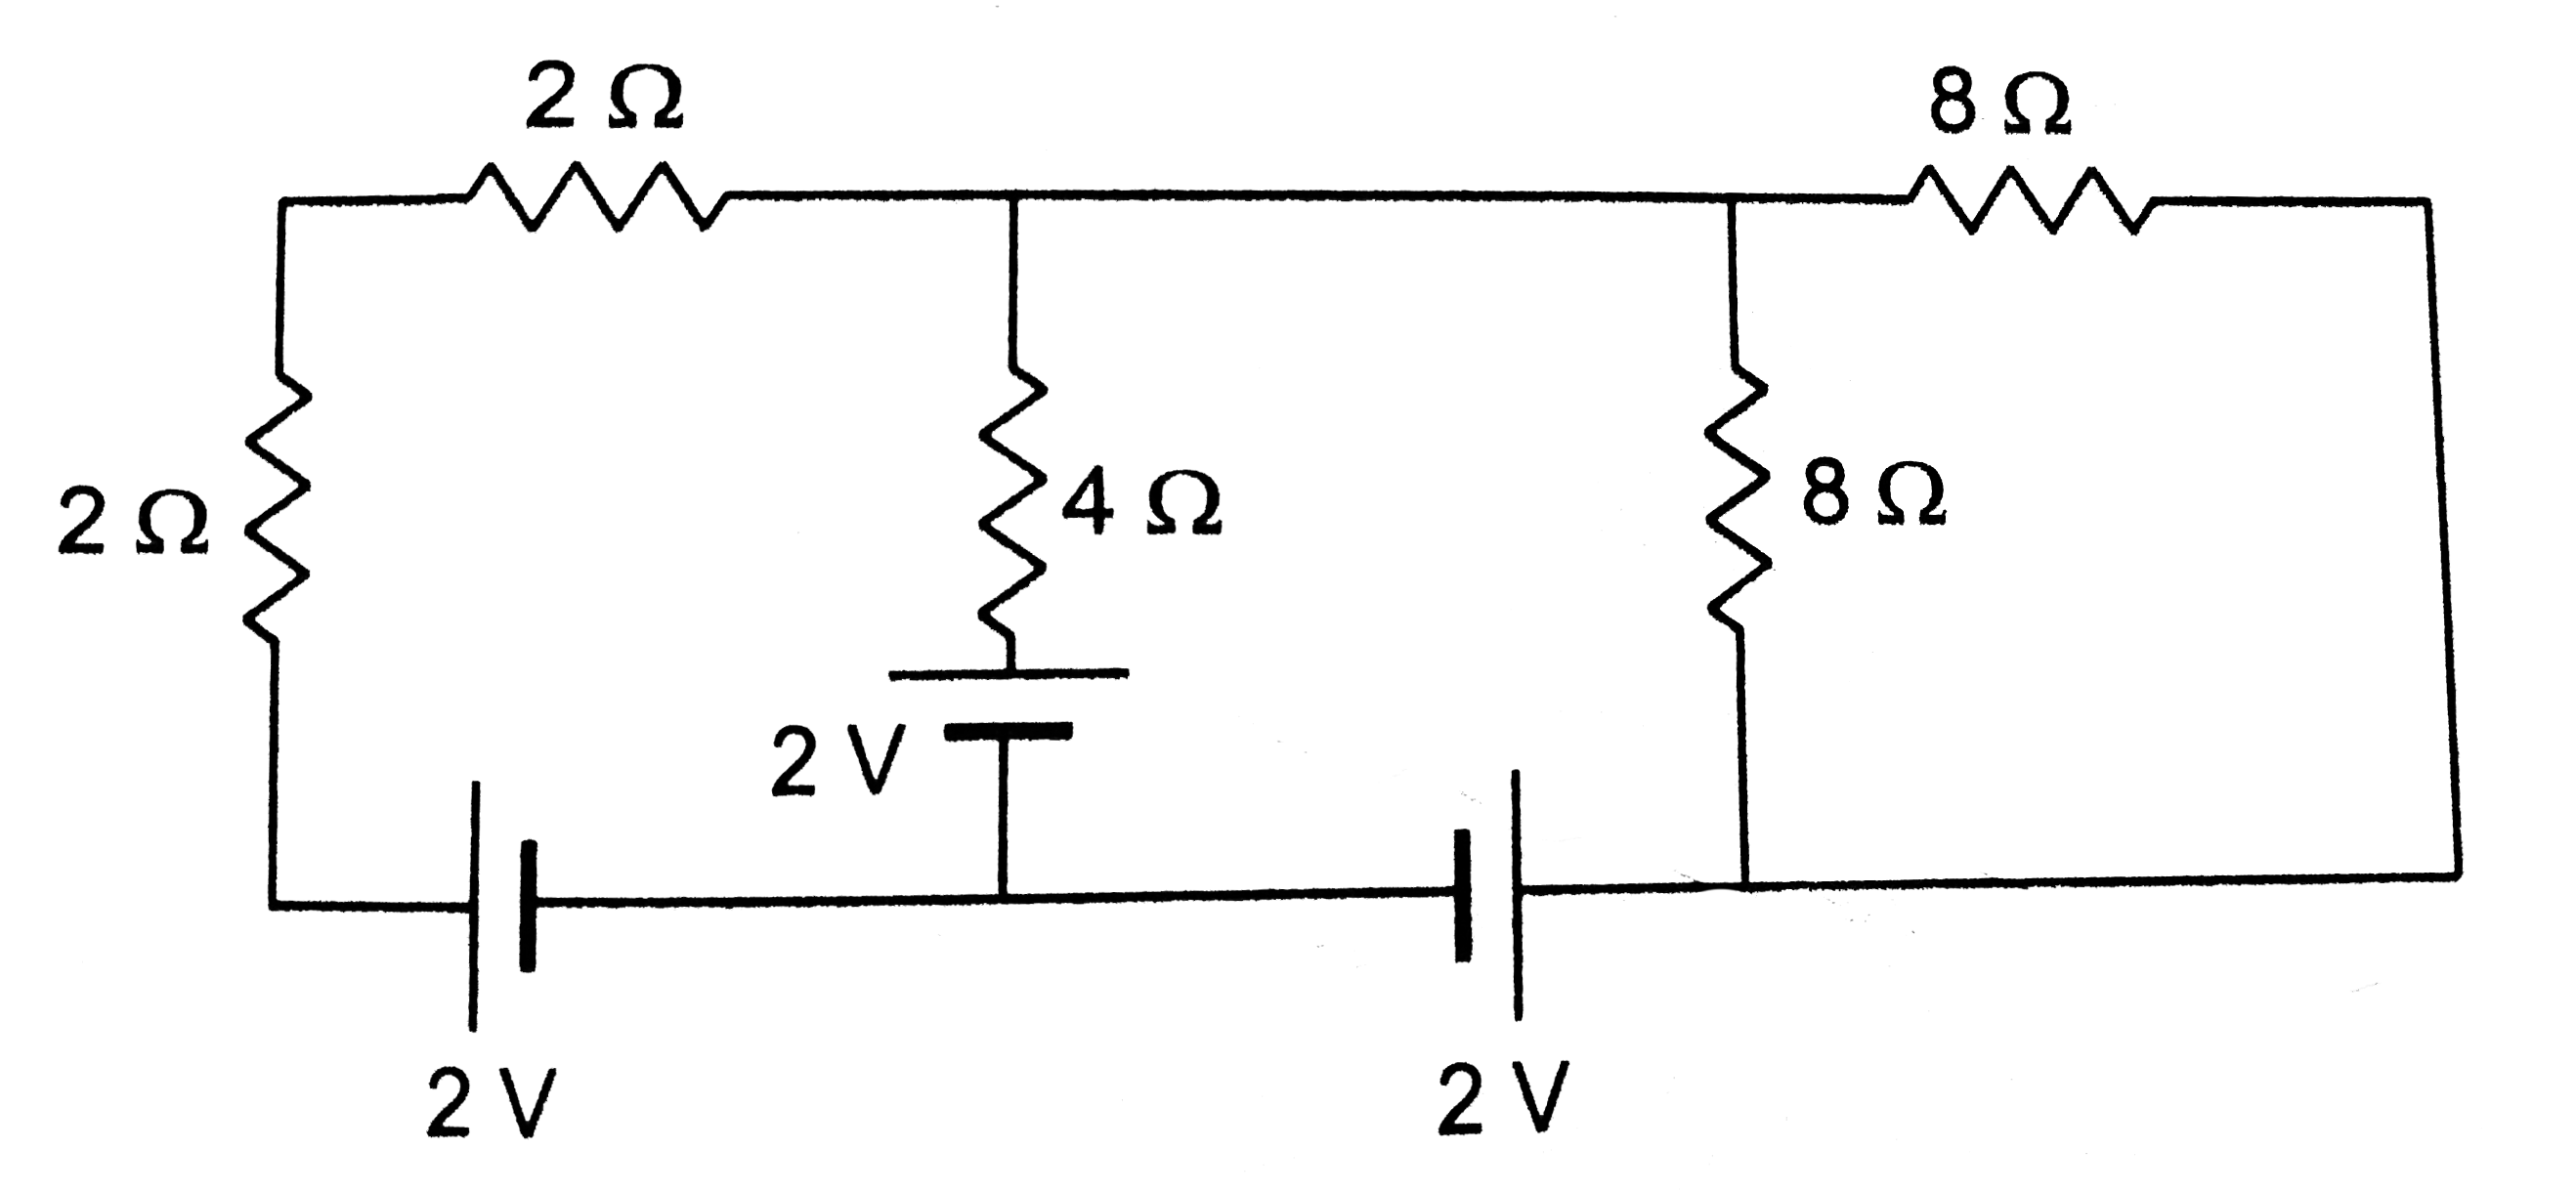
View Solutionfind the currents in the different resistor shown in figure.

View SolutionDraw a circuit diagram of an electric circuit containing a cell, a key, an ammeter, a resistance of 2Ω in series with a combination of two resistors (4Ω each) in parallel and a voltmeter across the parallel combination. Will the potential difference across the 2Ω resistor be the same as that across the parallel combination of 4Ω resistors ? Give reason.
View SolutionA constant potential difference is applied across a resistance. Consider variation of resistance with temperature. Which graph represents best the variation of power produced in resistance versus resistance?
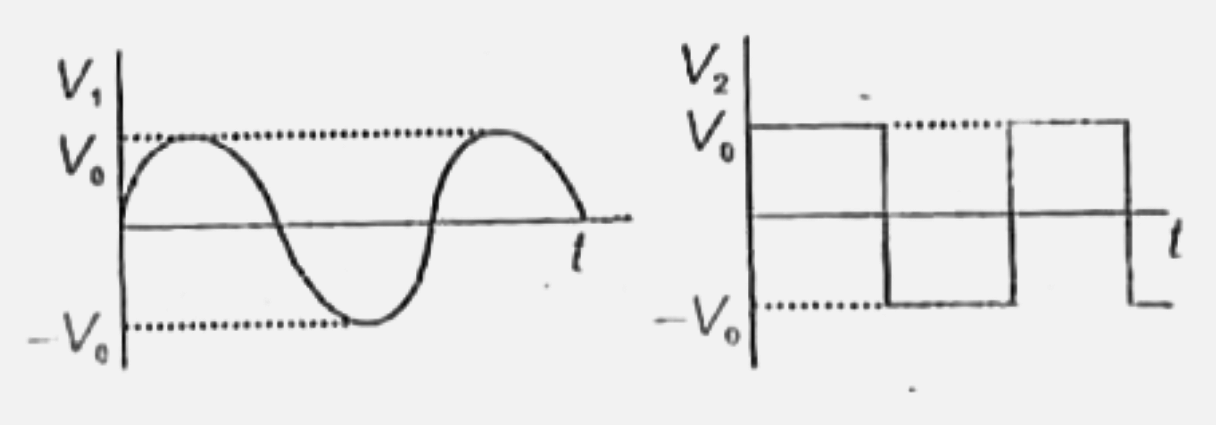
View SolutionThe sinusoidal potential difference V shown in figure applied across a resistor R produces heat at a rate W. What is the rate of heat disspation when the squre wave potential diffrence V2 as shown in figure is applied across the resistor?

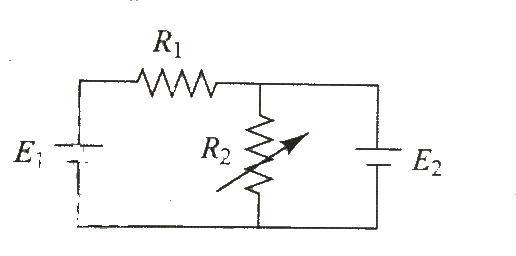
View SolutionStatement I : In the circuit in Fig.7.46, both cells are ideal and of fixed emf, the resistor R1 has fixed resistance and the resistance of resistor R2 can be varied ( but R2 is always non zero). Then the electric power delivered to the resistor of resistance R1 is independent of the value of resistance R2.
Statement II: If potential difference across a fixed resistance is unchanged , the poweer delivered to the resistor remains constant.

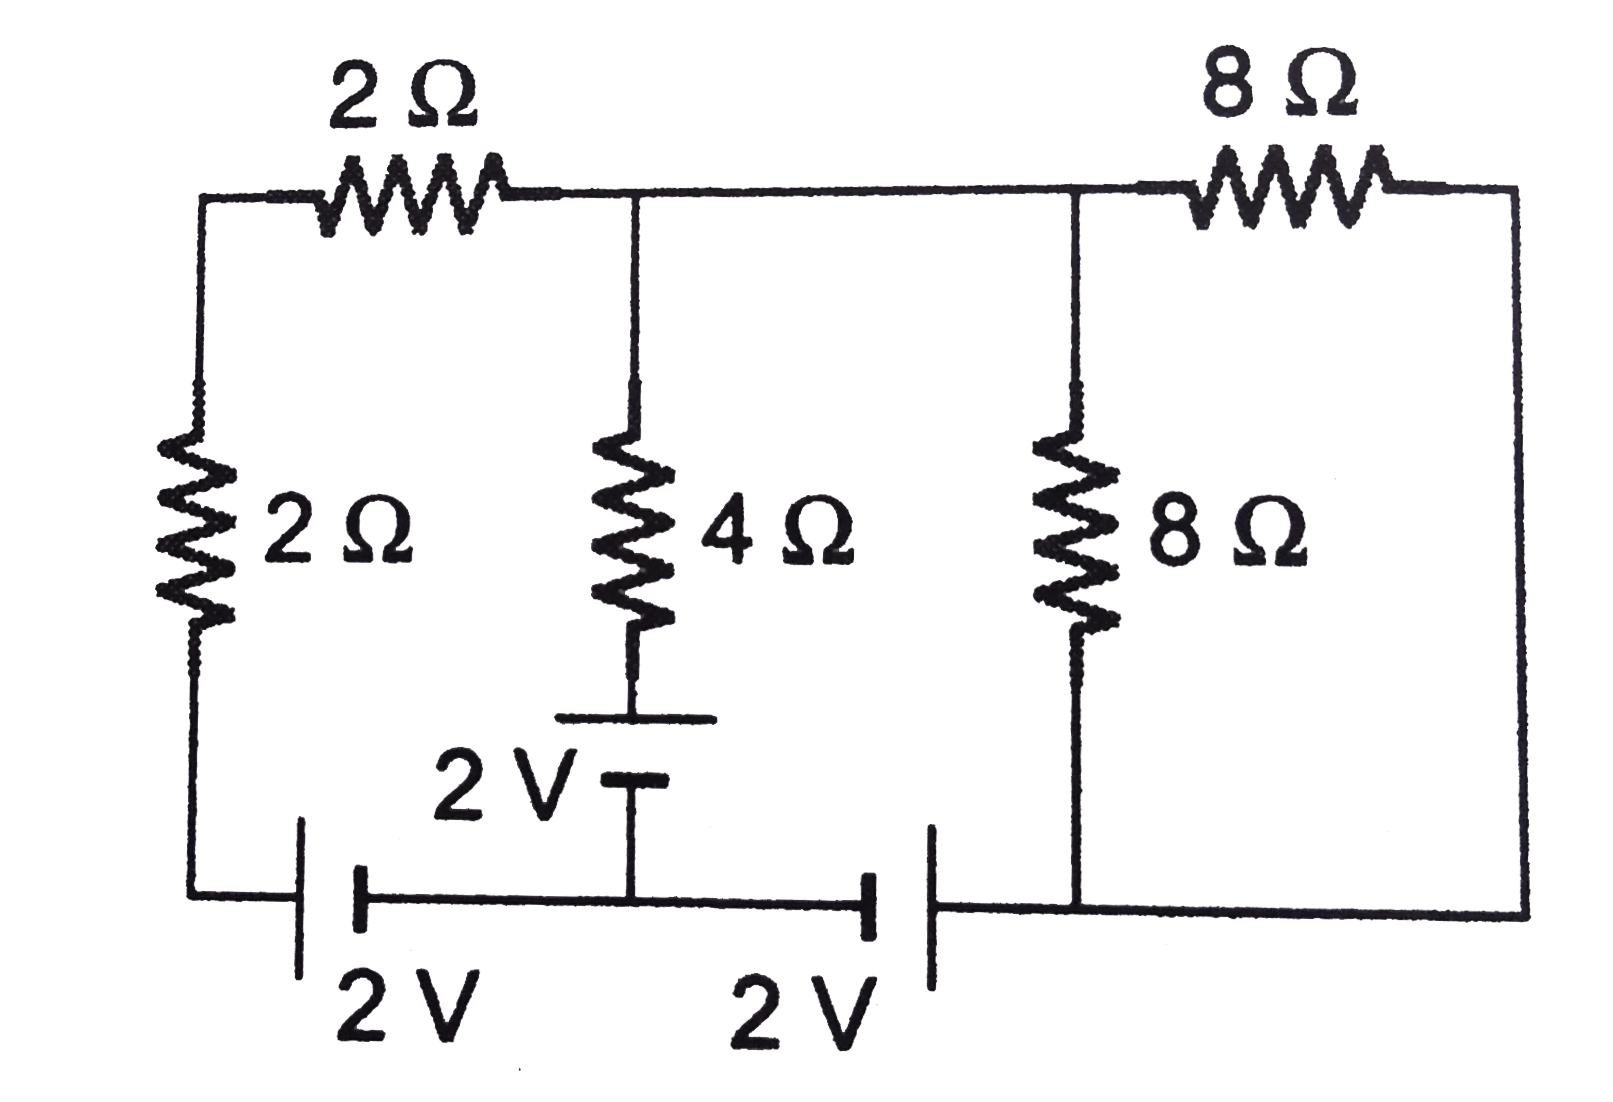
View SolutionFind the currents in different resistors shown in figure

View Solution
