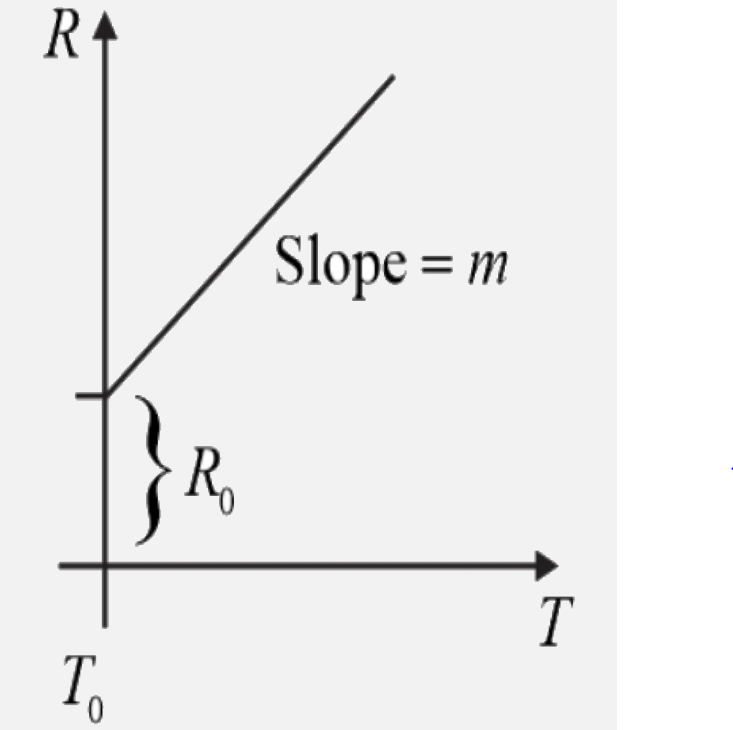
A constant potential difference is applied across a resistance. Consider variation of resistance with temperature. Which graph represents best the variation of power produced in resistance versus resistance?


The correct Answer is:B
To solve the problem, we need to analyze the relationship between power (P) and resistance (R) when a constant potential difference (V) is applied across the resistance.
1. Understand the Power Formula:
The power (P) dissipated in a resistor when a constant voltage (V) is applied can be expressed using the formula:
P=V2R
Here, V is constant.
2. Identify the Relationship:
From the formula, we can see that power (P) is inversely proportional to resistance (R). This means:
P∝1R
As resistance increases, power decreases, and as resistance decreases, power increases.
3. Graphical Representation:
The relationship P∝1R indicates that if we were to plot power (P) on the y-axis and resistance (R) on the x-axis, the graph would be a hyperbola. This is because an inverse relationship typically results in a hyperbolic curve.
4. Analyze the Graphs:
We need to look at the options provided for the graph of power versus resistance. The correct graph should show that as resistance increases, power decreases, which is characteristic of a hyperbolic graph.
5. Select the Correct Option:
Upon examining the options, we find that option B displays a hyperbolic curve, where:
- When resistance (R) is low, power (P) is high.
- When resistance (R) is high, power (P) is low.
This matches our derived relationship.
Conclusion:
The graph that best represents the variation of power produced in resistance versus resistance is option B, which shows a hyperbolic relationship.
The power (P) dissipated in a resistor when a constant voltage (V) is applied can be expressed using the formula:
P=V2R
Here, V is constant.
From the formula, we can see that power (P) is inversely proportional to resistance (R). This means:
P∝1R
As resistance increases, power decreases, and as resistance decreases, power increases.
The relationship P∝1R indicates that if we were to plot power (P) on the y-axis and resistance (R) on the x-axis, the graph would be a hyperbola. This is because an inverse relationship typically results in a hyperbolic curve.
We need to look at the options provided for the graph of power versus resistance. The correct graph should show that as resistance increases, power decreases, which is characteristic of a hyperbolic graph.
Upon examining the options, we find that option B displays a hyperbolic curve, where:
- When resistance (R) is low, power (P) is high.
- When resistance (R) is high, power (P) is low.
This matches our derived relationship.
The graph that best represents the variation of power produced in resistance versus resistance is option B, which shows a hyperbolic relationship.
Topper's Solved these Questions
- ELECTRICAL MEASURING INSTRUMENTSBOOK - CENGAGE PHYSICS ENGLISHCHAPTER - ELECTRICAL MEASURING INSTRUMENTSEXERCISE - Multiple Correct
7 Videos
- ELECTRICAL MEASURING INSTRUMENTSBOOK - CENGAGE PHYSICS ENGLISHCHAPTER - ELECTRICAL MEASURING INSTRUMENTSEXERCISE - Assertion-Reasoning
7 Videos
- ELECTRICAL MEASURING INSTRUMENTSBOOK - CENGAGE PHYSICS ENGLISHCHAPTER - ELECTRICAL MEASURING INSTRUMENTSEXERCISE - Subjective
18 Videos
- ELECTRIC POTENTIALBOOK - CENGAGE PHYSICS ENGLISHCHAPTER - ELECTRIC POTENTIALEXERCISE - DPP 3.5
15 Videos
- ELECTROMAGNETIC INDUCTIONBOOK - CENGAGE PHYSICS ENGLISHCHAPTER - ELECTROMAGNETIC INDUCTIONEXERCISE - compression type
7 Videos
Similar Questions
Find potential difference across the resistance 300Ω in A and B.

View SolutionThe correct variation of resistance R with frequency f is given by
View SolutionIf the potential difference applied across a variable resistor is constant, draw a graph between the current in the resistor and the resistance.
View SolutionVariation of resistance of the conductor with temperature is shown . Temperature coefficient of the conductor is

View SolutionWhich graph best represent the relationship between conductivity and resistivity for a solid ?
View SolutionVariation of resistance with cell constant is given in which of these graphs?
View SolutionShow on a graph, the variation of resistivity with temperature for a typical semiconductor.
View SolutionDraw a graph showing variation of resistivity with temperature for nichrome. Which property of nichrome is used to make standard resistance coils?
View SolutionThe difference in the variation of resistance with temperature in a metal and a semiconductor arises essentially due to the difference in the
View SolutionThe difference in the variation of resistance with temperature in a metal and a semiconductor arises essentially due to the difference in the
View Solution
