Define oxygen dissociation curve. Can you suggest any reason for its sigmoidal pattern?
Step-by-Step Solution:
1. Definition of Oxygen Dissociation Curve:
- The oxygen dissociation curve is a graphical representation that illustrates the percentage saturation of hemoglobin (oxyhemoglobin) with oxygen at various partial pressures of oxygen (pO2). It shows how readily hemoglobin acquires and releases oxygen under different conditions.
2. Understanding the Sigmoidal Pattern:
- The oxygen dissociation curve exhibits a sigmoidal (S-shaped) pattern. This shape is primarily due to the cooperative binding of oxygen molecules to hemoglobin.
- When the first molecule of oxygen binds to hemoglobin, it induces a conformational change in the hemoglobin structure. This change increases the affinity of hemoglobin for the second oxygen molecule.
- As more oxygen molecules bind, the affinity for additional oxygen increases even further. This results in a steep rise in the curve as the hemoglobin becomes more saturated with oxygen at higher pO2 levels.
3. Key Factors Contributing to the Sigmoidal Shape:
- Cooperative Binding: The binding of each oxygen molecule enhances the binding of subsequent molecules, leading to a rapid increase in saturation.
- Conformational Changes: The structural changes in hemoglobin upon oxygen binding facilitate this cooperative effect.
- The oxygen dissociation curve is a graphical representation that illustrates the percentage saturation of hemoglobin (oxyhemoglobin) with oxygen at various partial pressures of oxygen (pO2). It shows how readily hemoglobin acquires and releases oxygen under different conditions.
- The oxygen dissociation curve exhibits a sigmoidal (S-shaped) pattern. This shape is primarily due to the cooperative binding of oxygen molecules to hemoglobin.
- When the first molecule of oxygen binds to hemoglobin, it induces a conformational change in the hemoglobin structure. This change increases the affinity of hemoglobin for the second oxygen molecule.
- As more oxygen molecules bind, the affinity for additional oxygen increases even further. This results in a steep rise in the curve as the hemoglobin becomes more saturated with oxygen at higher pO2 levels.
- Cooperative Binding: The binding of each oxygen molecule enhances the binding of subsequent molecules, leading to a rapid increase in saturation.
- Conformational Changes: The structural changes in hemoglobin upon oxygen binding facilitate this cooperative effect.
Similar Questions
Knowledge Check
The oxygen dissociation curve is
AparabolaBslopeCsigmoidDstright line.The oxygen dissociation curve will show a right shift in case of:
Ahigh PCO2Bhigh PO2Clow PCO2Dless H+ concentration
Balmer series was observed and analysed before the other series .Can you suggest a reason for such an order?
View SolutionAthletes do warming up exercise of short distance and then gradually increasing the distance. Can you assign any reason for this activity by them?
View SolutionIn which conditon oxygen dissociation curve of haemoglobin shift to right of normal curve ?
View SolutionOxygen haemoglobin dissociation curve will shift to right on decrease of
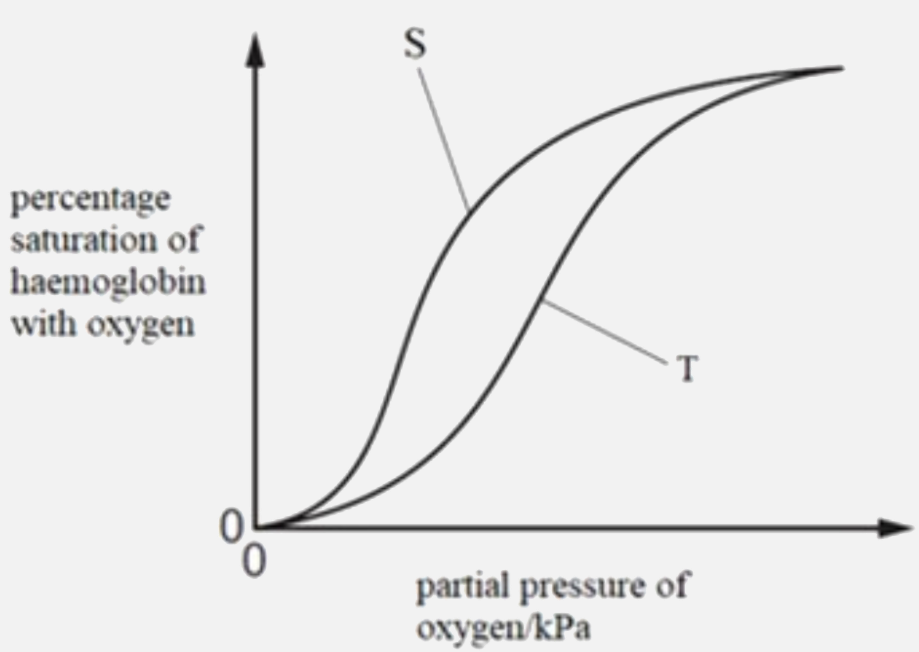
View SolutionThe graph shows the oxygen dissociation curves of haemoglobin from two species of mammals, s and T .

Which statements could explain the difference in the oxygen dissociation curves of species S and species T ?
I. Species T has higher haemoglobin concentration in its red blood cells than species S.
II. The haemoglobin in species T has a lower affinity for oxygen than the haemoglobin in species S.
III. Species T may be living at a higher altitudes than species S.
View SolutionHow many factors shift the oxygen dissociation curve to the right shift?
I Low partial pressure of oxygen
ii High concentation of carbon dioxide
iii High number of hydrogrn ions
iv Low body temperature
v Daily exercise
vi Haemoglobin of babies or fetal haemoglobin
View Solution
