A block of ice at −8∘C is slowly heated and converted to steam at 100∘C. Which of the following curves represents the phenomena qualitatively?
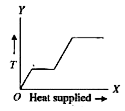
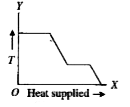
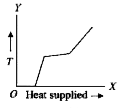
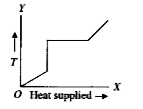
The correct Answer is:A
Step by step video, text & image solution for A block of ice at -8^(@)C is slowly heated and converted to steam at 100^(@)C. Which of the following curves represents the phenomena qualitatively? by Physics experts to help you in doubts & scoring excellent marks in Class 11 exams.
Topper's Solved these Questions
- BOOK - ICSECHAPTER - COMPETITION CARE UNITEXERCISE - INTERNAL ENERGY40videos
COMPETITION CARE UNIT
- BOOK - ICSECHAPTER - COMPETITION CARE UNITEXERCISE - THERMAL CONDUCTION17videos
COMPETITION CARE UNIT
- BOOK - ICSECHAPTER - COMPETITION CARE UNITEXERCISE - PROPERTIES OF MATTER (SURFACE TENSION )23videos
COMPETITION CARE UNIT
- BOOK - ICSECHAPTER - CIRCULAR MOTION EXERCISE - MODULE 2 (FROM ROTATIONAL KINETIC ENERGY , WORK ,POWER)24videos
CIRCULAR MOTION
- BOOK - ICSECHAPTER - DIMENSIONSEXERCISE - SELECTED PROBLEMS (FROM CONVERSIONS OF ONE SYSTEMS OF UNITS INTO ANOTHER)9videos
DIMENSIONS
Similar Questions
Knowledge Check
- Question 1 - Select One
A block of ice at −10∘C is slowly heated and converted to steam at 100∘C. Which of the following curves represents the phenomenon qualitatively?
A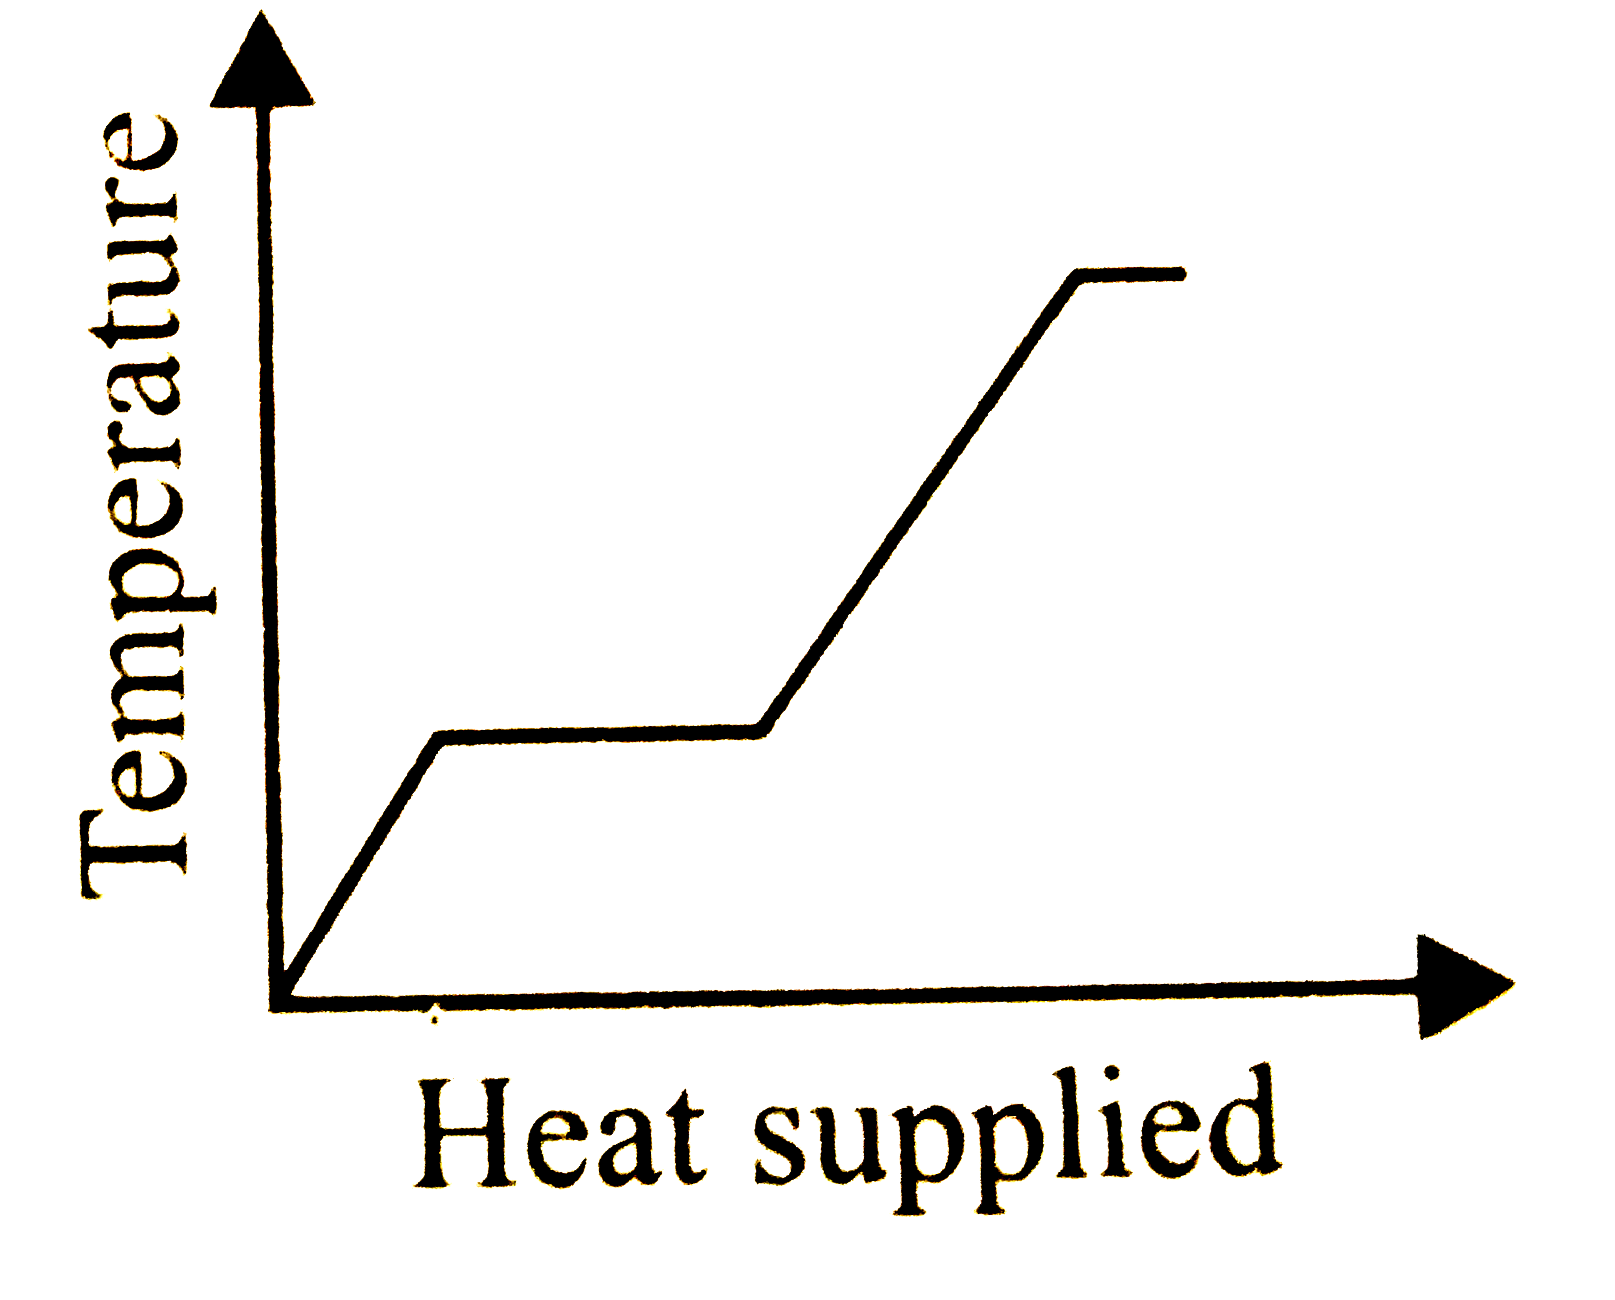 B
B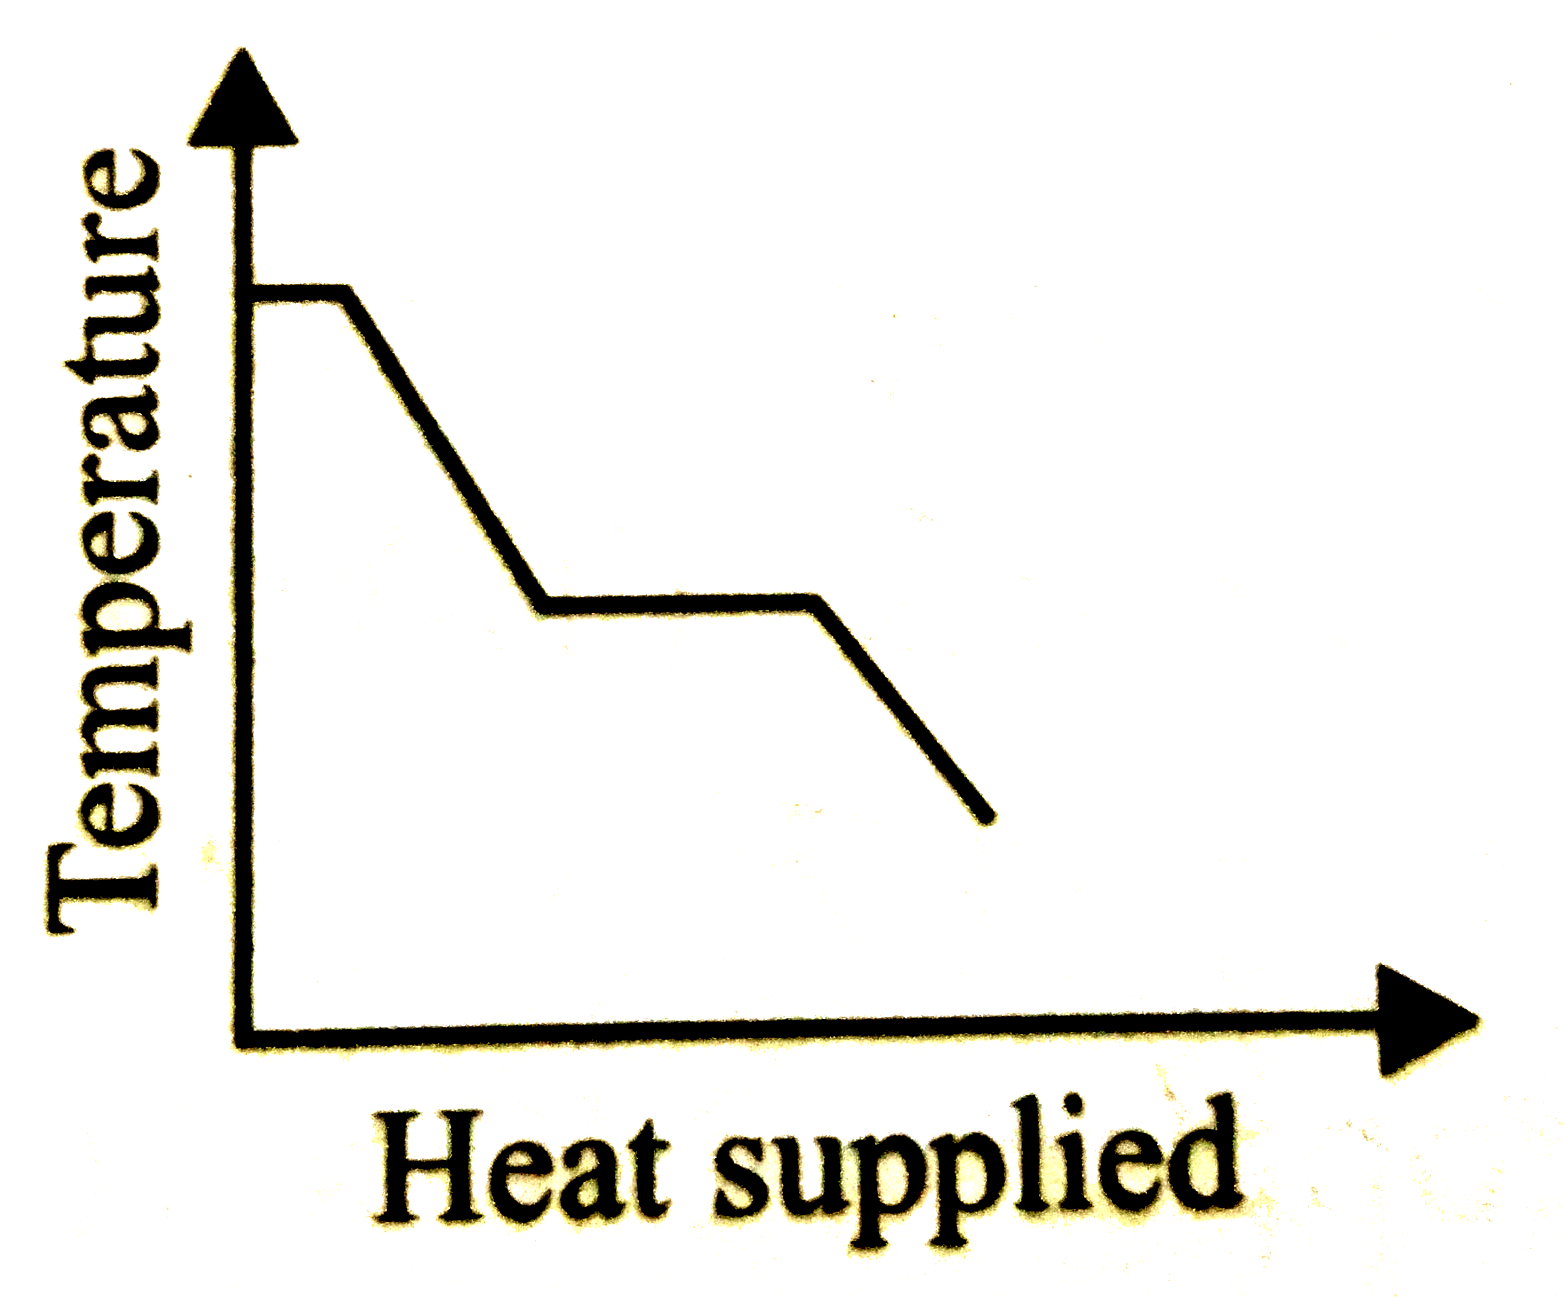 C
C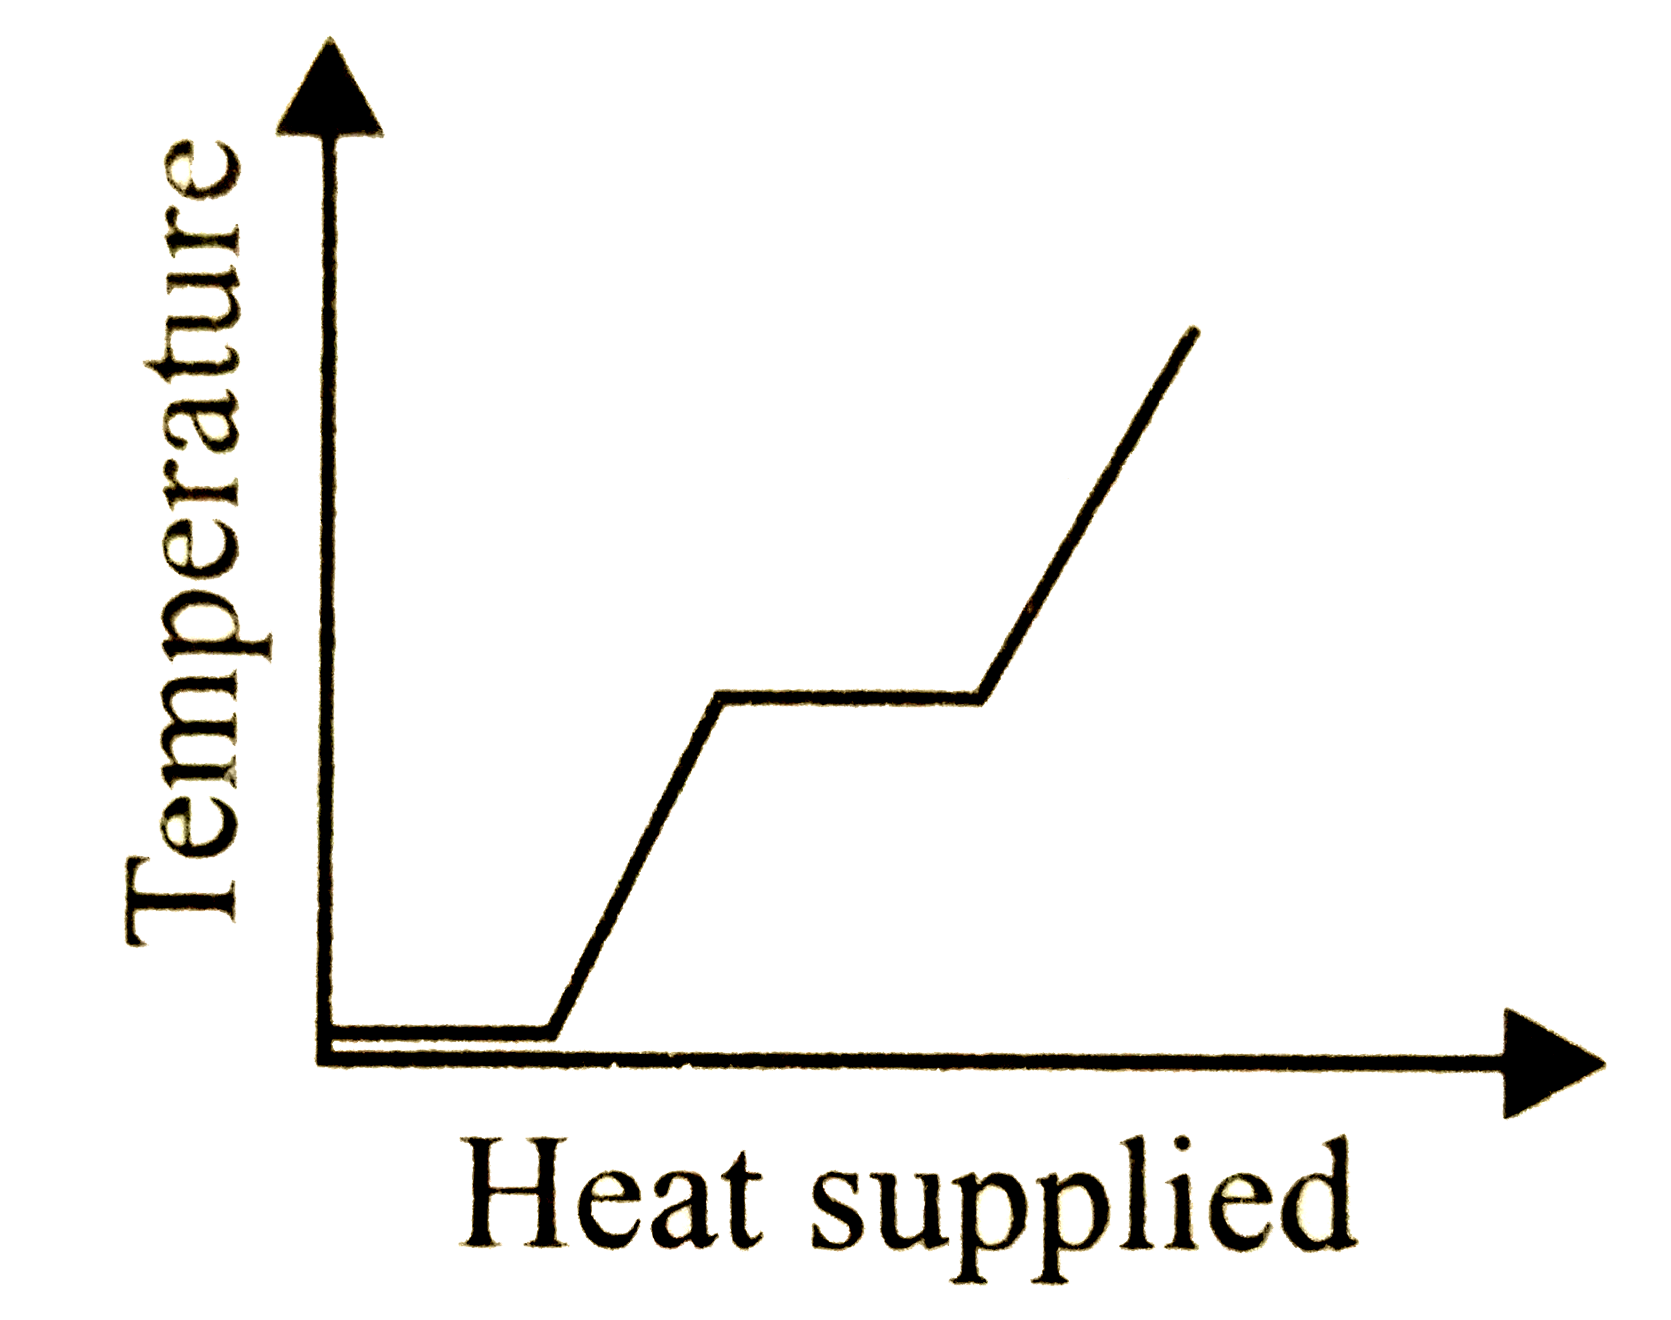 D
D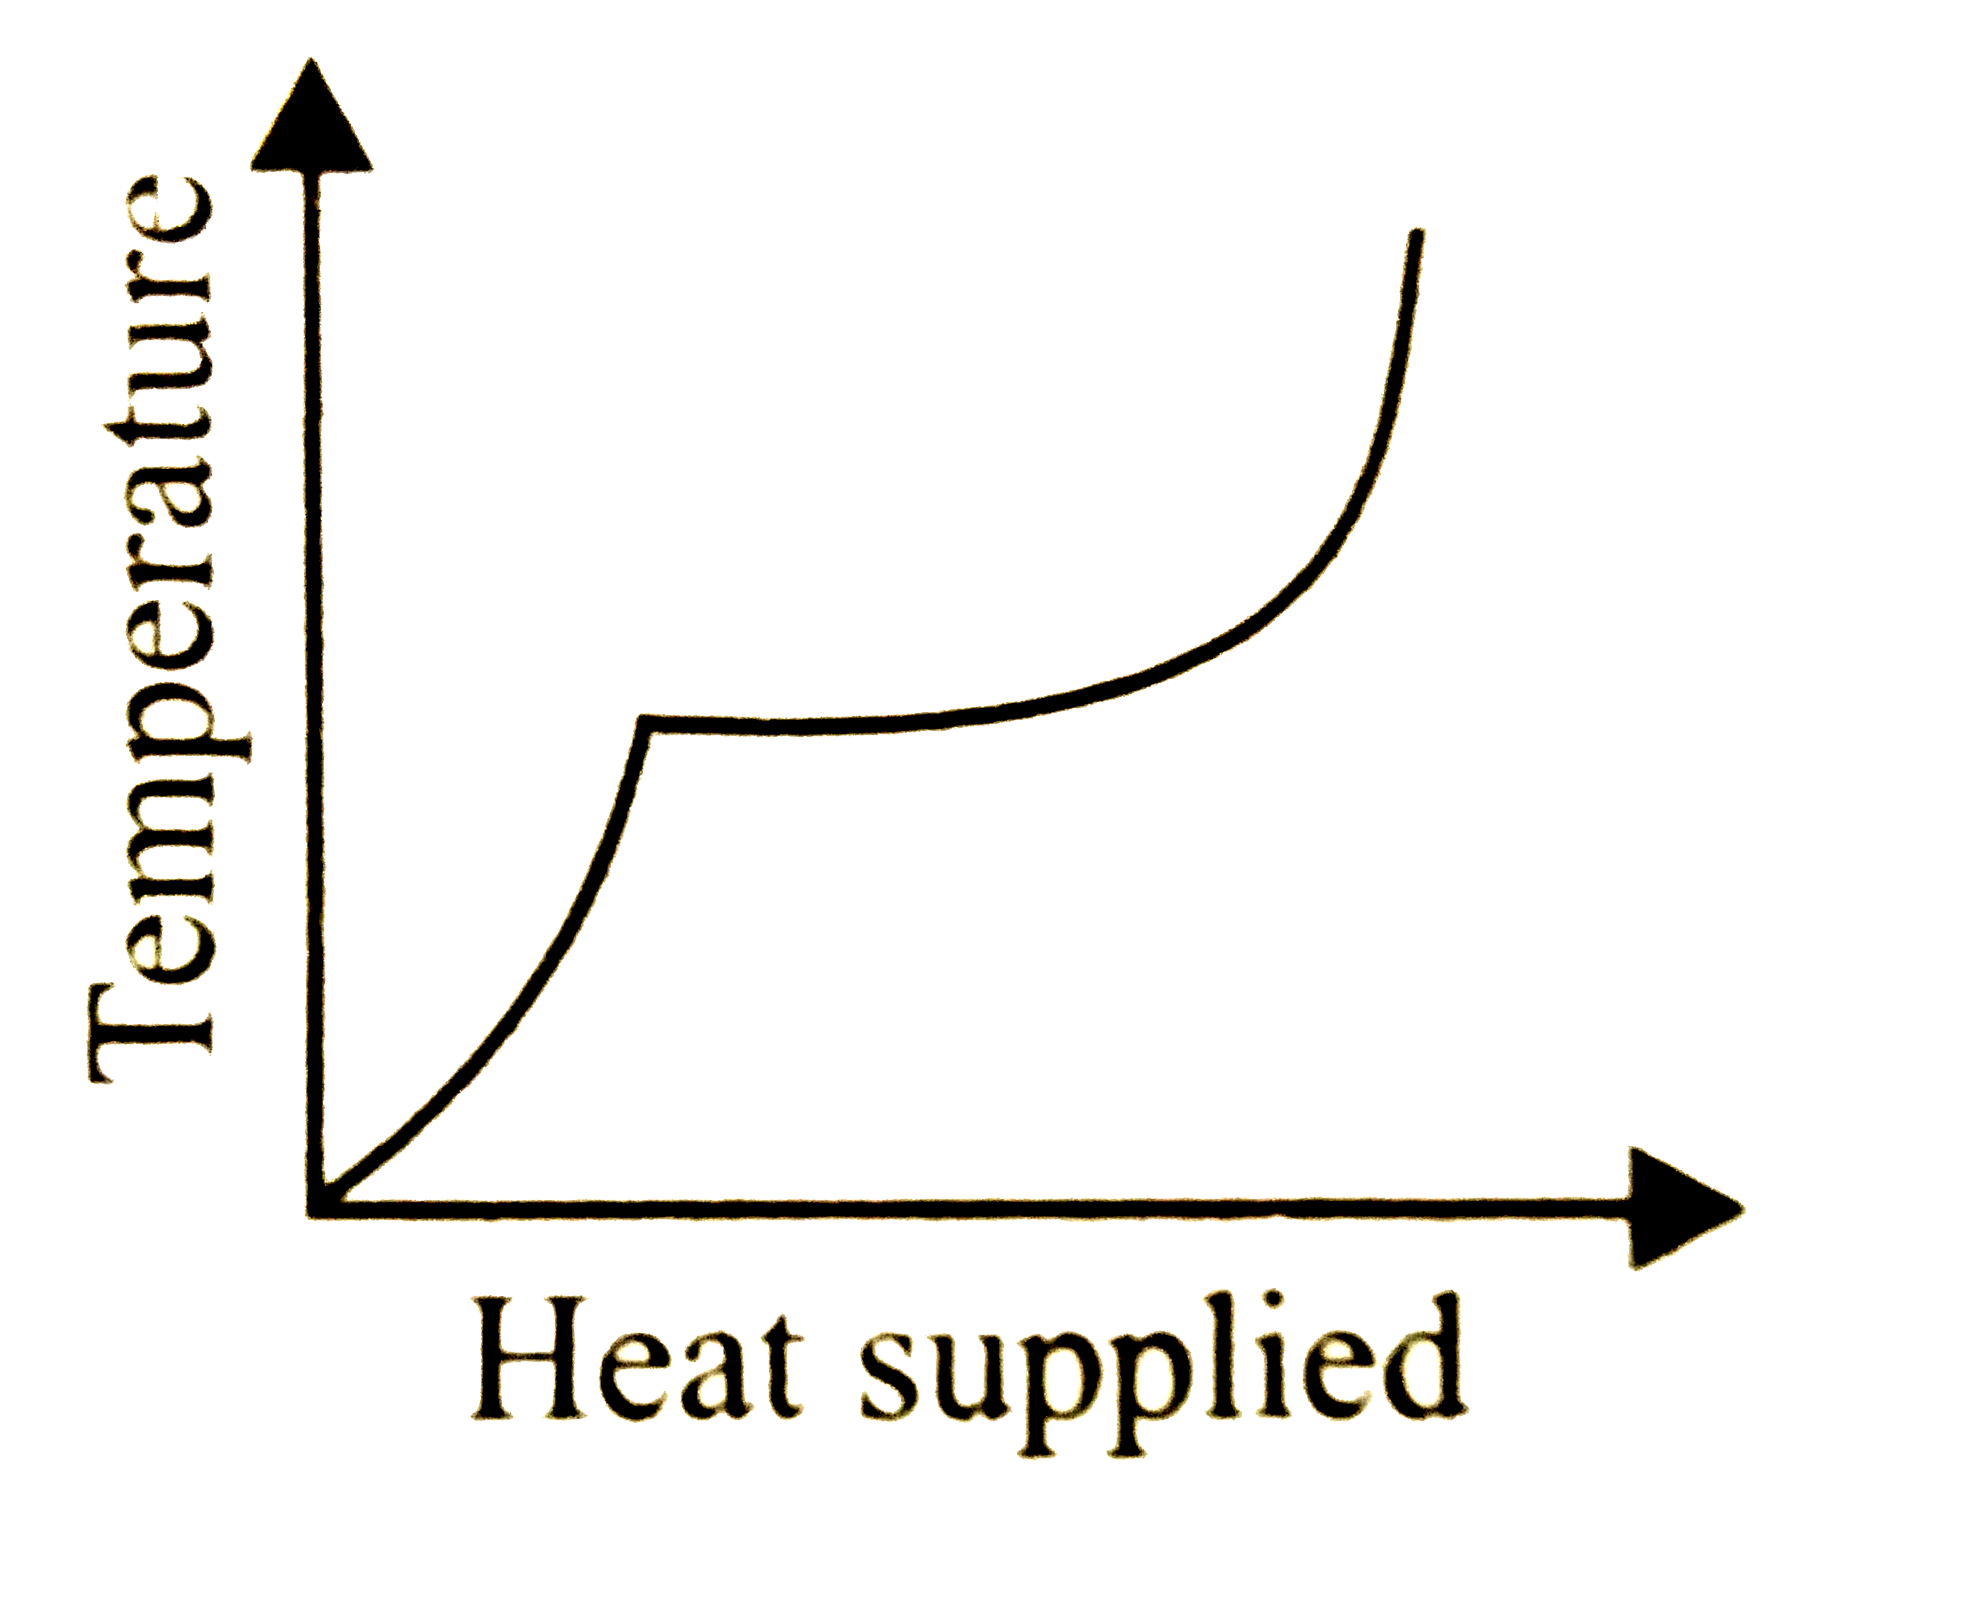
- Question 2 - Select One
A block of ice, initially at −20∘C, is heated a steady rate until the temperature of the sample reaches 120∘C. Which of the following graphs best illustrates the temperature of the sample as a function of time?
A B
B C
C D
D
Heat required to convert 1 g of ice at 0∘C into steam at 100∘C is
View Solution1 g of water at 100∘C is completely converted into steam at 100∘C. 1g of steam occupies a volume of 1650cc. (Neglect the volume of 1g of water at 100∘C). At the pressure of 105N/m2, latent heat of steam is 540 cal/g (1 Calorie=4.2 joules). The increase in the internal energy in joules is
View Solution30 g ice at 0∘C is mixed with 25 g steam at 100∘C. Find the final temperature and composition
View SolutionA certain mass of ice at 0∘C is converted to steam at 100∘C by constant heating, Draw temperature-time graph showing the change in phases.
View SolutionA certain mass of ice at 0∘C is converted to steam at 100∘C by constant heating, Draw temperature-time graph showing the change in phases.
View SolutionWork done in converting 1 g of ice at −10∘C into steam at 100∘C is
View Solution

