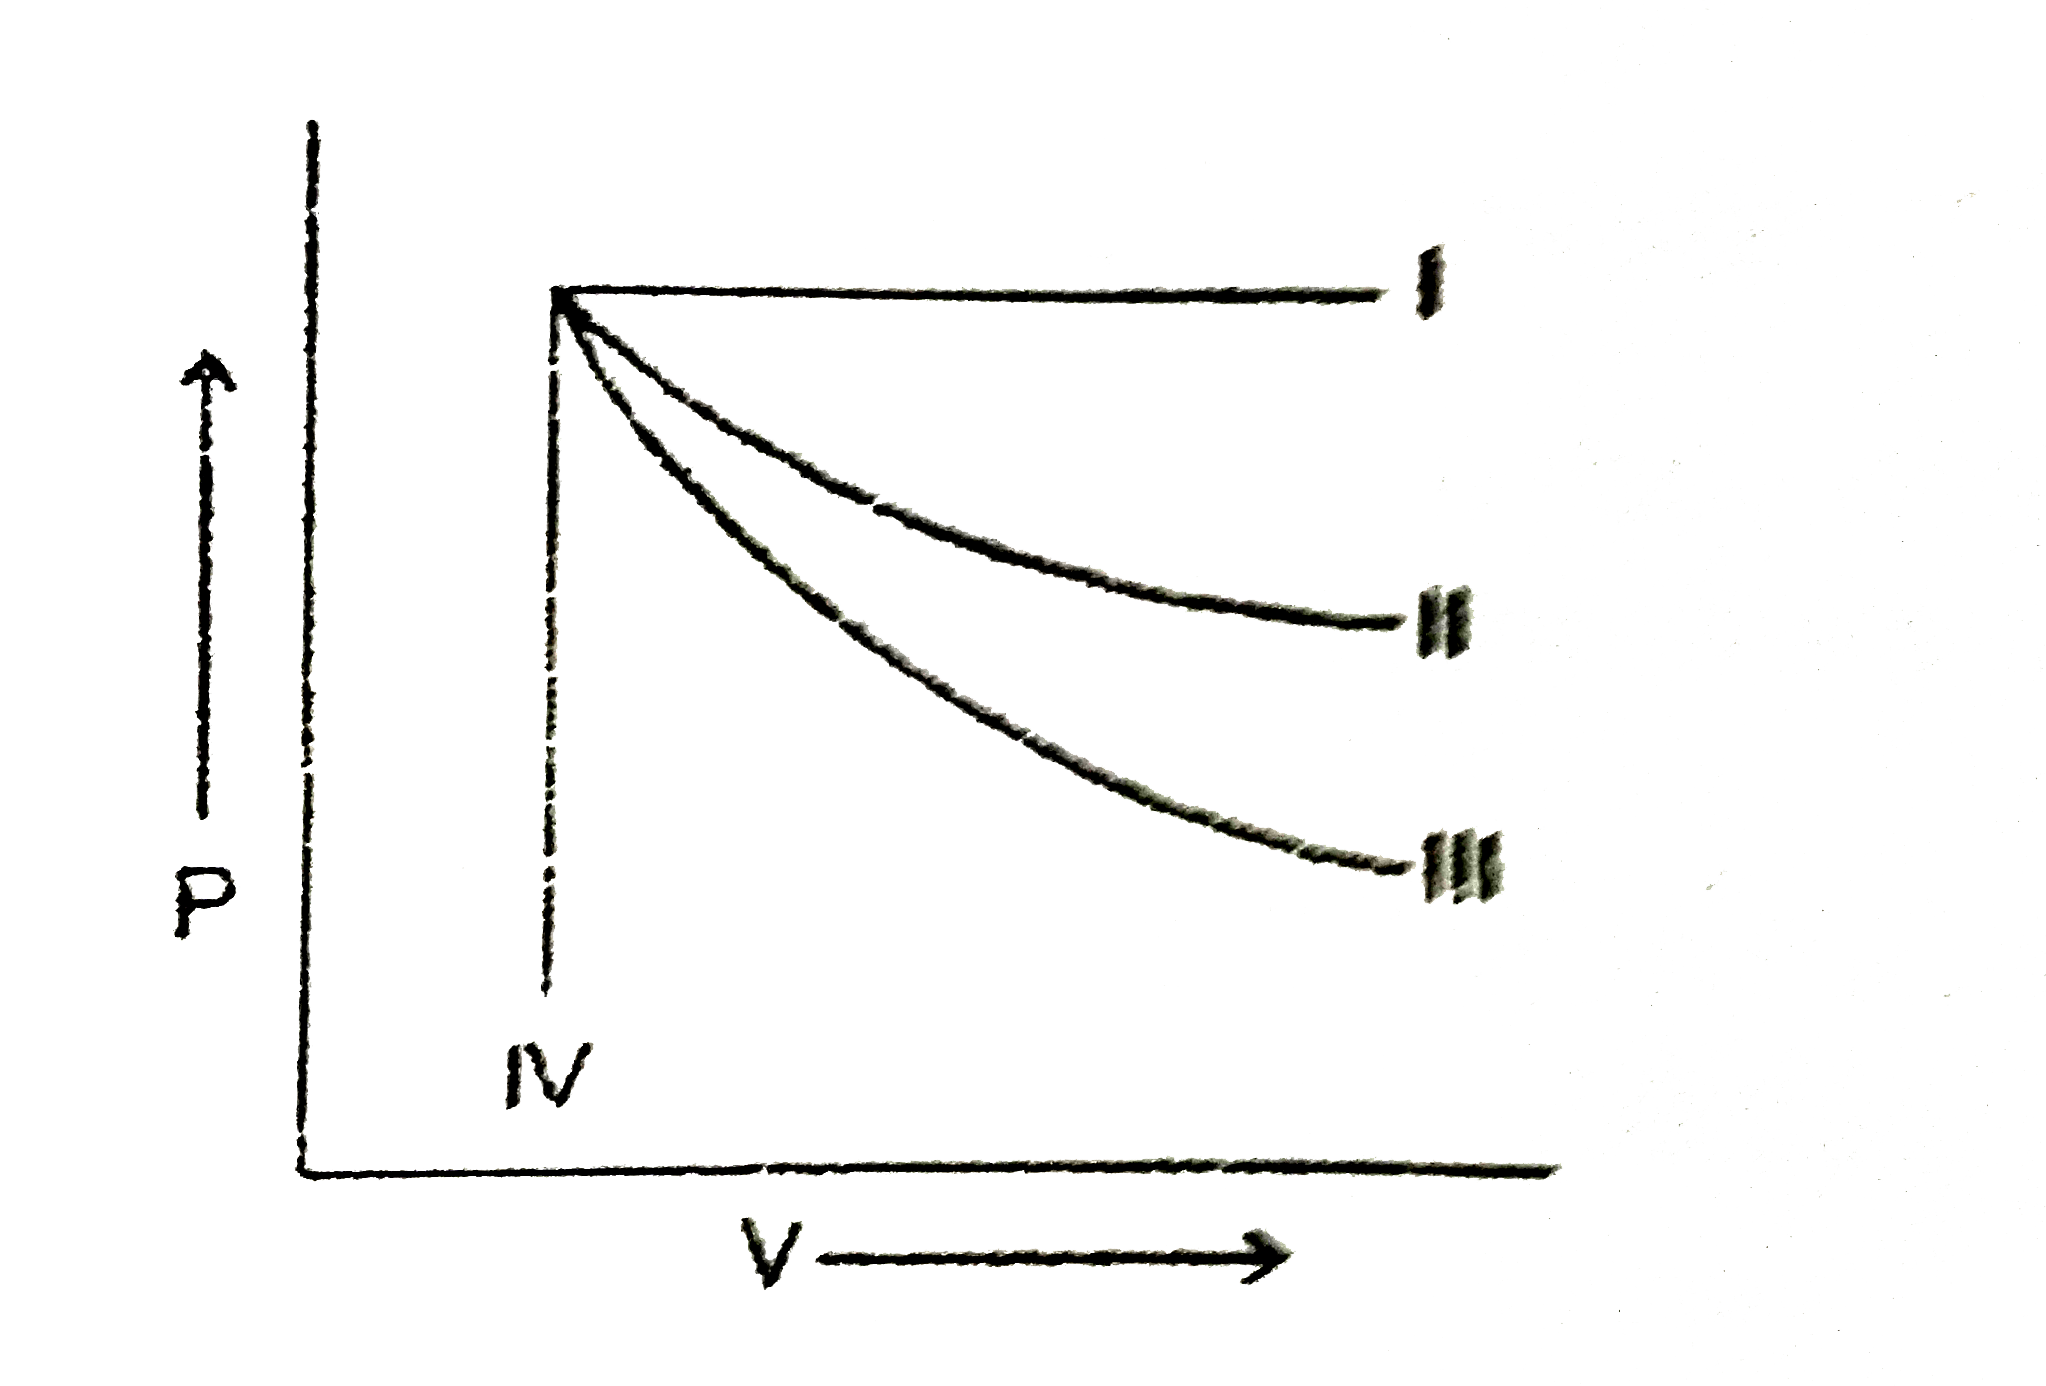
Slope of PV and V for an isobaric process will be
−1
zero
+1
n R T
The correct Answer is:C
To find the slope of the graph of PV versus V for an isobaric process, we can follow these steps:
1. Understand the Isobaric Process:
- An isobaric process is defined as a thermodynamic process in which the pressure (P) remains constant.
2. Set Up the Graph:
- In this case, we are plotting PV on the y-axis and V (volume) on the x-axis.
3. Identify the Slope:
- The slope of a graph is defined as the change in the y-axis variable divided by the change in the x-axis variable. Mathematically, this is expressed as:
slope=Δ(PV)ΔV
4. Substituting for Isobaric Process:
- Since the pressure is constant during an isobaric process, we can express PV as:
PV=P⋅V
- Therefore, the change in PV can be expressed as:
Δ(PV)=P⋅ΔV
5. Calculate the Slope:
- Substituting this into the slope formula gives:
slope=P⋅ΔVΔV
- The ΔV terms cancel out (as long as ΔV≠0):
slope=P
6. Conclusion:
- Since the pressure is constant throughout the process, the slope of the graph of PV versus V for an isobaric process is equal to the constant pressure P.
Final Answer:
The slope of PV versus V for an isobaric process is equal to the constant pressure P.
- An isobaric process is defined as a thermodynamic process in which the pressure (P) remains constant.
- In this case, we are plotting PV on the y-axis and V (volume) on the x-axis.
- The slope of a graph is defined as the change in the y-axis variable divided by the change in the x-axis variable. Mathematically, this is expressed as:
slope=Δ(PV)ΔV
- Since the pressure is constant during an isobaric process, we can express PV as:
PV=P⋅V
- Therefore, the change in PV can be expressed as:
Δ(PV)=P⋅ΔV
- Substituting this into the slope formula gives:
slope=P⋅ΔVΔV
- The ΔV terms cancel out (as long as ΔV≠0):
slope=P
- Since the pressure is constant throughout the process, the slope of the graph of PV versus V for an isobaric process is equal to the constant pressure P.
The slope of PV versus V for an isobaric process is equal to the constant pressure P.
Topper's Solved these Questions
- BOOK - ICSECHAPTER - COMPETITION CARE UNITEXERCISE - THERMAL CONDUCTION17videos
COMPETITION CARE UNIT
- BOOK - ICSECHAPTER - COMPETITION CARE UNITEXERCISE - THERMAL RADIATION13videos
COMPETITION CARE UNIT
- BOOK - ICSECHAPTER - COMPETITION CARE UNITEXERCISE - PROPERTIES OF MATTER (CALORIMETRY, CHANGE OF STATE & KINETIC THEORY OF GASES )30videos
COMPETITION CARE UNIT
- BOOK - ICSECHAPTER - CIRCULAR MOTION EXERCISE - MODULE 2 (FROM ROTATIONAL KINETIC ENERGY , WORK ,POWER)24videos
CIRCULAR MOTION
- BOOK - ICSECHAPTER - DIMENSIONSEXERCISE - SELECTED PROBLEMS (FROM CONVERSIONS OF ONE SYSTEMS OF UNITS INTO ANOTHER)9videos
DIMENSIONS
Similar Questions
For an isobaric process, ΔP=0.
View SolutionThe slope of P-V graph for isochoric process is
View SolutionDraw at P-T curve for isobaric process.
View SolutionDraw at P-T curve for isobaric process.
View SolutionWhich of the following is a V-T curve for isobaric process?
View Solutionwhat is the expression of work done for isobaric process?
View SolutionAssertion Straight line on V-T graph represents isobaric process.
Reason If V ∝ T, then p= constant i.e., orocess is isobaric.View SolutionWhen heat in given to a gas in an isobaric process, then
View SolutionAn ideal gas expands from V to 2V in 4 separate processes. Where process 1 is isothermal process 2 is adiabatic, process 3 is free expansion and process 4 is isobaric. If E1,E2,E3 and E4 are the changes in average kinetic energy of the molecules in the isothermal, adiabatic free expansion and isobaric process respectively then choose the correct options.
View Solution
The plots between P and V which represent isochoric and isobaric process respectively:View Solution

