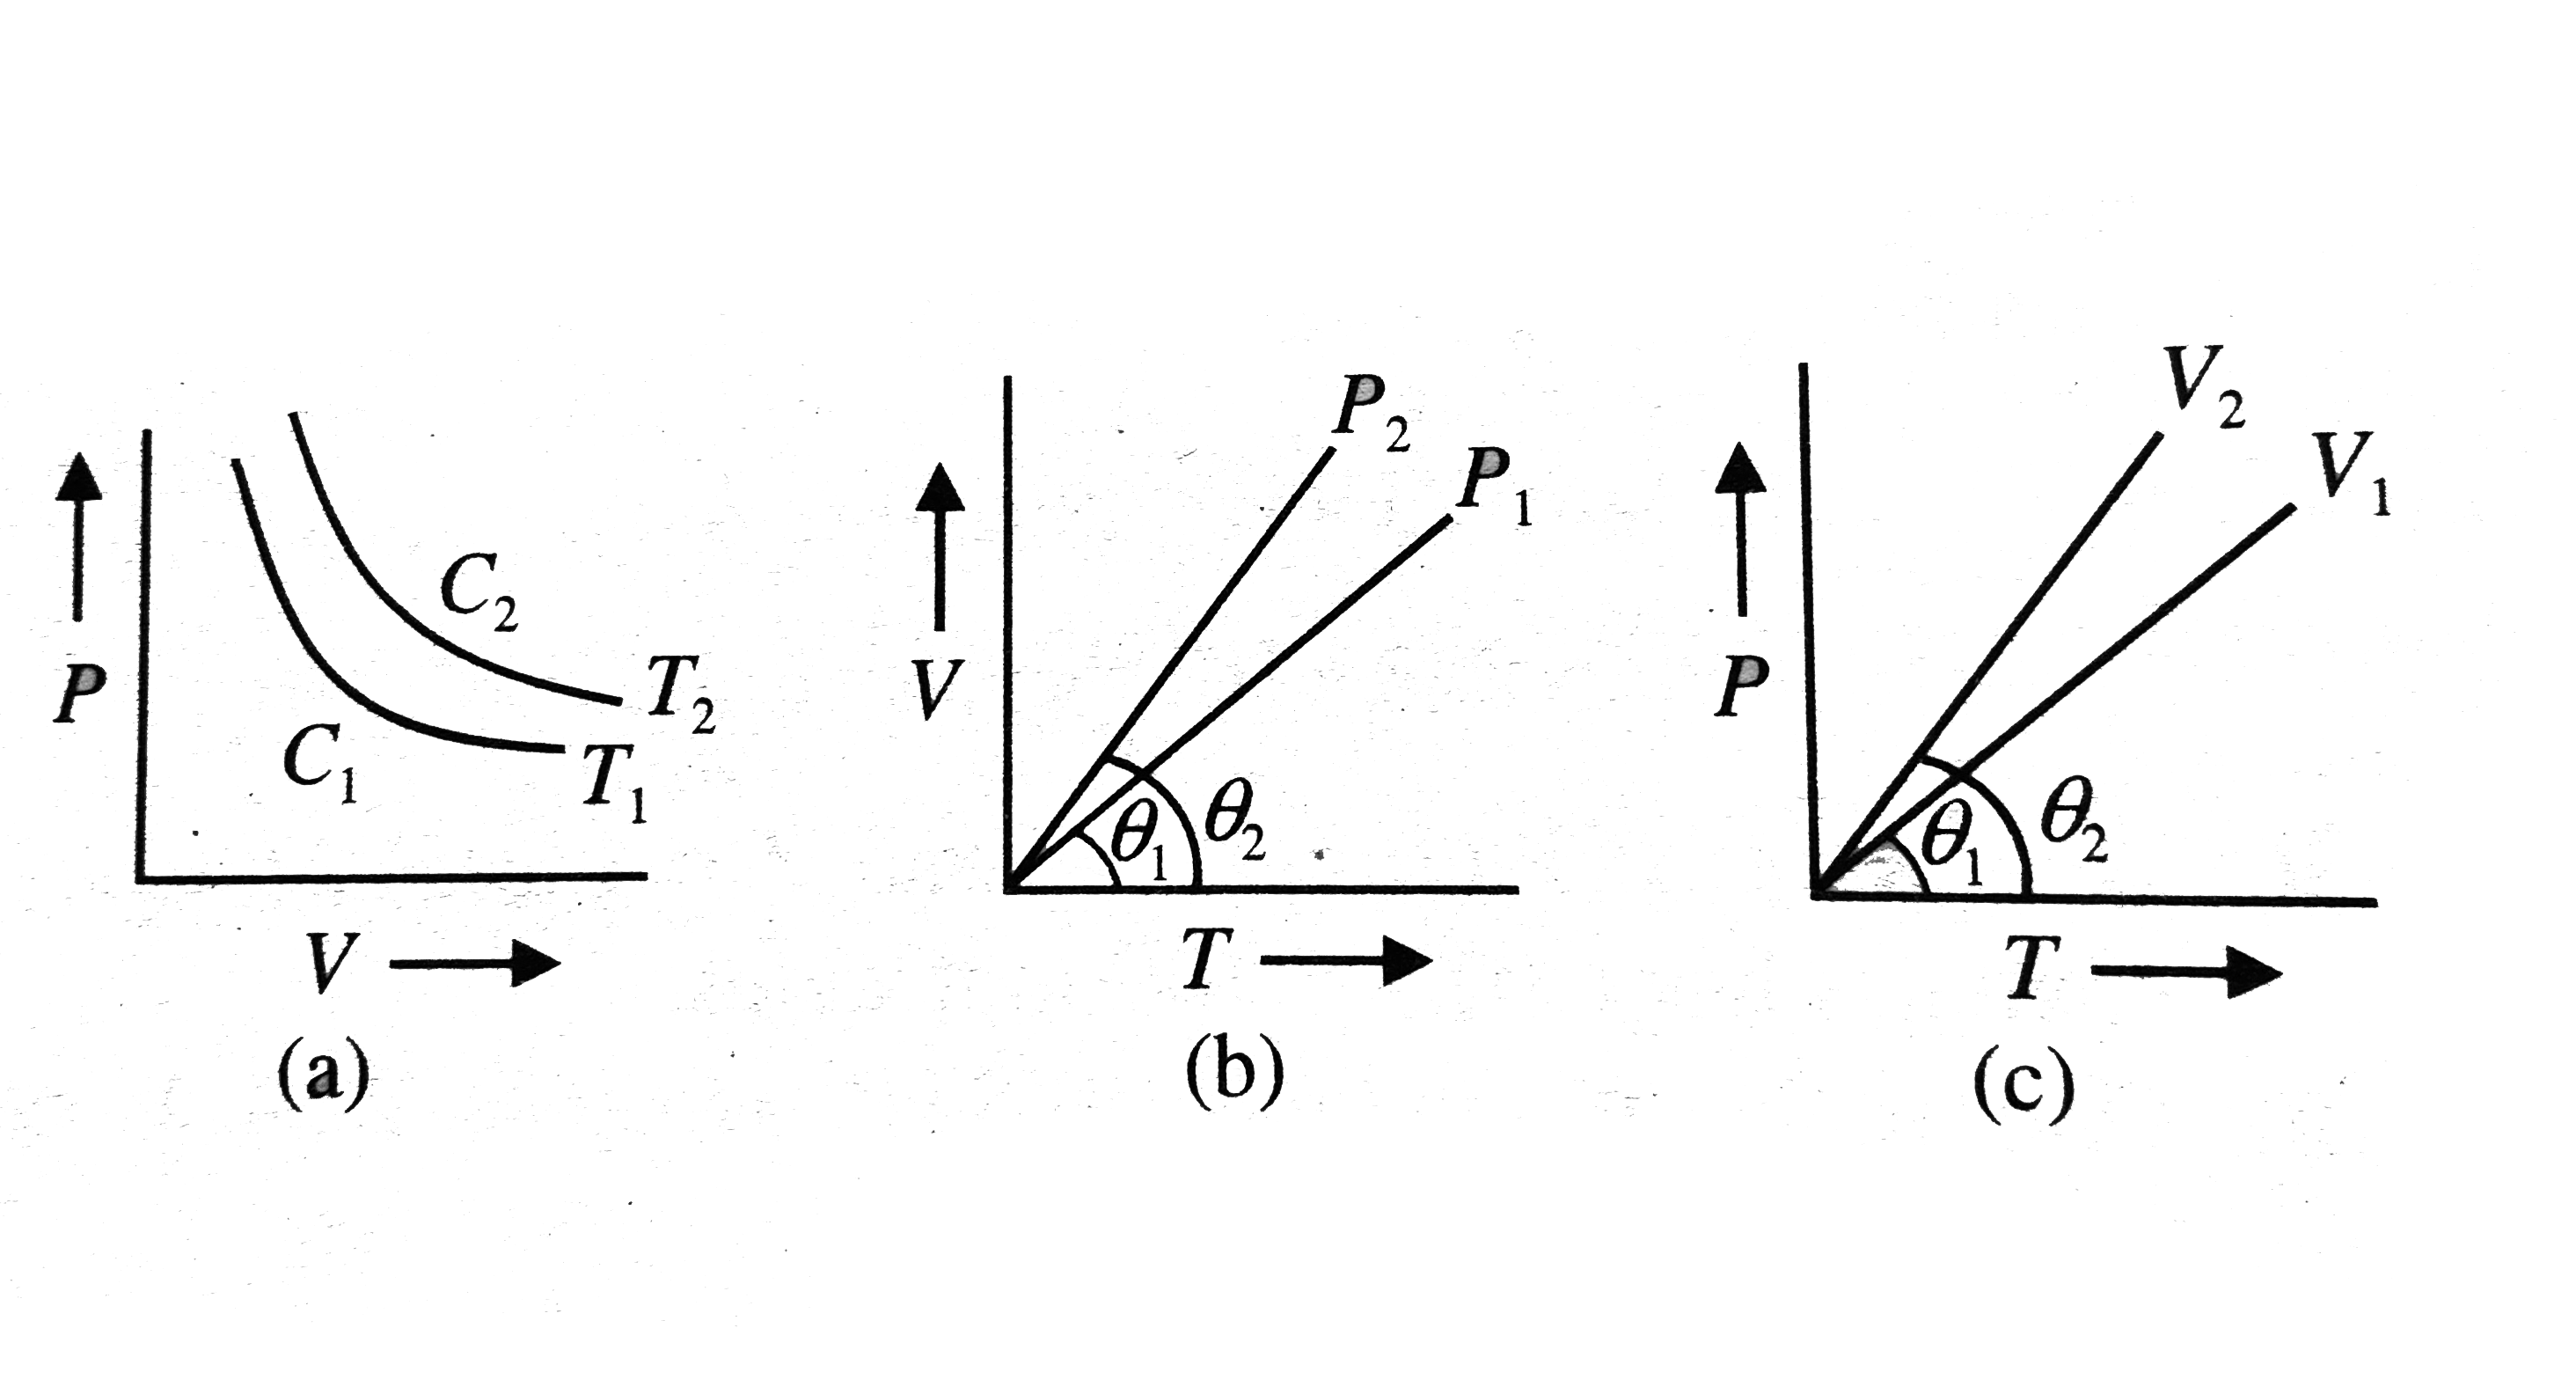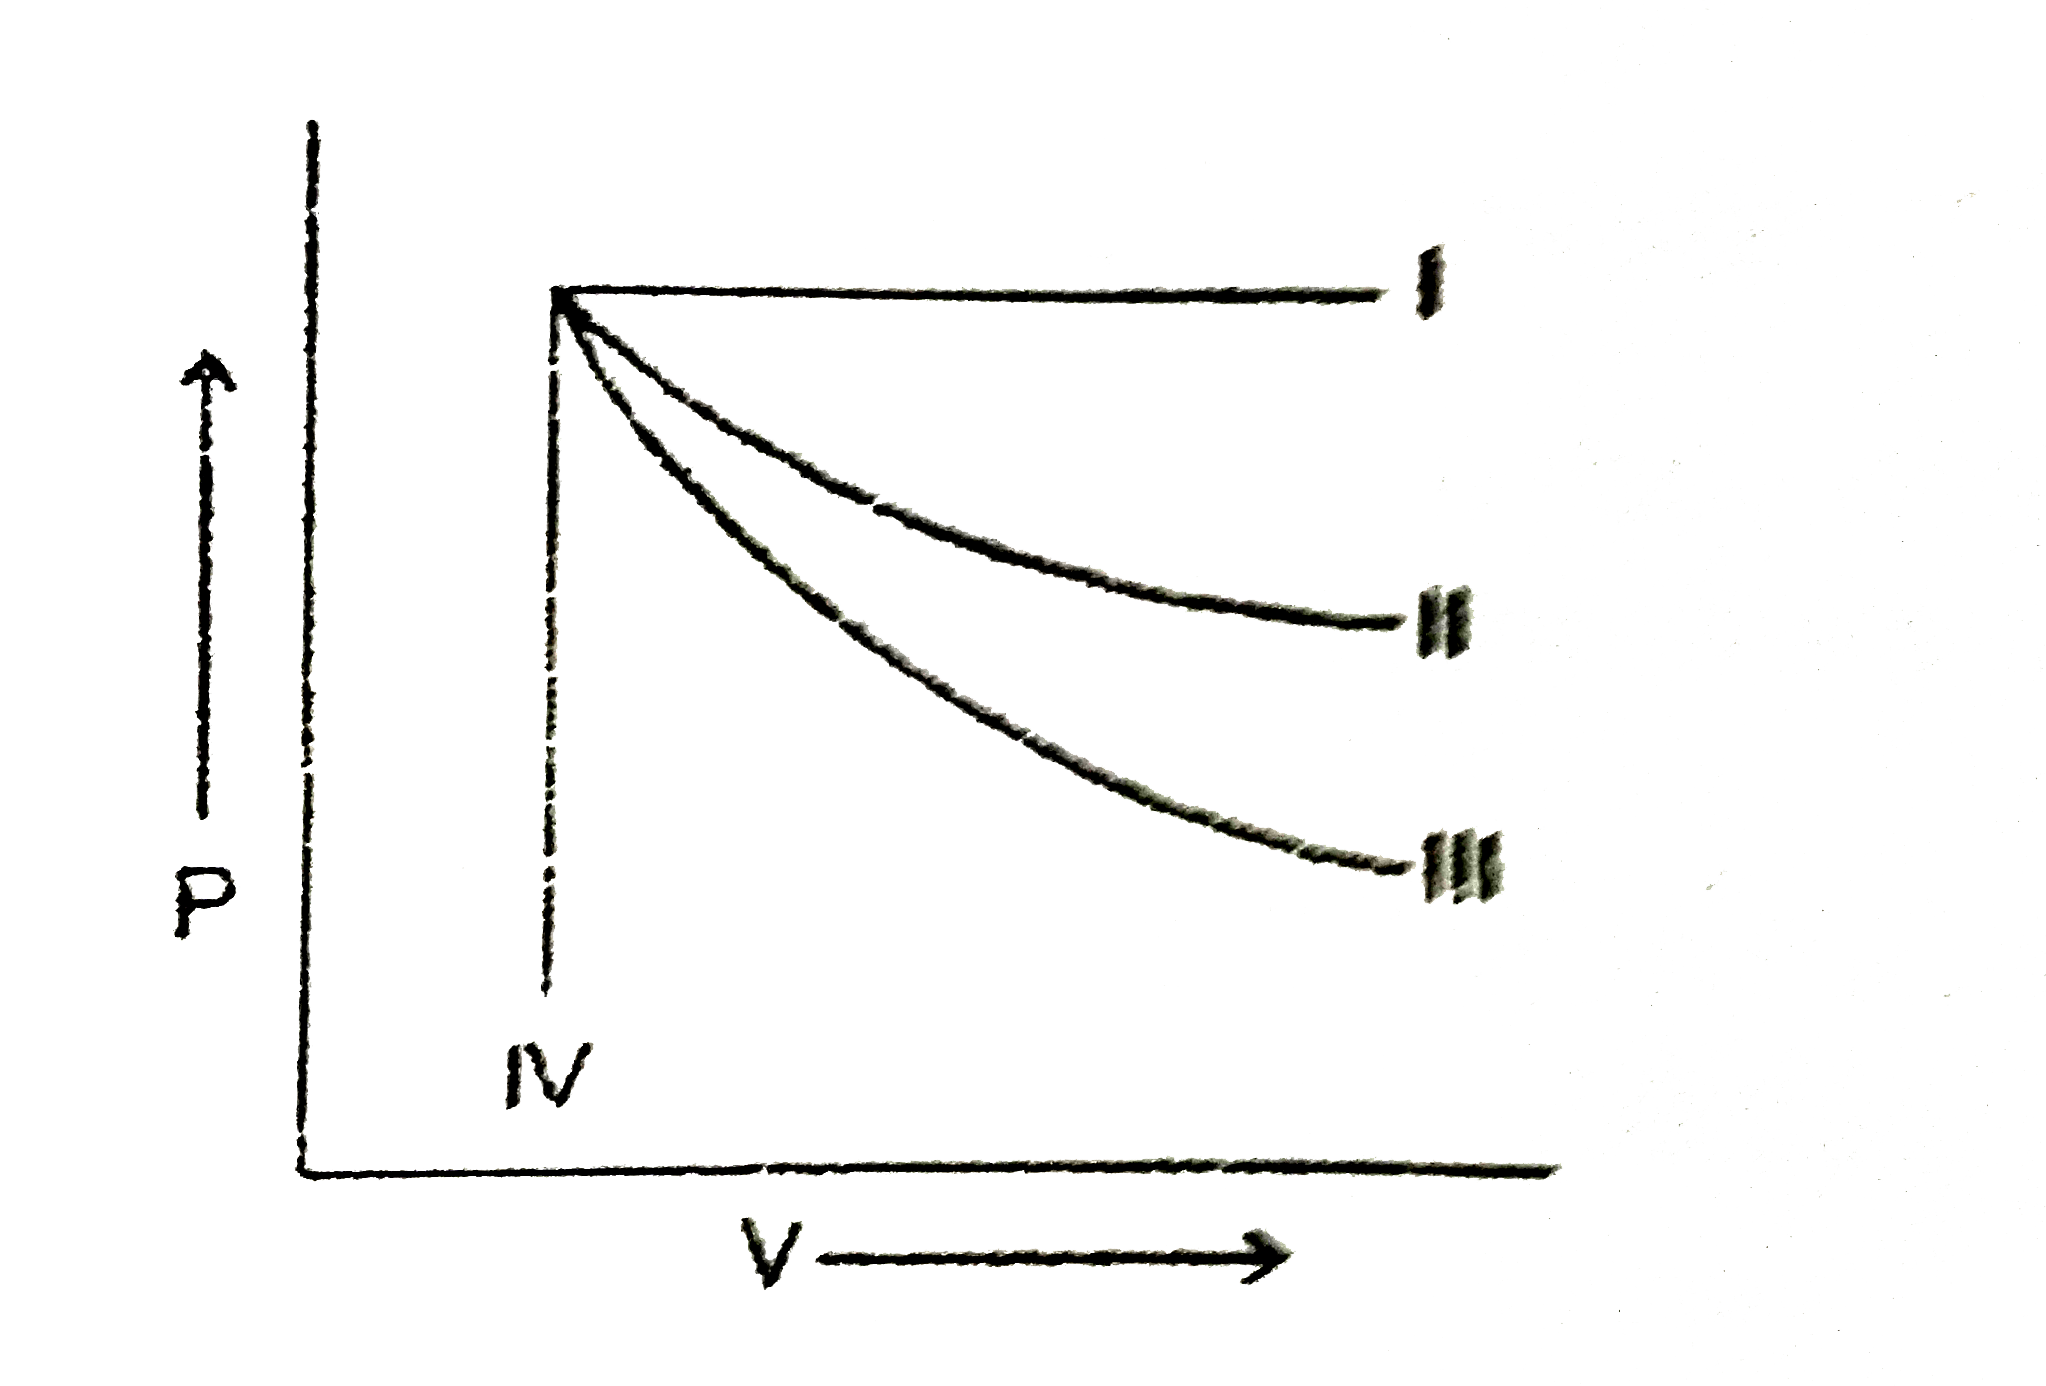
The plots between P and V which represent isochoric and isobaric process respectively:
A
I,II
B
IV,I
C
I,IV
D
II,III
Video Solution
Text Solution
The correct Answer is:B
For IV is constant (isobaric)
For I pressure is constant (isobaric)
|
Topper's Solved these Questions
- THERMODYNAMICSBOOK - RESONANCE ENGLISHCHAPTER - THERMODYNAMICSEXERCISE - Exercise-2 II: Single and double value integer type
16 Videos
- THERMODYNAMICSBOOK - RESONANCE ENGLISHCHAPTER - THERMODYNAMICSEXERCISE - Exercise 2- III : One or more than one options correct type
14 Videos
- THERMODYNAMICSBOOK - RESONANCE ENGLISHCHAPTER - THERMODYNAMICSEXERCISE - Exercise -1 Part -II Only option correct type
92 Videos
- TEST SERIESBOOK - RESONANCE ENGLISHCHAPTER - TEST SERIESEXERCISE - CHEMISTRY
50 Videos
Similar Questions
Knowledge Check
The set which repesents the isotope , isobar and isotone respectively is
A(.21H,.31H),(.19779Au,.19880Hg)and(.32He,.21H)B(.32H,.11H),(.19779Au,.19880Hg)and(.11He,.31H)C(.32H,.31H),(.21H,.21H)and(.19779Au,.19880Hg)D(.21H,.31H),(.32He,.31H)and(.19779Au,.19880Hg)Which plot is the adsorption isobar for chemisorption?
A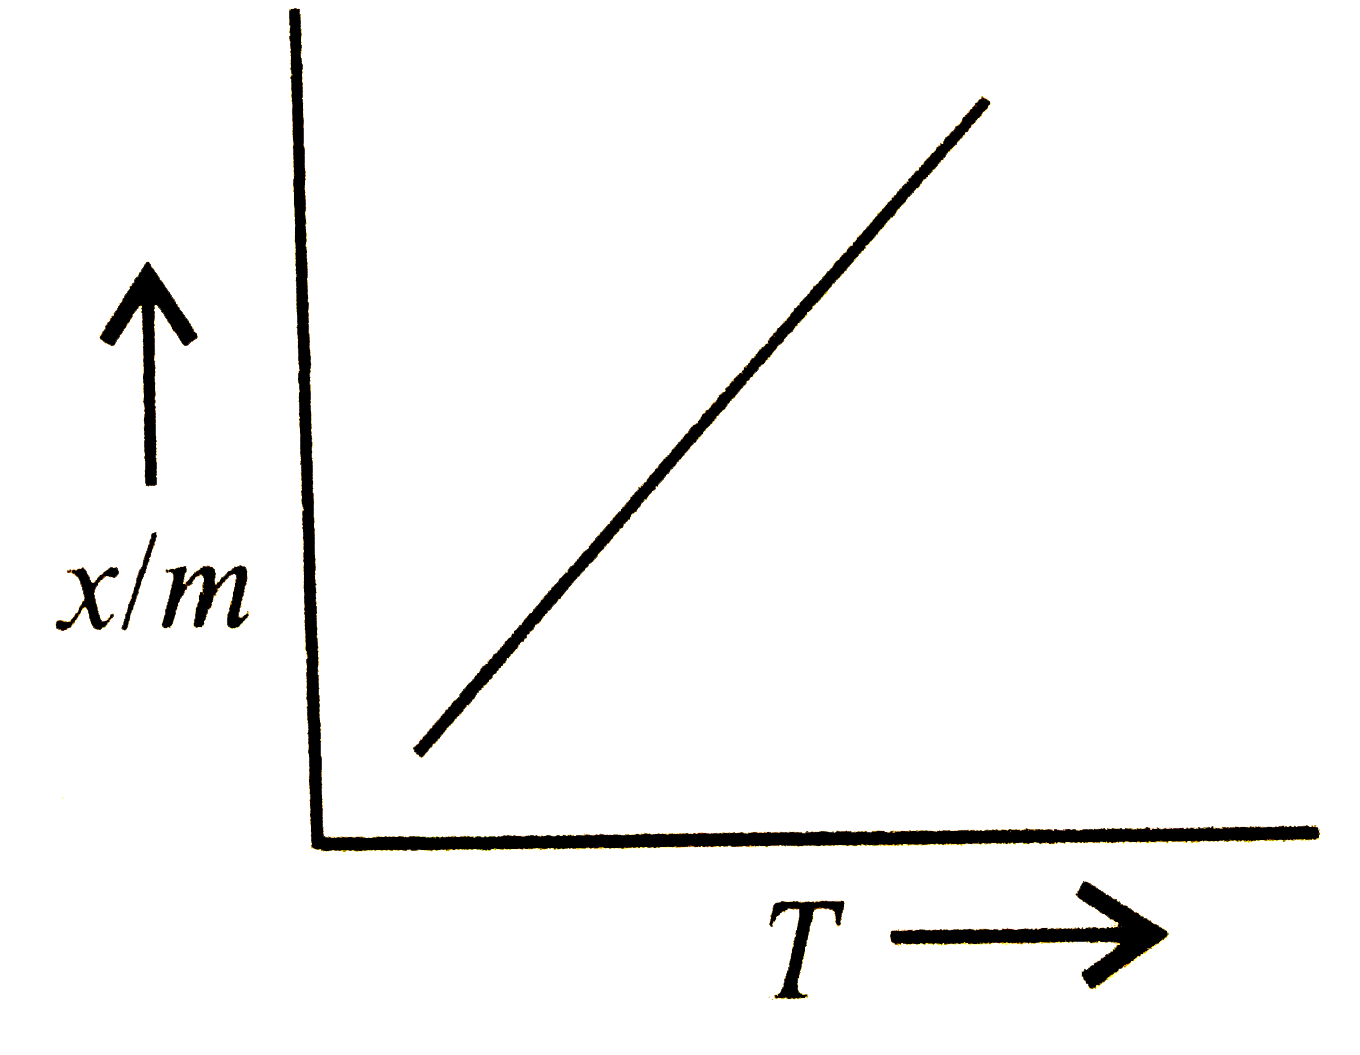 B
B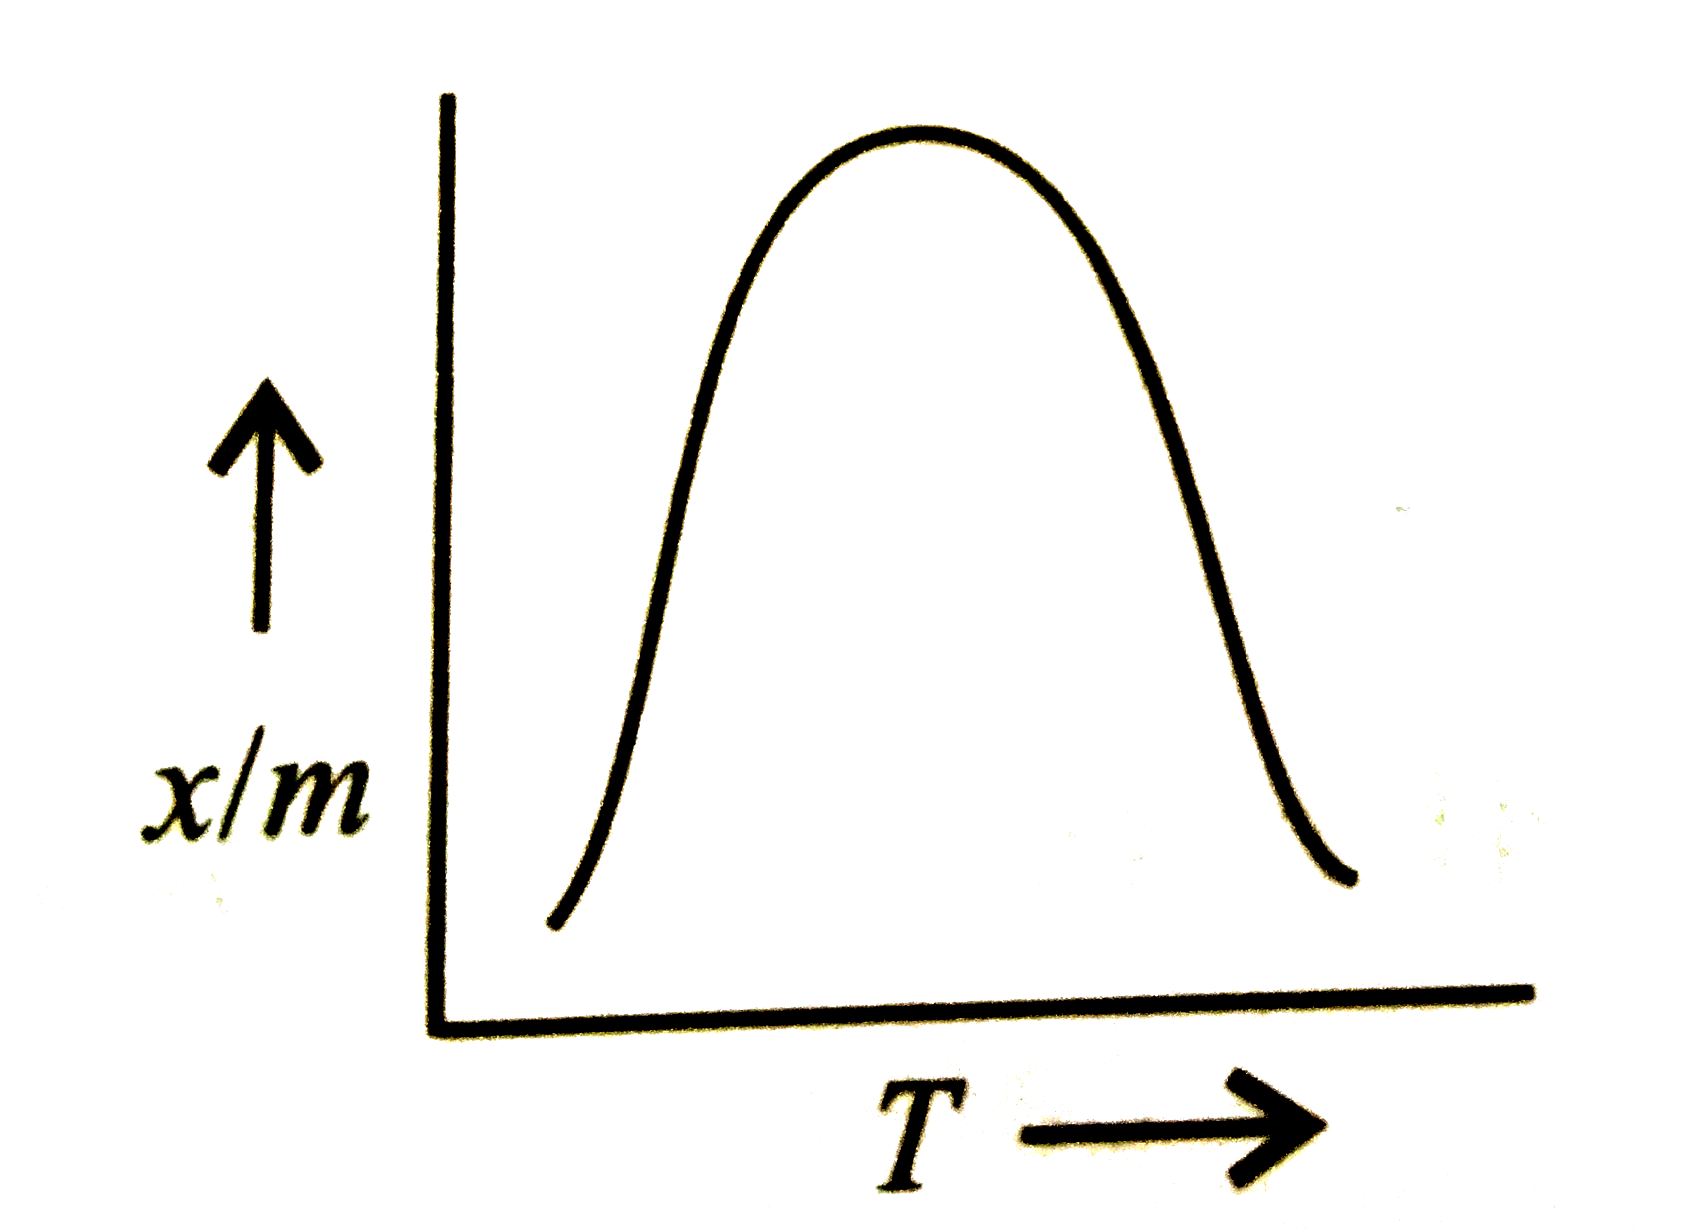 C
C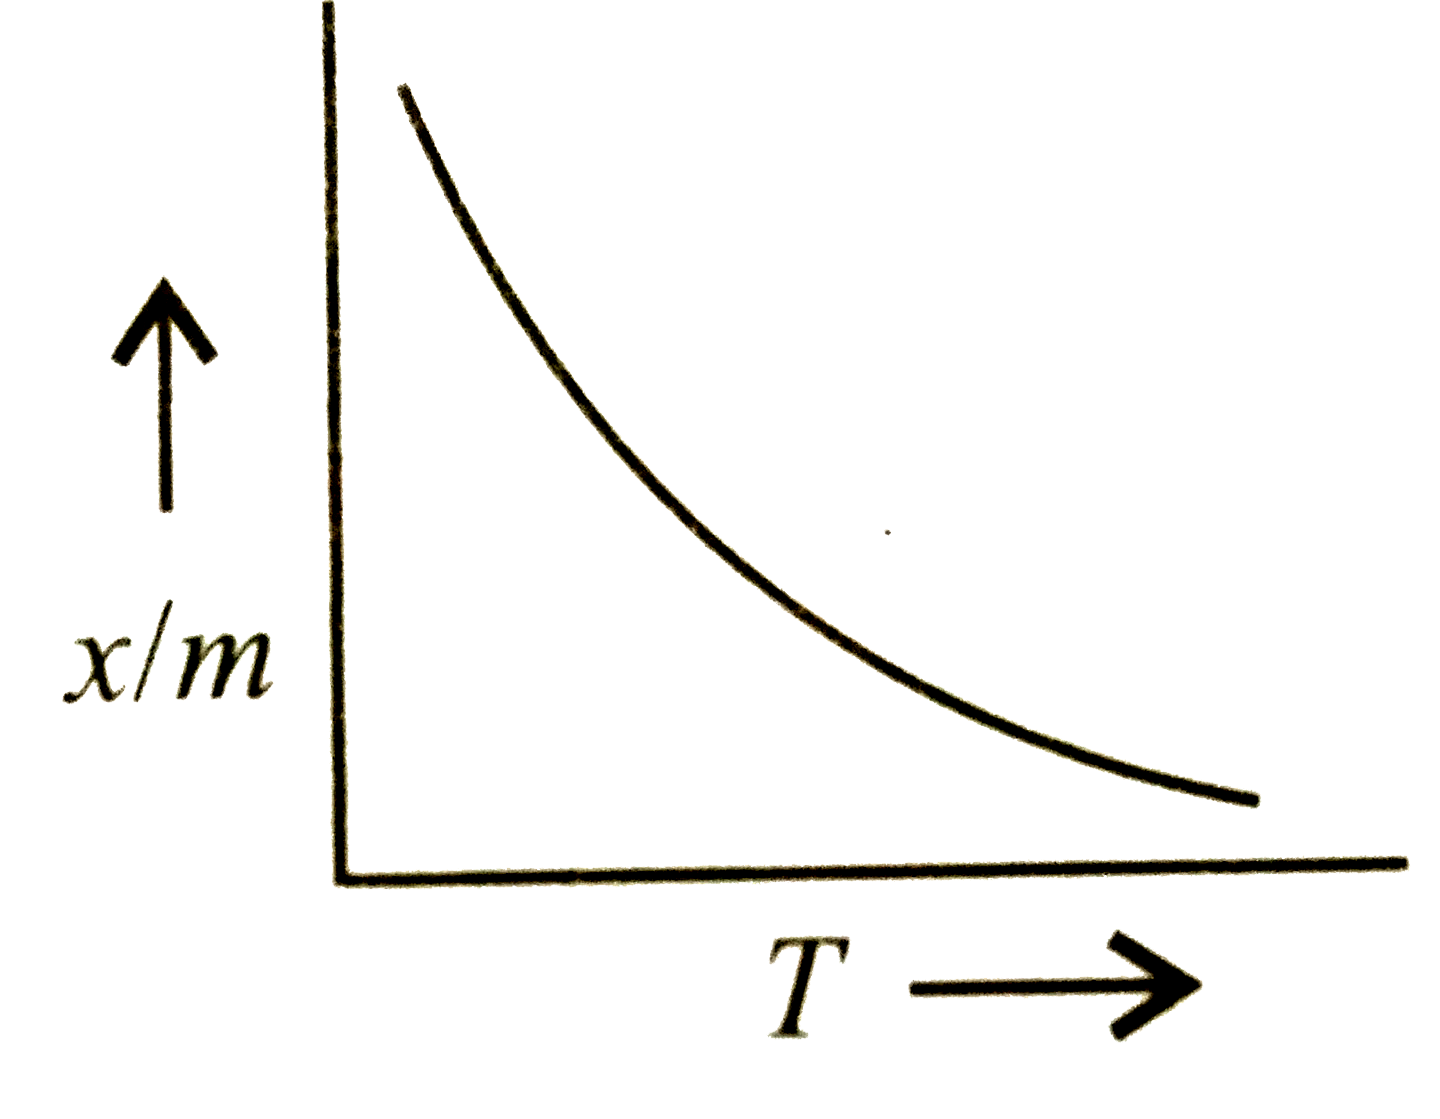 D
D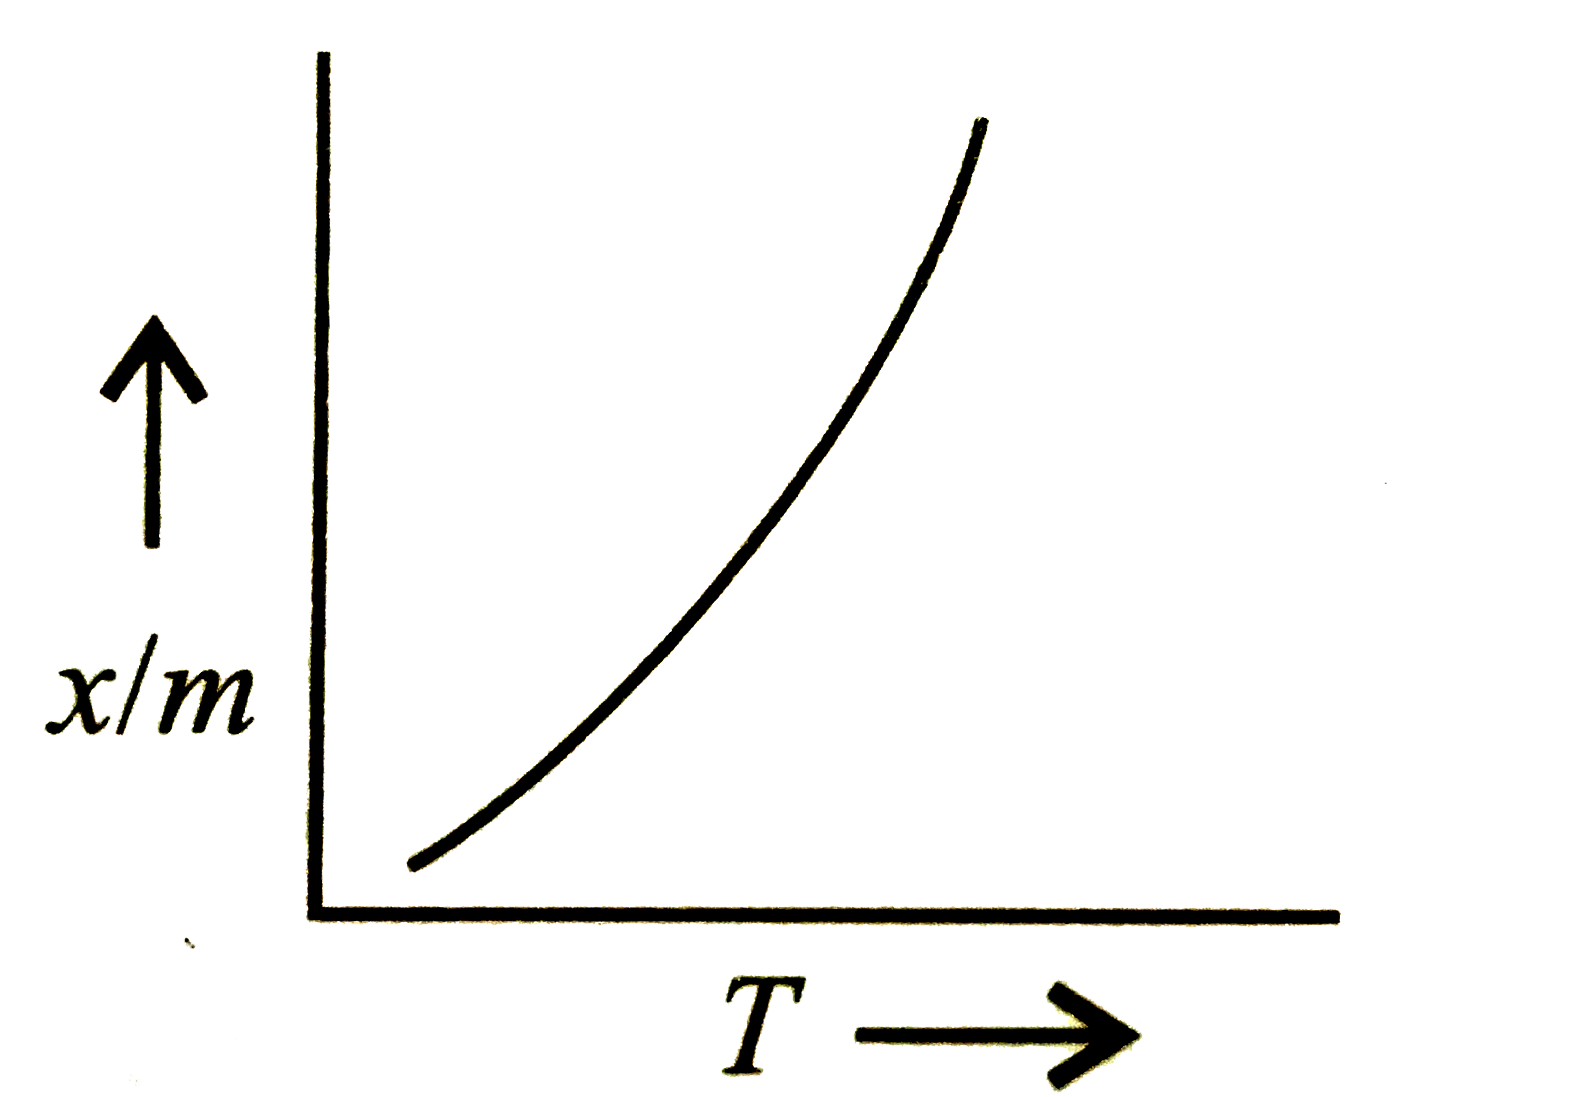
Explain the difference between isobaric and isochoric processes.
View SolutionAn ideal gas expands from V to 2V in 4 separate processes. Where process 1 is isothermal process 2 is adiabatic, process 3 is free expansion and process 4 is isobaric. If E1,E2,E3 and E4 are the changes in average kinetic energy of the molecules in the isothermal, adiabatic free expansion and isobaric process respectively then choose the correct options.
View SolutionDraw at P-T curve for isobaric process.
View SolutionDraw at P-T curve for isobaric process.
View SolutionWhich plot is the adsorption isobar for chemisorption?
View SolutionWhich plot is the adsorption isobar for chemisorption?
View Solution

