A particle starts moving with initial velocity u=25ms−1 and retardation a=−2ms−2. Draw the velocity-time graph.
To solve the problem of drawing the velocity-time graph for a particle starting with an initial velocity of u=25m/s and undergoing a retardation of a=−2m/s2, we can follow these steps:
Step 1: Identify the given values
- Initial velocity, u=25m/s
- Retardation (negative acceleration), a=−2m/s2
Step 2: Use the equation of motion
We can use the first equation of motion:
v=u+at
Substituting the known values:
v=25−2t
Step 3: Rearrange the equation
Rearranging the equation gives us:
v=−2t+25
This is a linear equation in the form y=mx+c, where:
- m=−2 (slope)
- c=25 (y-intercept)
Step 4: Determine key points for the graph
1. Initial point: At t=0:
v=25m/s
This gives us the point (0,25).
2. Final point: To find when the velocity becomes zero:
0=25−2t
Solving for t:
2t=25⇒t=12.5s
This gives us the point (12.5,0).
Step 5: Plot the points on the graph
- Plot the point (0,25) on the graph.
- Plot the point (12.5,0) on the graph.
Step 6: Draw the line
Connect the two points with a straight line. The line will slope downwards due to the negative acceleration (retardation).
Step 7: Label the axes
- The x-axis represents time (in seconds).
- The y-axis represents velocity (in meters per second).
Final Graph
The graph will start at (0,25) and end at (12.5,0) with a straight line indicating the decrease in velocity over time.
- Initial velocity, u=25m/s
- Retardation (negative acceleration), a=−2m/s2
We can use the first equation of motion:
v=u+at
Substituting the known values:
v=25−2t
Rearranging the equation gives us:
v=−2t+25
This is a linear equation in the form y=mx+c, where:
- m=−2 (slope)
- c=25 (y-intercept)
1. Initial point: At t=0:
v=25m/s
This gives us the point (0,25).
0=25−2t
Solving for t:
2t=25⇒t=12.5s
This gives us the point (12.5,0).
- Plot the point (0,25) on the graph.
- Plot the point (12.5,0) on the graph.
Connect the two points with a straight line. The line will slope downwards due to the negative acceleration (retardation).
- The x-axis represents time (in seconds).
- The y-axis represents velocity (in meters per second).
The graph will start at (0,25) and end at (12.5,0) with a straight line indicating the decrease in velocity over time.
Topper's Solved these Questions
- BOOK - CENGAGE PHYSICS ENGLISHCHAPTER - BASIC MATHEMATICSEXERCISE - Exercise 2.32videos
BASIC MATHEMATICS
- BOOK - CENGAGE PHYSICS ENGLISHCHAPTER - BASIC MATHEMATICSEXERCISE - Exercise 2.46videos
BASIC MATHEMATICS
- BOOK - CENGAGE PHYSICS ENGLISHCHAPTER - BASIC MATHEMATICSEXERCISE - Exercise 2.12videos
BASIC MATHEMATICS
- BOOK - CENGAGE PHYSICS ENGLISHCHAPTER - ARCHIVES 2 VOLUME 6EXERCISE - Integer4videos
ARCHIVES 2 VOLUME 6
- BOOK - CENGAGE PHYSICS ENGLISHCHAPTER - CALORIMETRYEXERCISE - Solved Example13videos
CALORIMETRY
Similar Questions
If a particle starts moving with initial velocity u=1ms−1 and acceleration a=2ms−2, the veloctiy of the particle at any time is given by v=u+at=1+2t. Plot the velocity-time graph of the particle.
View SolutionIf a particle starts moving along x-axis from the origin with initial velocity u=1ms−1 and acceleration a=2ms−2, the relationship between displacement and time is
x=ut+12at2=1×t+12×2×t2=t+r2
Draw the displacement (x)-time (t) graph.View Solution
Knowledge Check
- Question 1 - Select One
For a uniformly retarded motion, the velocity-time graph is :
Aa curveBa straight line parallel to the time axisCa straight line perpendicular to the time axis.Da straight line inclined to the time axis.
A body starts moving with a velocity v0=10ms−1. It experiences a retardation equal to 0.2v2. Its velocity after 2s is given by
View SolutionA particle moves with initial velocity v0 and retardation αv, where v is velocity at any instant t. Then the particle
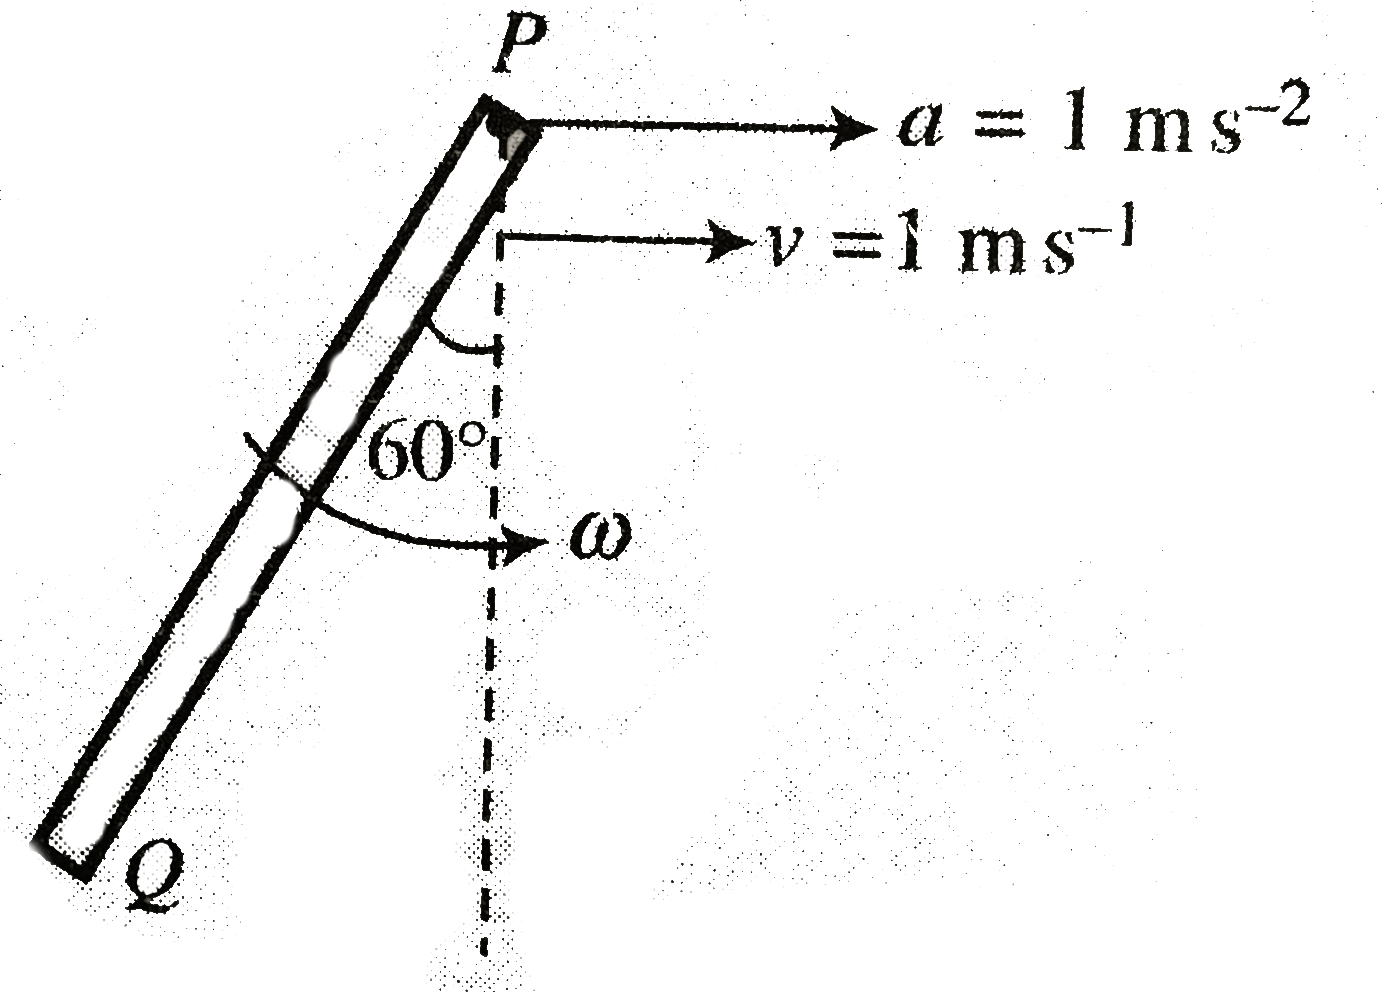
View SolutionThe rod of length l=1m rotates with an angular velocity ω=2rads−1 an the point P moves with velocity v=1ms−1 and acceleration a=1ms−2. Find the velocity and acceleration of Q.
 View Solution
A particle is moving along x-direction with a constant acceleration a. The particle starts from x=x0 position with initial velocity u. We can define the position of the particle with time by the relation
x=x0+ut+12at2
plot the position of the particle in relation with time is following situations
(i) If initial position of the particle is on negativ x-axis, initial velocity is positive and acceleration is negative.
(ii) If initial position is positive, initial velocity is negative and acceleration is positive.View SolutionA particle starts with a velocity of 2m/s and moves in a straight line with a retardation of 0.1m/s2. The time that it takes to describe 15m is
View SolutionA particle moves with an initial velocity V0 and retardation αv , where α is a constant and v is the velocity at any time t.
Velocity of particle at time is :View SolutionA particle has initial velocity 4i+4jms−1 and an acceleration −0.4ims−2, at what time will its speed bbe 5ms−1?
View Solution

