In figure , battery of emf E has internal reistance r and a variable resistor. At an instant, curent flowing through the circuit is i, potential difference between the terminals of cells is V, thermal power developed in external circuit is P, and thermal power developed in the cell is equal to fraction η of total electrical generated in it. Which of the following graphs is//are correct?

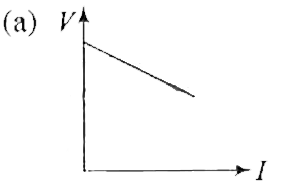
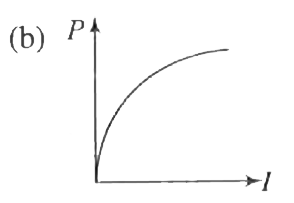
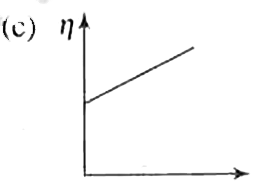
Both a and b are correct
The correct Answer is:D
Step by step video & image solution for In figure , battery of emf E has internal reistance r and a variable resistor. At an instant, curent flowing through the circuit is i, potential difference between the terminals of cells is V, thermal power developed in external circuit is P, and thermal power developed in the cell is equal to fraction eta of total electrical generated in it. Which of the following graphs is//are correct? by Physics experts to help you in doubts & scoring excellent marks in Class 12 exams.
Updated on:21/07/2023Topper's Solved these Questions
- HEATING EFFECT OF CURRENTBOOK - CENGAGE PHYSICS ENGLISHCHAPTER - HEATING EFFECT OF CURRENTEXERCISE - Calculating Thermal Power in Resistance
14 Videos
- GEOMETRICAL OPTICSBOOK - CENGAGE PHYSICS ENGLISHCHAPTER - GEOMETRICAL OPTICSEXERCISE - Integer Type
4 Videos
- INDUCTANCEBOOK - CENGAGE PHYSICS ENGLISHCHAPTER - INDUCTANCEEXERCISE - Concept Based
8 Videos
Similar Questions
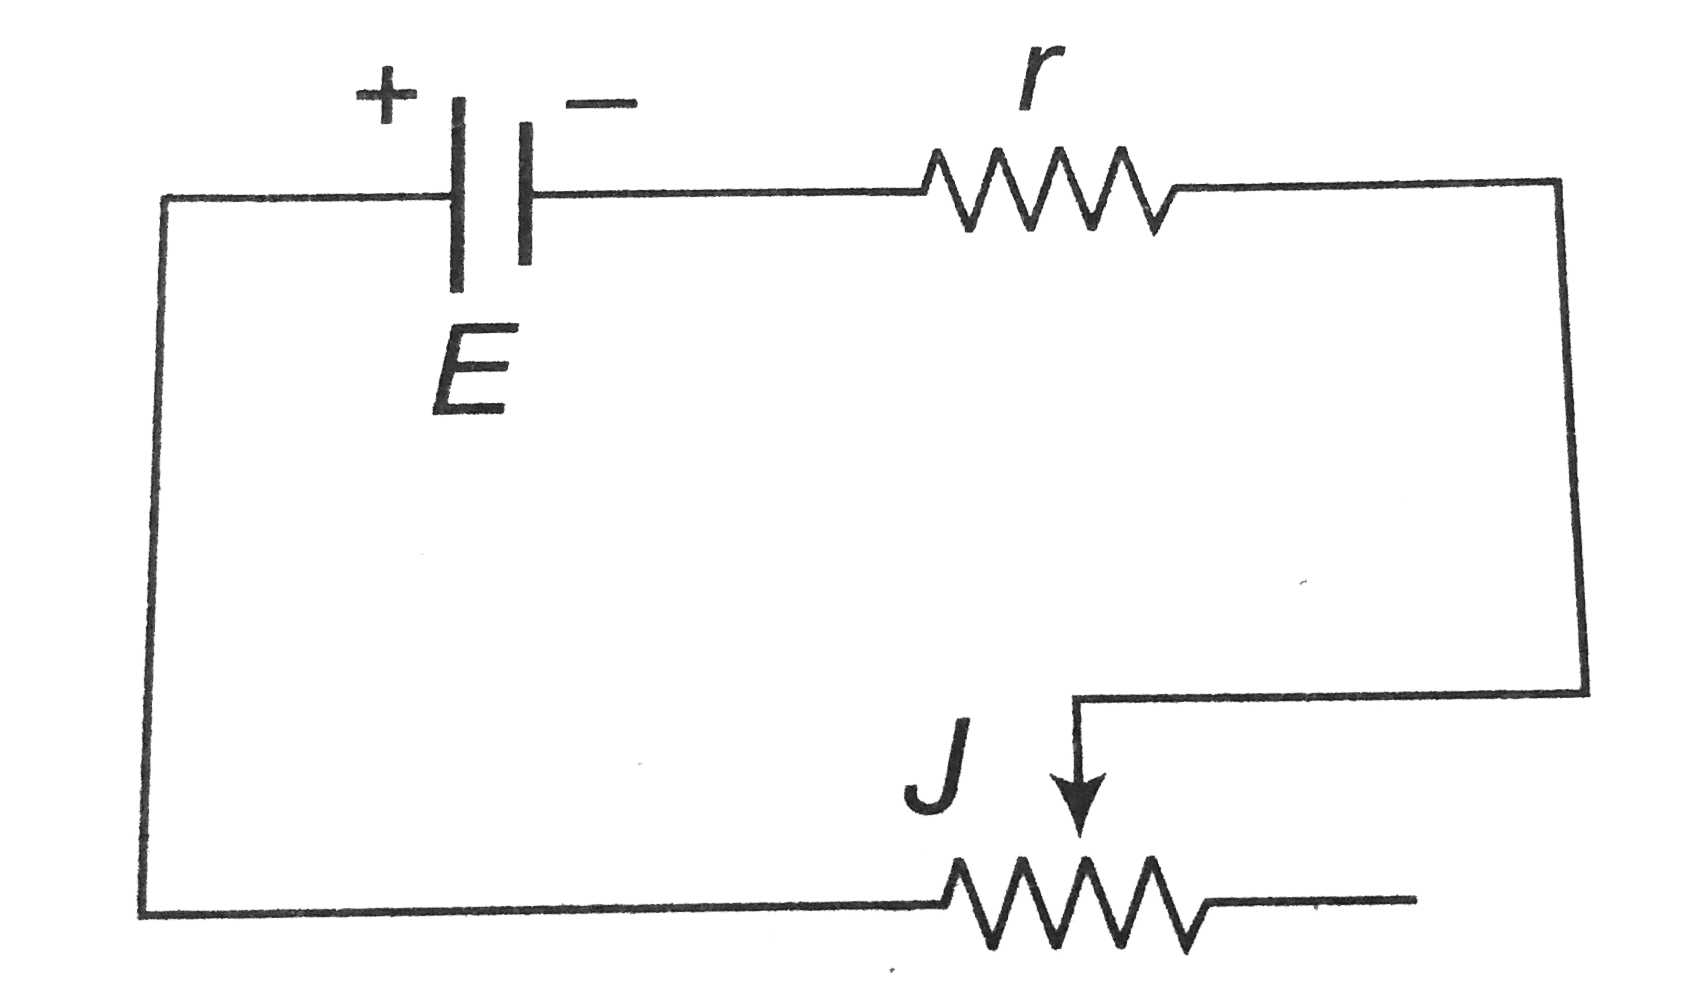
Battery shown in figure has e.m.f. E and internal resistance r. Current in the circuit can be varied by sliding the contact J. If at any instant current flowing through the circuit is I, potential difference between terminals of the cells is V, thermal power generated in the cell is equal to η fraction of total electrical power generated in it, then which of the following graphs is correct ?
View SolutionA storage battery with emf 2.6V loaded with external resistance produces a current 1A. In this case, the potential difference between the terminals of the storage battery equals 2V. Find the thermal power generated in the battery and the net power supplied by the battery for external circuit.
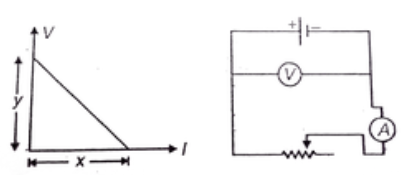
View SolutionFor the determination of emf E and internal resistance 'r' of a cell , the graph is obtained between potential difference V between the terminal of the cell against the current l, which was changed by adjusting the rheostat, is as shown . The internal resistance of the cell is
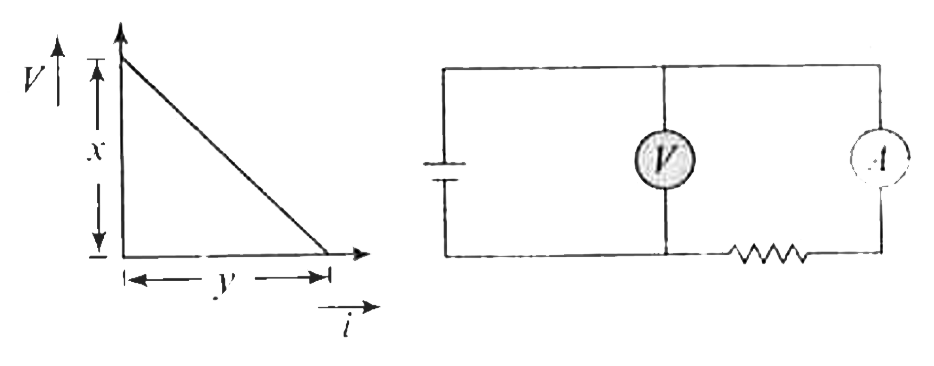
View SolutionA battery of emf E has an internal resistance r. A variable resistacne R is connected to the terminals of the battery. A current i is drawn from the battery. V is the terminal potential difference. If R alone is gradually reduced to zero, which of the following best describes i and V?
View SolutionA power supply with an e.m.f ε and internal resustance r is connected to a variable resistance R. Find the dependence of the total power generated by the supply and of the power delivered to the external circuit on the load resistance.
View SolutionIn an experiment, a graph was plotted of the potential difference V between the terminals of a cell against the circuit current "I" by varying load rheostat, internal conductance of the cell is given by
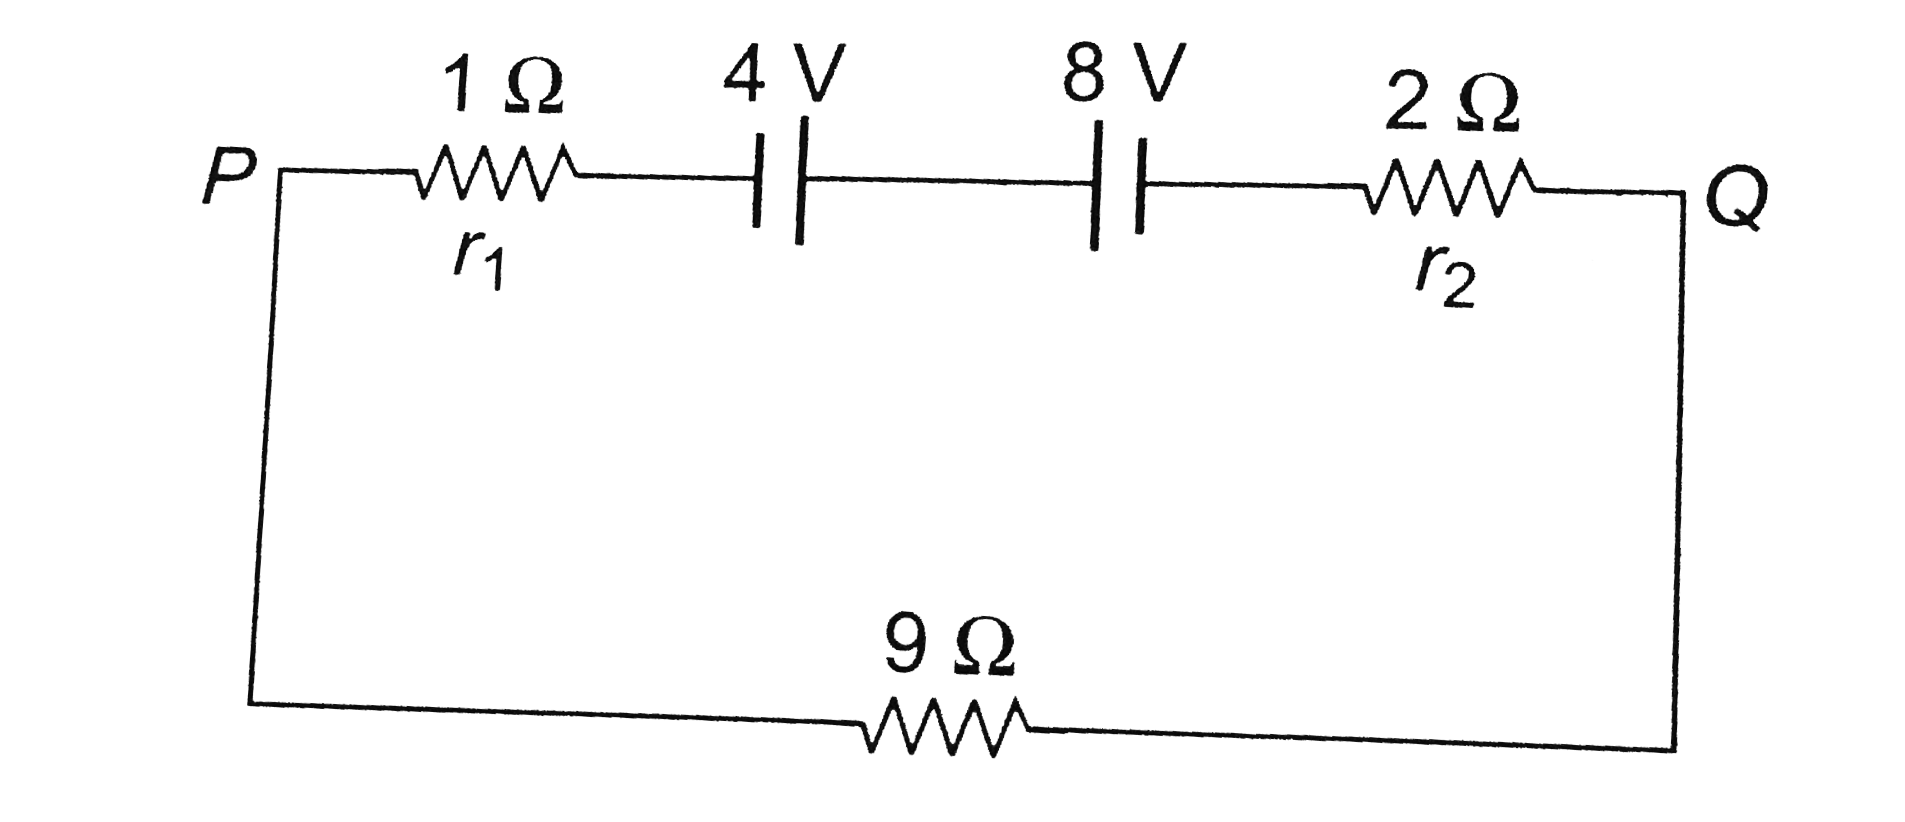
View SolutionTwo batteries of e.m.f. 4V and 8V with internal resistances 1Ω and 2Ω are connected in a circuit with a resistance of 9Ω as shown in figure. The current and potential difference between the points P and Q
View Solution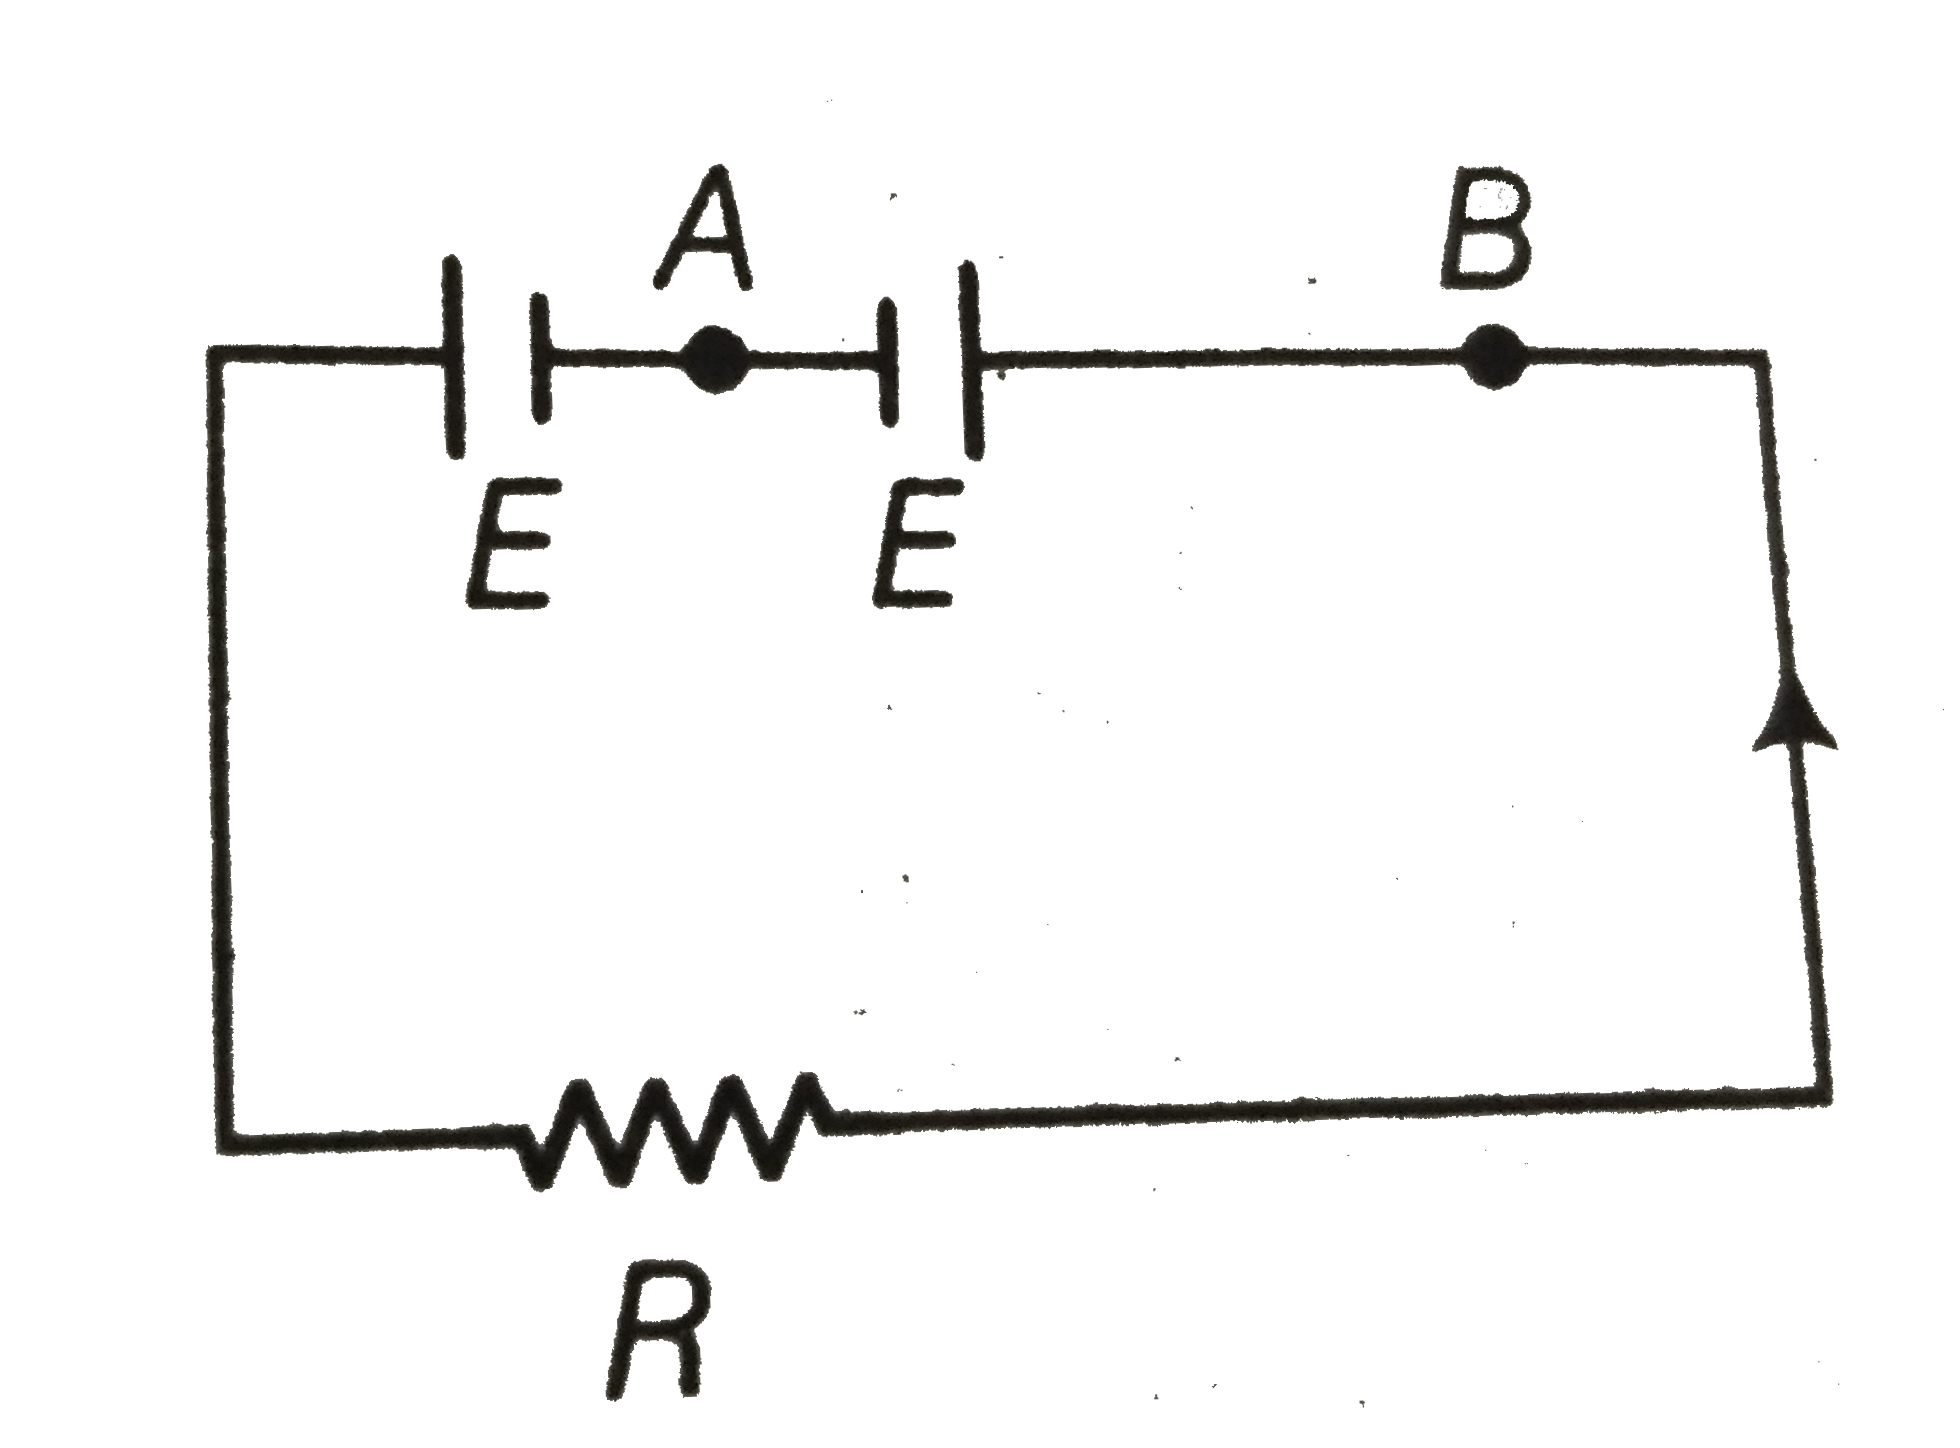
Two cells of same emf E but internal resistance r1andr2 are connected in series to an external resistor R(figure). What should be the value of R so that the potential difference across the terminals of the first cell becomes zero?
View SolutionAn element with emfε and interval resistance r is connected across an external resistance R. The maximum power in external circuit is 9W. The current flowing through the circuit in these conditions is 3A. Then which of the following is // are correct ?
View SolutionA battery has e.m.f. 4 V and internal resistance r . When this battery is connected to an external resistance of 2 ohms , a current of 1 amp . flows in the circuit. How much current will flow if the terminals of the battery are connected directly
View Solution
