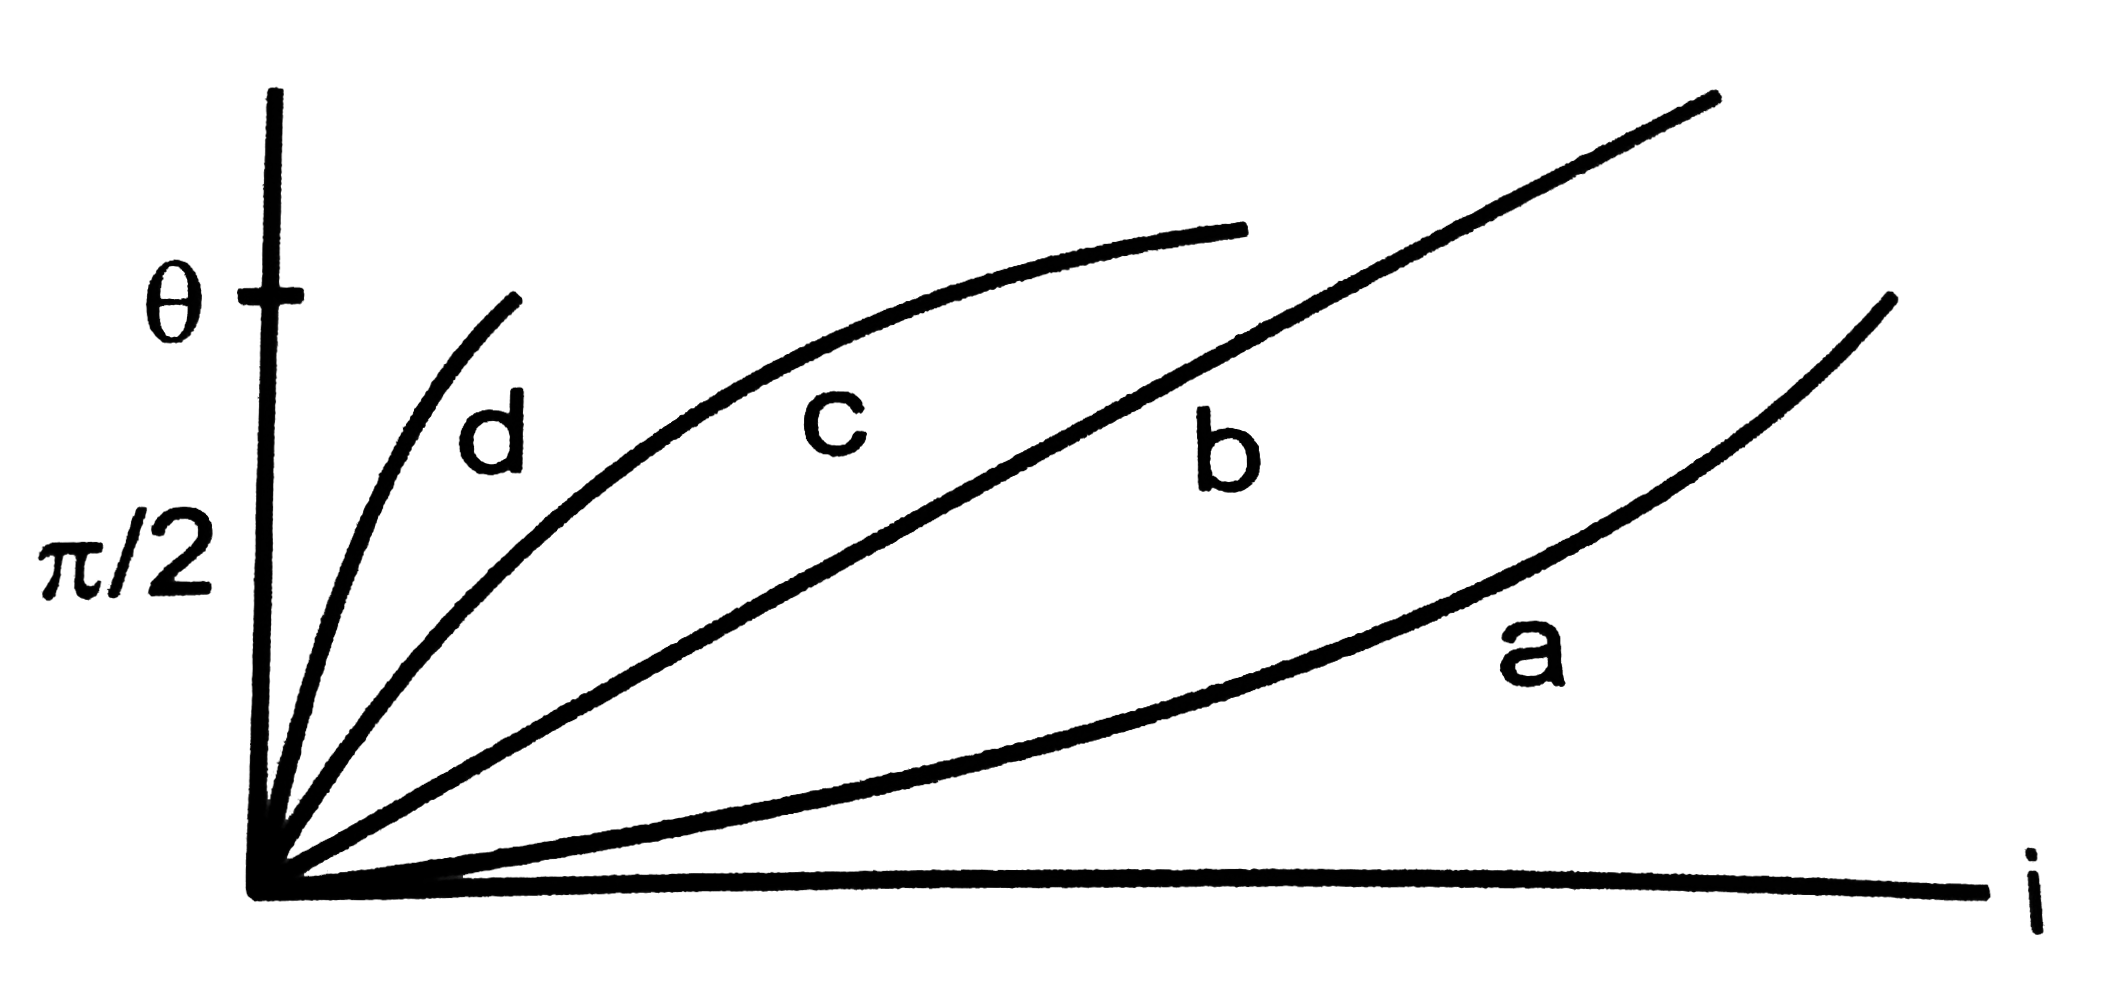
Which of the following plots may represent the thermal energy produced in a resistor in a given time as a function of the electric current? Figure

a
b
c
d
The correct Answer is:D
Step by step video & image solution for Which of the following plots may represent the thermal energy produced in a resistor in a given time as a function of the electric current? Figure by Physics experts to help you in doubts & scoring excellent marks in Class 12 exams.
Updated on:21/07/2023Topper's Solved these Questions
- HEATING EFFECT OF CURRENTBOOK - CENGAGE PHYSICS ENGLISHCHAPTER - HEATING EFFECT OF CURRENTEXERCISE - Thermal Power in Resistance Connected in Circuit
27 Videos
- HEATING EFFECT OF CURRENTBOOK - CENGAGE PHYSICS ENGLISHCHAPTER - HEATING EFFECT OF CURRENTEXERCISE - Integer
5 Videos
- GEOMETRICAL OPTICSBOOK - CENGAGE PHYSICS ENGLISHCHAPTER - GEOMETRICAL OPTICSEXERCISE - Integer Type
4 Videos
- INDUCTANCEBOOK - CENGAGE PHYSICS ENGLISHCHAPTER - INDUCTANCEEXERCISE - Concept Based
8 Videos
Similar Questions
Which of the following plotes may represent the thermal energy produced in a resistor in a given time as a function of the electric current? Figure

View SolutionWhich of the following plots represents an ideal binary mixture?
View SolutionWhich of the following plots may represent the reactance of a series LC combination?

View SolutionWhich of the following plots does not represent Boyle's law?
View SolutionWhich of the following may represent the direction of →VAB?

View SolutionWhich of the following plots may represent is impedence of a series LCR combination?
View SolutionWhich of the following defects is represented in the given figure ?

View SolutionWhich of the following plots represents the behavior of an ideal binary liquid solution ?
View SolutionWhich of the following four graphs may best represent the current deflection relation in a tangent galvanometer?

View SolutionWhich one of the following graphs represent a function? (FIGURE)
View Solution
