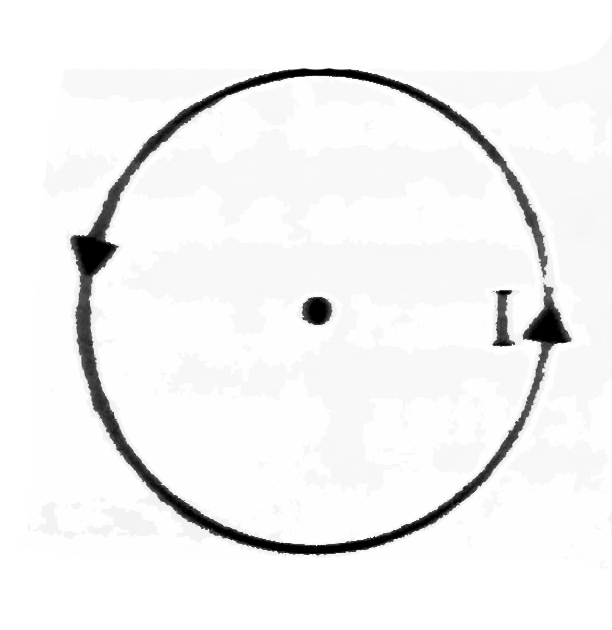
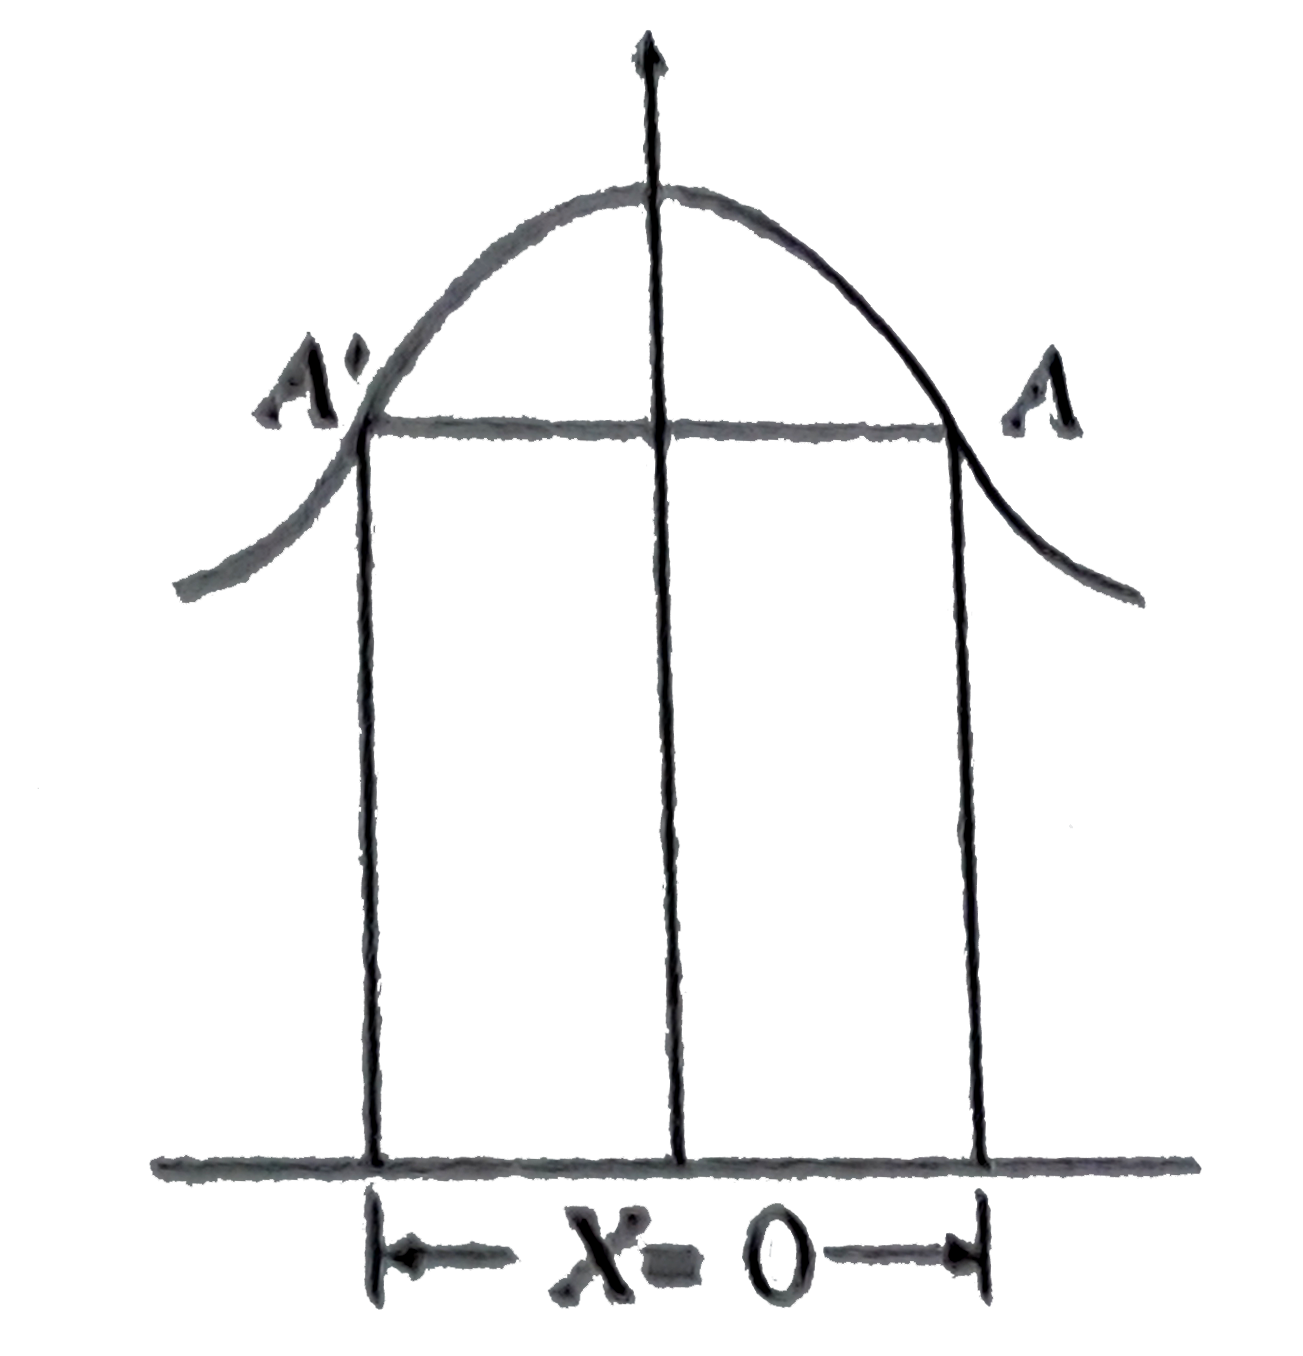
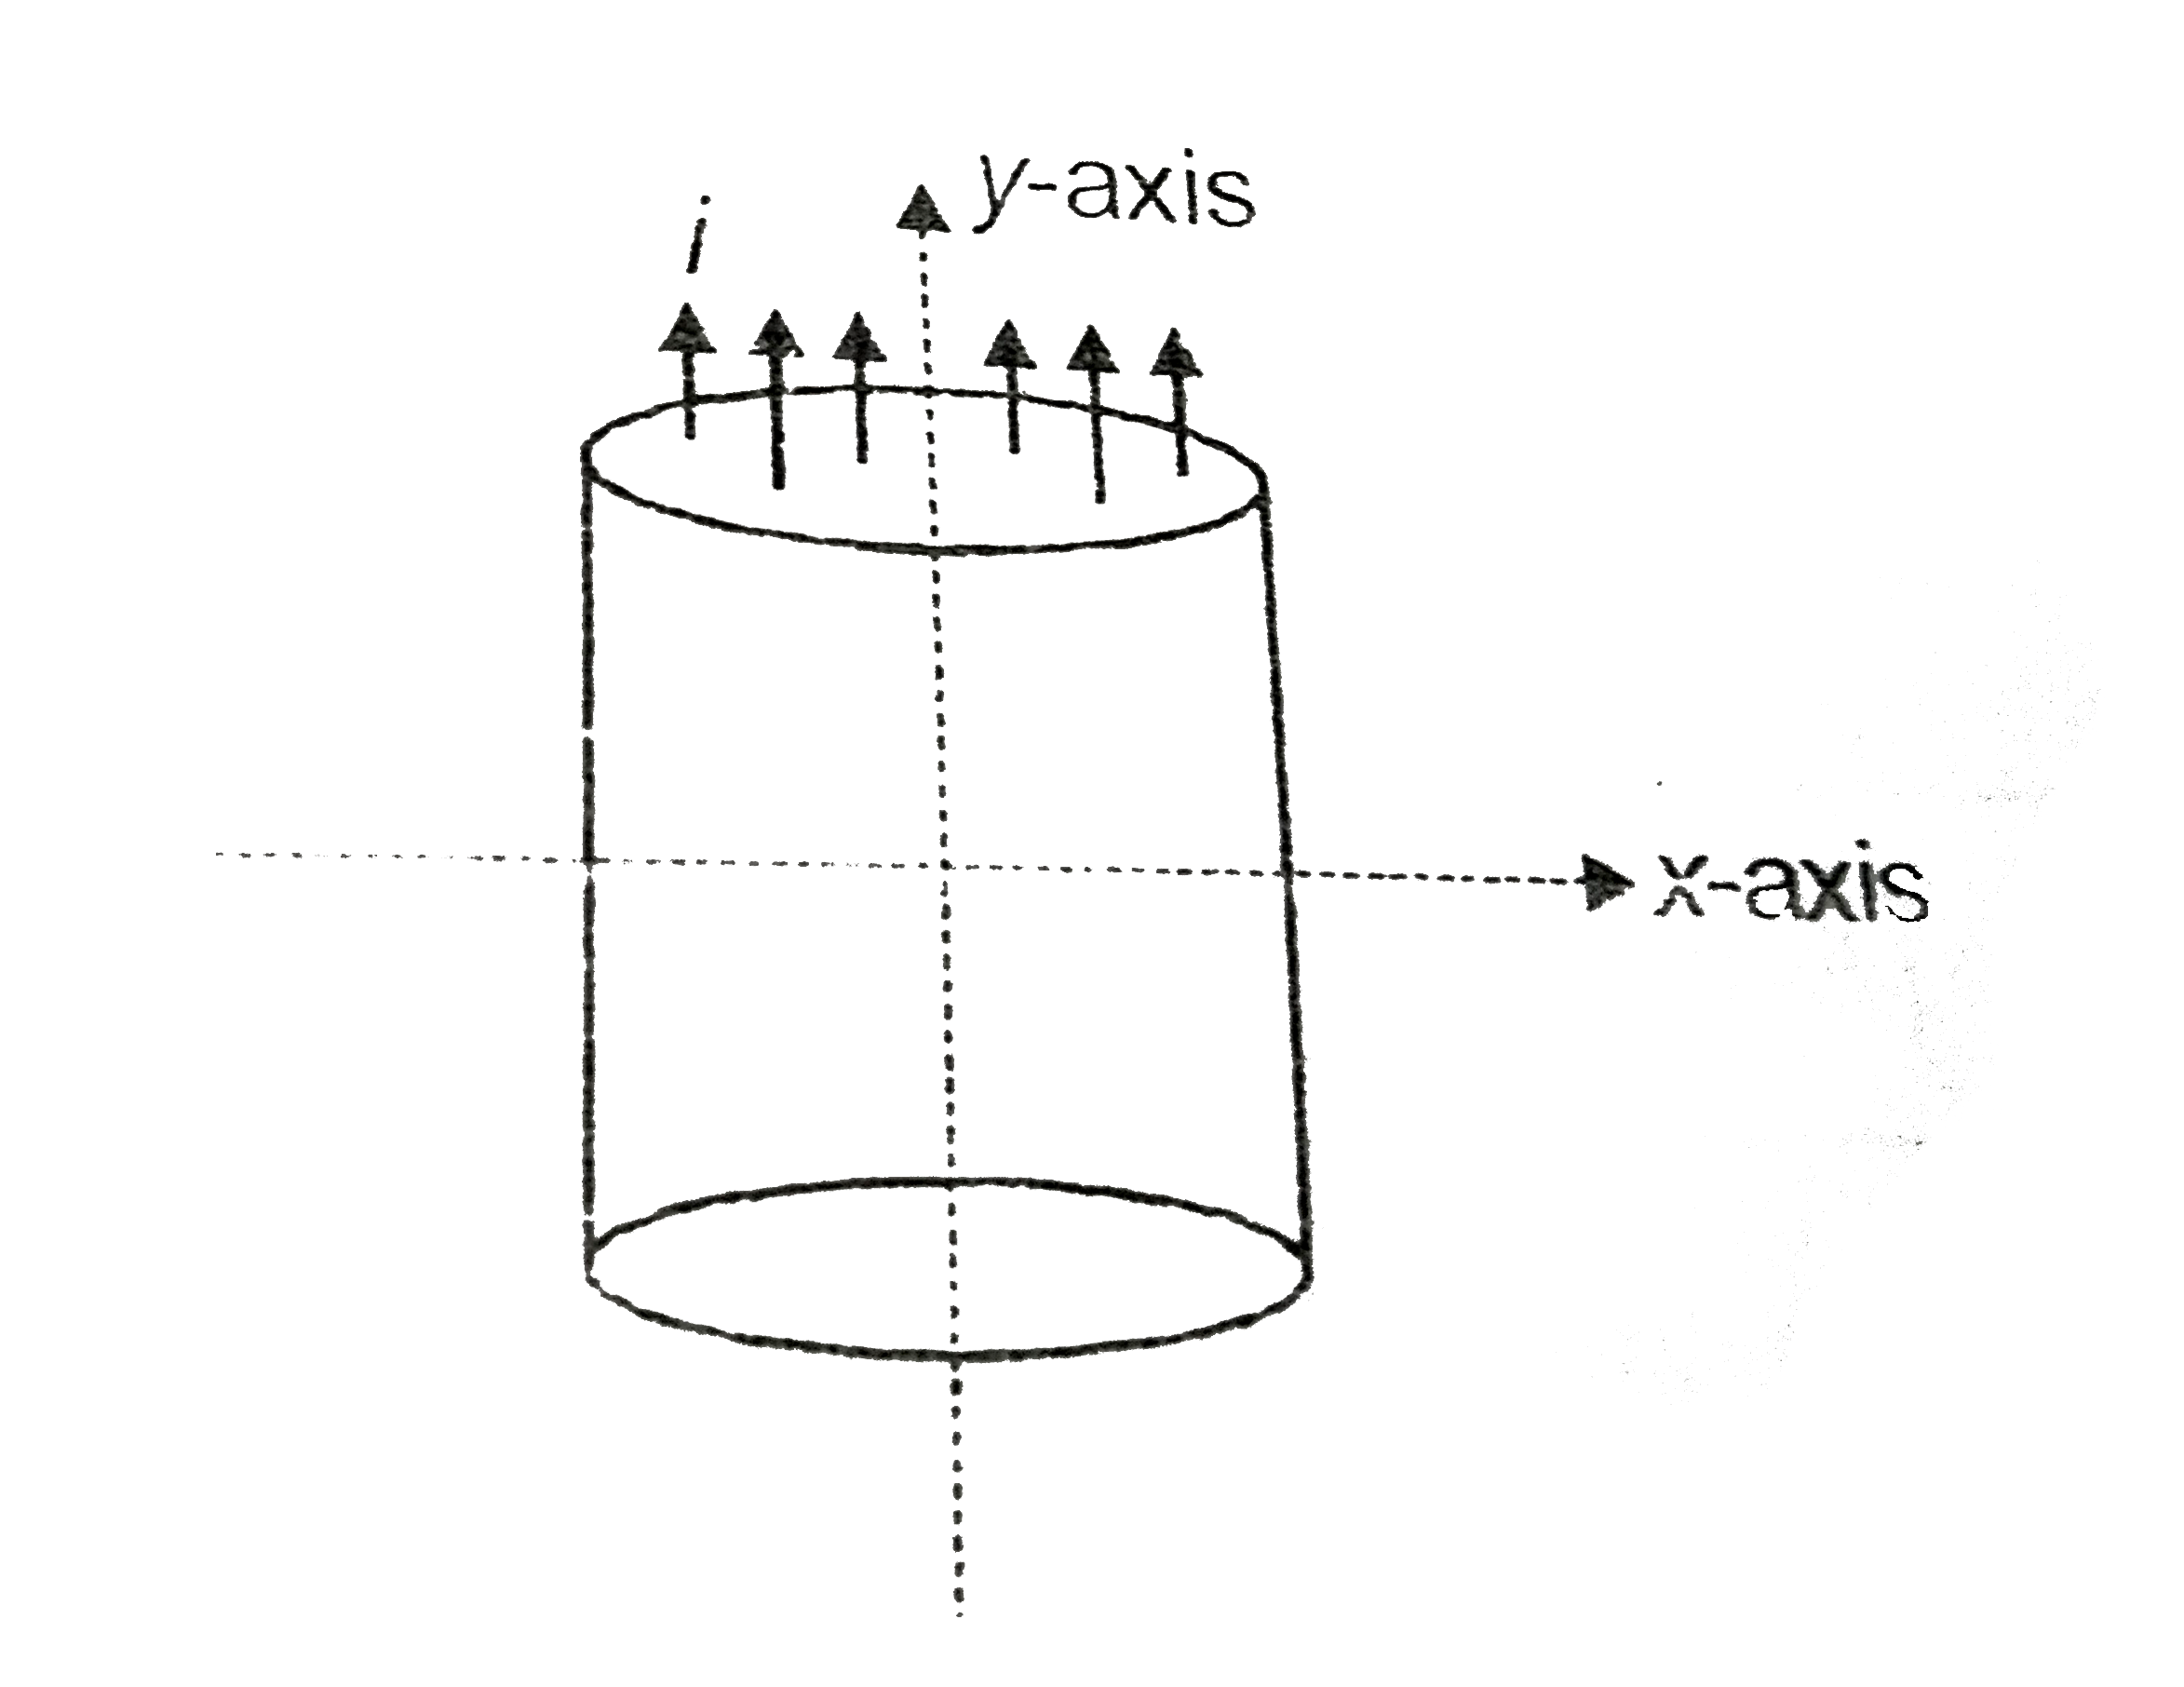
A circular coil is in y−z plane with centre at origin. The coil is carrying a constant current. Assuming direction of magnetic field at x=–25cm to be positive direction of magnetic field, which of the following graphs shows variation of magnetic field along x-axis


The correct Answer is:(a) −2.5×10⁻⁶ T.m. (b) The value of ∮→B.dx depends only on the current enclosed ,and not the shape of the Amperian loop.
To solve the problem step by step, we need to analyze the situation described and derive the relationship between the magnetic field and the position along the x-axis.
1. Understanding the Setup:
- A circular coil is placed in the y-z plane with its center at the origin (0, 0, 0).
- The coil carries a constant current, which generates a magnetic field around it.
2. Direction of the Magnetic Field:
- The problem states that the direction of the magnetic field at x=−25cm is considered to be in the positive direction.
- Due to the symmetry of the circular coil, the magnetic field will point in the same direction on both sides of the coil (i.e., for x<0 and x>0).
3. Magnetic Field Formula:
- The magnetic field B at a distance r from a circular coil can be expressed using the formula:
B=μ04π⋅mr3
- Here, m is the magnetic dipole moment, which can be calculated as:
m=n⋅I⋅A
where n is the number of turns, I is the current, and A is the area of the coil.
4. Substituting for r:
- In our case, we can replace r with x (the distance along the x-axis), leading to:
B=μ04π⋅n⋅I⋅Ax3
5. Behavior of Magnetic Field:
- From the equation B∝1x3, we can deduce that:
- As x approaches 0 (the coil center), B becomes very large (theoretically infinite).
- As |x| increases (moving away from the coil), B decreases rapidly.
6. Graphical Representation:
- The magnetic field B is positive for both x<0 and x>0 due to the symmetry and the direction of the magnetic field.
- The graph of B versus x will show that B approaches infinity as x approaches 0 and decreases as |x| increases.
7. Identifying the Correct Graph:
- Based on the above analysis, the correct graph will show:
- A positive magnetic field for both negative and positive values of x.
- A steep drop in the magnetic field as we move away from the center of the coil.
Conclusion:
The correct graph that represents the variation of the magnetic field along the x-axis is the one that shows a positive value for B on both sides of the origin and a rapid decrease as |x| increases.
- A circular coil is placed in the y-z plane with its center at the origin (0, 0, 0).
- The coil carries a constant current, which generates a magnetic field around it.
- The problem states that the direction of the magnetic field at x=−25cm is considered to be in the positive direction.
- Due to the symmetry of the circular coil, the magnetic field will point in the same direction on both sides of the coil (i.e., for x<0 and x>0).
- The magnetic field B at a distance r from a circular coil can be expressed using the formula:
B=μ04π⋅mr3
- Here, m is the magnetic dipole moment, which can be calculated as:
m=n⋅I⋅A
where n is the number of turns, I is the current, and A is the area of the coil.
- In our case, we can replace r with x (the distance along the x-axis), leading to:
B=μ04π⋅n⋅I⋅Ax3
- From the equation B∝1x3, we can deduce that:
- As x approaches 0 (the coil center), B becomes very large (theoretically infinite).
- As |x| increases (moving away from the coil), B decreases rapidly.
- The magnetic field B is positive for both x<0 and x>0 due to the symmetry and the direction of the magnetic field.
- The graph of B versus x will show that B approaches infinity as x approaches 0 and decreases as |x| increases.
- Based on the above analysis, the correct graph will show:
- A positive magnetic field for both negative and positive values of x.
- A steep drop in the magnetic field as we move away from the center of the coil.
The correct graph that represents the variation of the magnetic field along the x-axis is the one that shows a positive value for B on both sides of the origin and a rapid decrease as |x| increases.
Topper's Solved these Questions
- SOURCES OF MAGNETIC FIELDBOOK - CENGAGE PHYSICS ENGLISHCHAPTER - SOURCES OF MAGNETIC FIELDEXERCISE - single correct Answer Type
35 Videos
- SOURCES OF MAGNETIC FIELDBOOK - CENGAGE PHYSICS ENGLISHCHAPTER - SOURCES OF MAGNETIC FIELDEXERCISE - single correct Ansewer type
12 Videos
- SOURCES OF MAGNETIC FIELDBOOK - CENGAGE PHYSICS ENGLISHCHAPTER - SOURCES OF MAGNETIC FIELDEXERCISE - Archives (integer)
1 Videos
- RAY OPTICSBOOK - CENGAGE PHYSICS ENGLISHCHAPTER - RAY OPTICSEXERCISE - DPP 1.6
12 Videos
- WAVE OPTICSBOOK - CENGAGE PHYSICS ENGLISHCHAPTER - WAVE OPTICSEXERCISE - Comprehension Type
14 Videos
Similar Questions
A coil carrying electric current is placed in uniform magnetic field
View SolutionThe force exerted on a current-carrying wire placed in magnetic field is zero when the angle between the wire and the direction of magnetic field is :
View SolutionA thin wire of length l is carrying a constant current. The wire is bent to form a circular coil. If radius of the coil, thus formed, is equal to R and number of turns in it is equal to n, then which of the following graphs represent (s) variation of magnetic field induction (B) at centre of the coil
View SolutionA thin wire of length l is carrying a constant current. The wire is bent to form a circular coil. If radius of the coil, thus formed, is equal to R and number of turns in it is equal to n, then which of the following graphs represent (s) variation of magnetic field induction (B) at centre of the coil
View SolutionThe magnetic field at the centre of the current carrying coil is
View SolutionIn figure is shown a circular loop carrying current I. Show the direction of the magnetic field with the help of lines of force.

View SolutionThe variation of magnetic field (B) due to circular coil as the distance X varies is shown in the graph. Which of the following is false

View SolutionA proton is moving along the negative direction of X-axis in a magnetic field directed along the positive direction of Y-axis. The proton will be deflected along the negative direction of
View SolutionAn electron beam projected along + X-axis, experience a force due to a magnetic field along the + Y-axis. What is the direction of the magnetic field?
View SolutionThe figure shows a long straight current carrying conductor. Can you plot the variation of magnetic field on x-axis ?

View Solution
